Quantpedia’s Research Workflow: From Idea Discovery to Portfolio Construction
Introduction
Quantitative strategy research is rarely about discovering a single “perfect” trading rule. In practice, robust portfolios emerge from a structured research process that filters ideas, evaluates evidence, and combines complementary strategies.
In this article, we demonstrate how such a workflow can be implemented using the tools available in Quantpedia Pro. Rather than focusing on maximizing the performance of a single strategy, we walk through the research process step by step—from thematic filtering to portfolio-level evaluation.
To make the process concrete, we use value-based equity strategies as our working example. However, the goal of the article is not to identify the ultimate value strategy, but to illustrate how a systematic research workflow can be used to build a diversified portfolio of strategies around any investment hypothesis.
Strategy Discovery Using the Screener
The starting point is a clearly defined objective. In our case, it’s to build a diversified equity portfolio based on value stock picking strategies.
The Screener module serves as the entry point for narrowing the universe of available strategies.
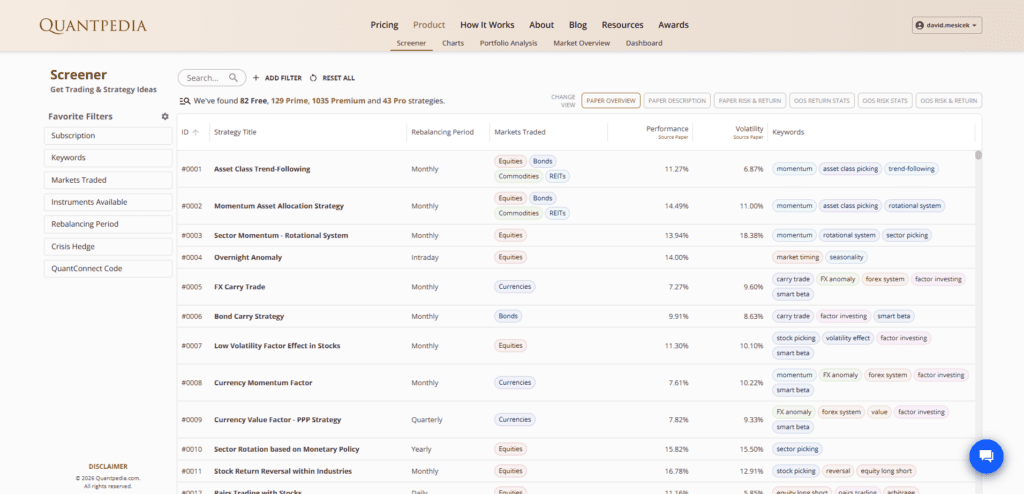
The Screener provides structured access to Quantpedia’s database, allowing strategies to be filtered by theme, asset class, implementation characteristics and performance metrics.
Applying Thematic Filters
To isolate relevant candidates, several filters are applied. Using the Keyword filter, strategies categorized under value are selected.

The universe is restricted to strategies trading equities.

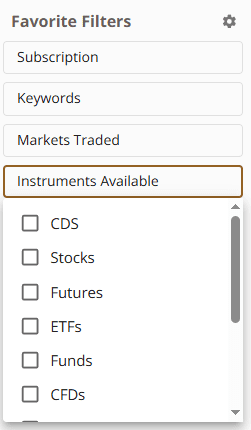
The instrument filter ensures that strategies trade stocks rather than futures or other derivatives.
Rebalancing frequency is reviewed to ensure practical implementability. Monthly or quarterly rebalancing is typically more realistic for stock selection strategies.

Although not mandatory for value research, the crisis hedge filter can highlight whether certain strategies display defensive characteristics.

After applying these filters, the broad database is reduced to a focused subset of value based stock picking strategies. At this stage, no final decision is made. The goal is simply to identify candidates worth deeper evaluation.

Out of Sample Validation
Many academic strategies look compelling in sample. The more important question is how they behave outside of their original testing period.
Quantpedia allows switching to out of sample statistics directly in the Screener.

Different statistical views are available including paper metrics and out of sample metrics.

Out of sample return statistics help evaluate whether performance persists over multi year horizons.

Out of sample risk statistics provide insight into drawdowns and volatility during the validation period.
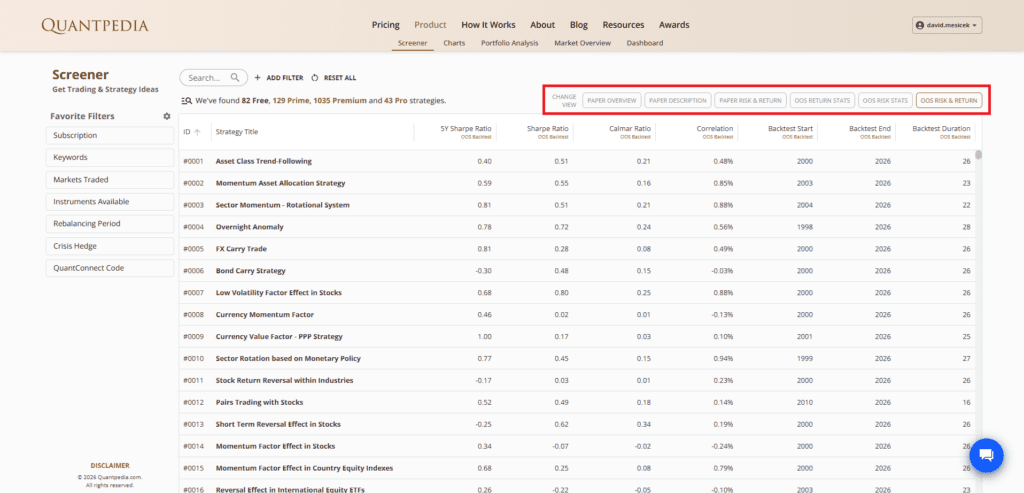
The combined out of sample risk and return view allows balanced comparison.
At this stage, the objective is not to select the highest return strategy. Instead, attention is given to strategies that demonstrate reasonable and stable Sharpe ratios, controlled drawdowns, consistency across time and clear economic intuition.
From here, a shortlist of several candidates can be constructed.
Moving from Strategy to Portfolio
Single strategies, even when robust on their own, often behave similarly during market stress. Diversification across implementations can smooth the overall profile.
The next step is therefore to move to the Portfolio Analysis module.
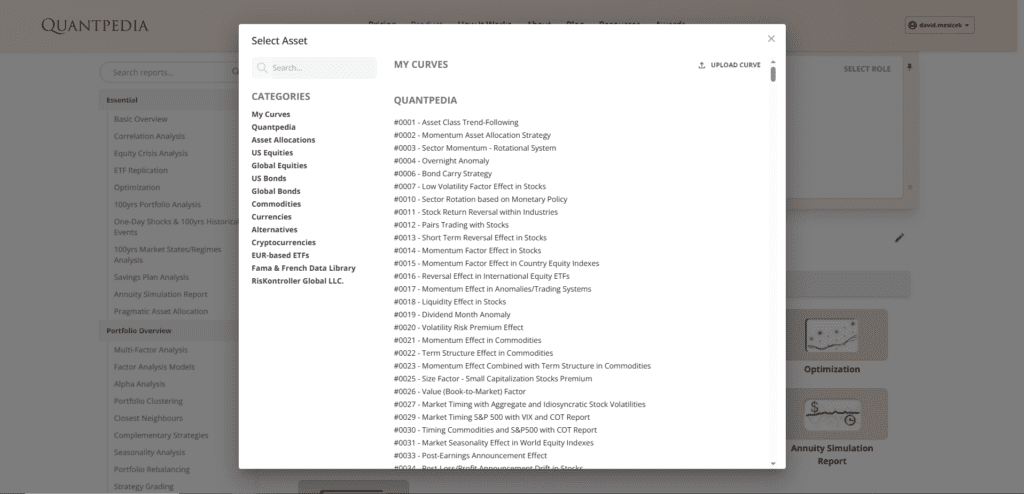
Shortlisted strategies are added to Portfolio 1.
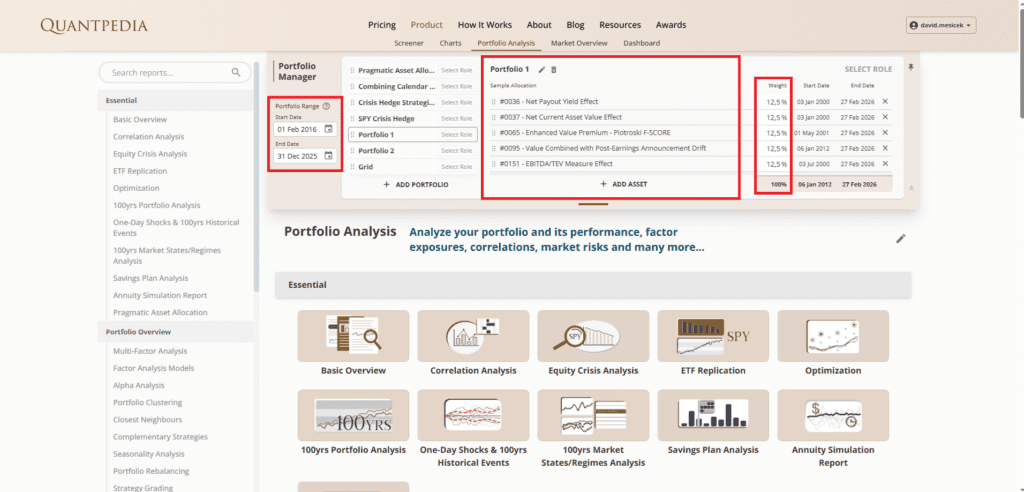
The Portfolio Manager allows multiple portfolios to be created and assigned analytical roles.
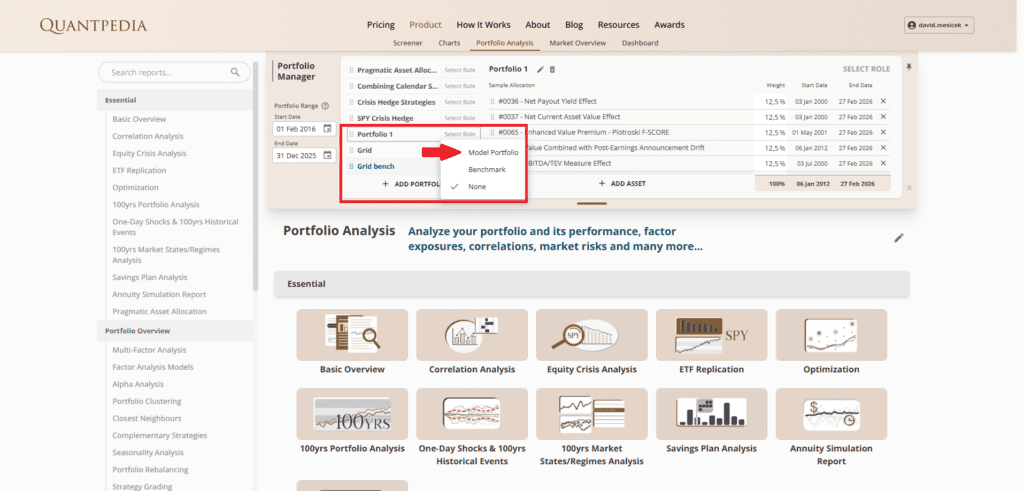
Portfolio 1 is assigned the role of Model Portfolio.

Equal weighting is used initially. The purpose is to observe structural interaction before adjusting allocations.
The objective at this stage is assessment rather than optimization.
Defining a Benchmark
Any portfolio analysis requires a reference point.
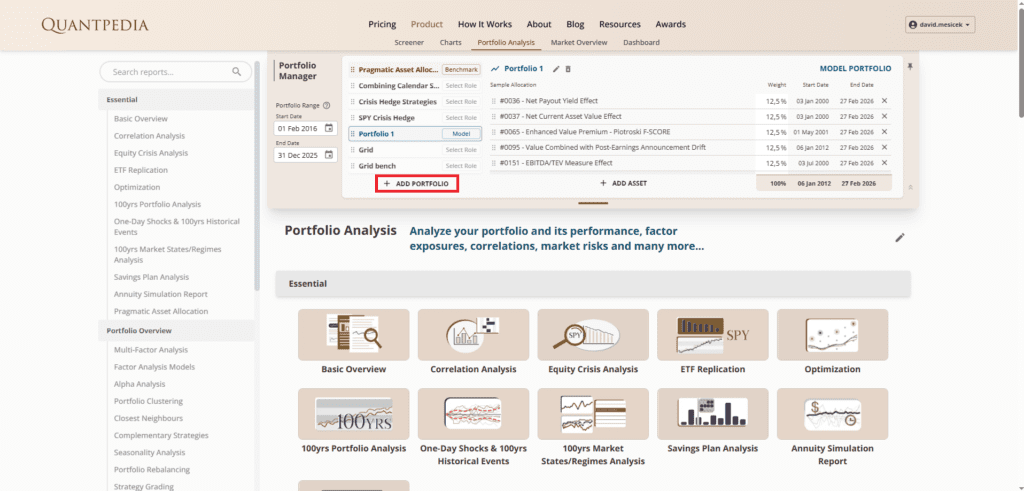
A second portfolio is created.
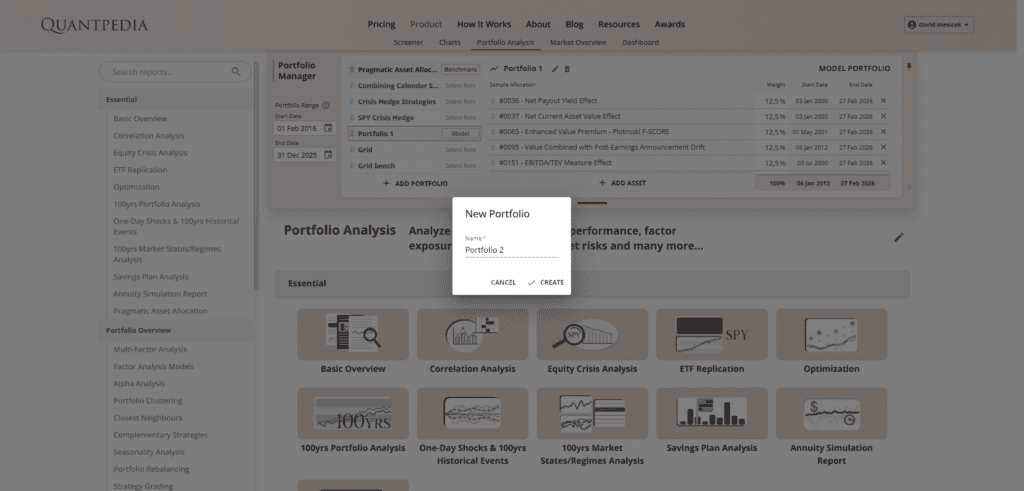
Portfolio 2 serves as the benchmark portfolio.
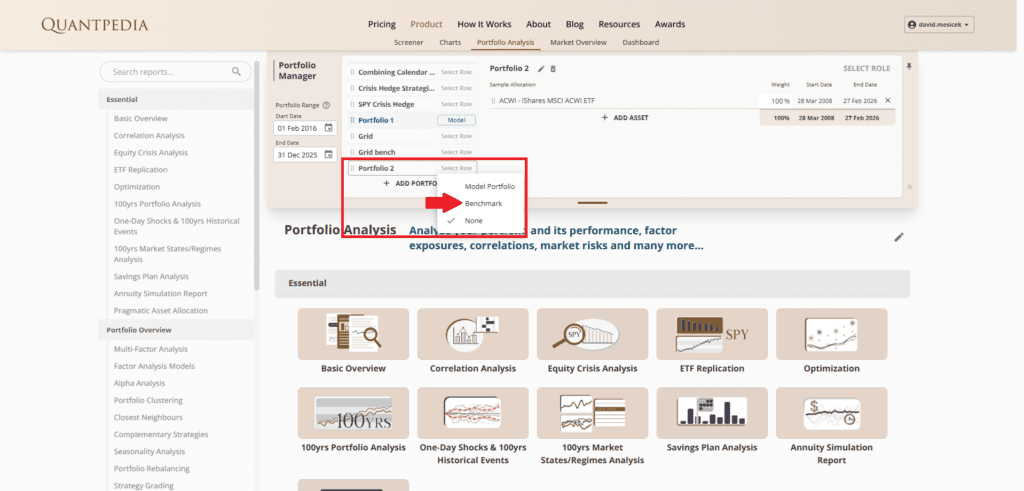
Portfolio 2 is assigned the role of Benchmark.
The benchmark typically represents broad equity exposure. This allows evaluation of whether diversification across value strategies provides structural improvement relative to passive exposure.
Evaluating Performance
With both portfolios defined, the Basic Overview module is used.
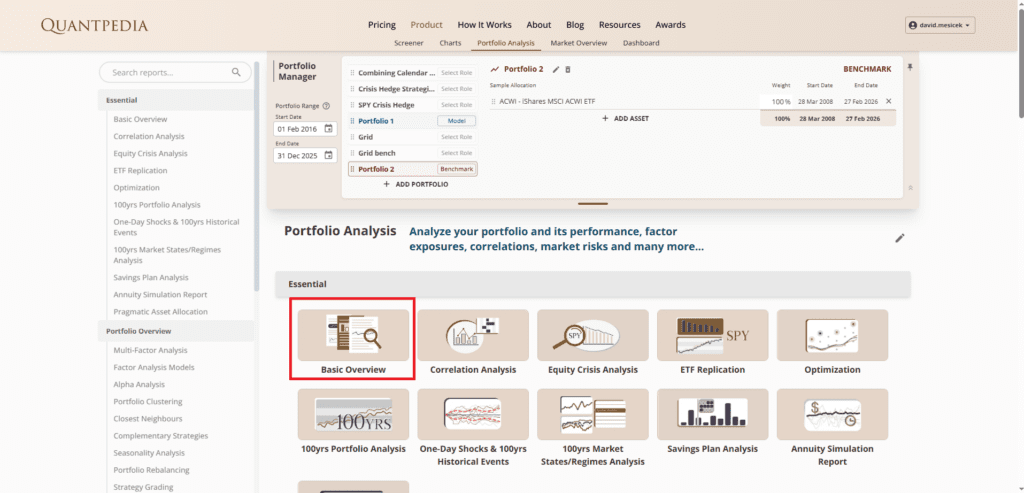
The Basic Overview provides cumulative returns, volatility measures and drawdown statistics.
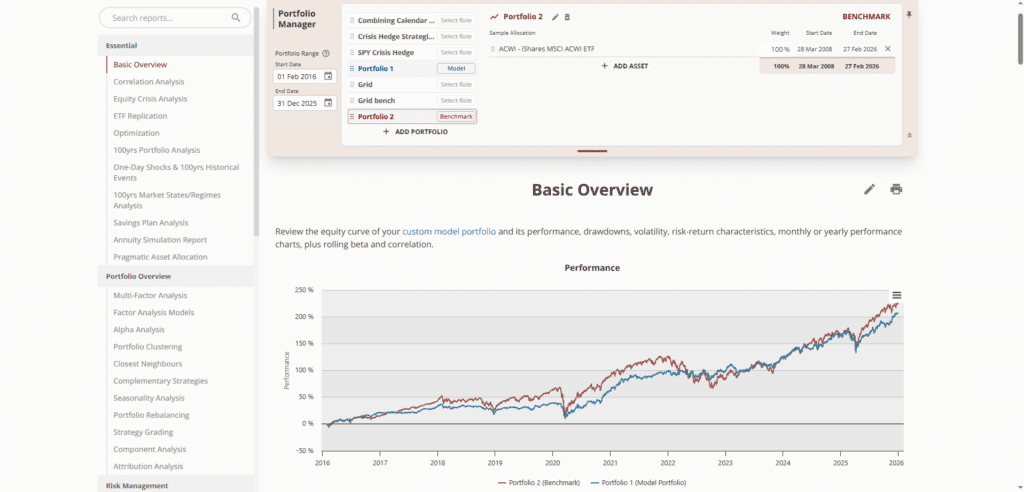
The comparison focuses on practical questions.
Does the diversified value portfolio improve risk adjusted performance?
Are drawdowns shallower or shorter?
Is volatility meaningfully reduced?
Is performance dependent on specific market regimes?
The aim is not necessarily to outperform in every period, but to improve the efficiency of the return profile.
Correlation and Diversification
Diversification only works if components do not move in perfect sync. Using Correlation Analysis report within Portfolio Analysis, it is possible to assess the degree of overlap between strategies, whether drawdowns occur simultaneously and whether diversification reduces concentration risk. If correlations are high and behavior is nearly identical, combining strategies adds limited value. If correlations are moderate, the portfolio may exhibit smoother performance and reduced tail risk.
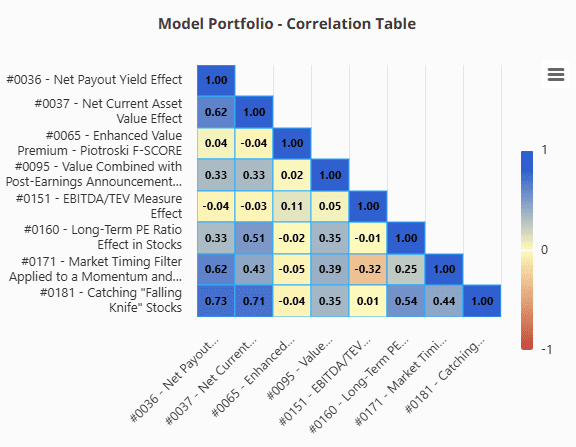
This step helps distinguish real diversification from superficial diversification.
Crisis and Stress Analysis
Value strategies can underperform during certain regimes. It is therefore important to evaluate behavior during historical stress periods. Crisis Analysis tools allow testing performance across major market downturns.
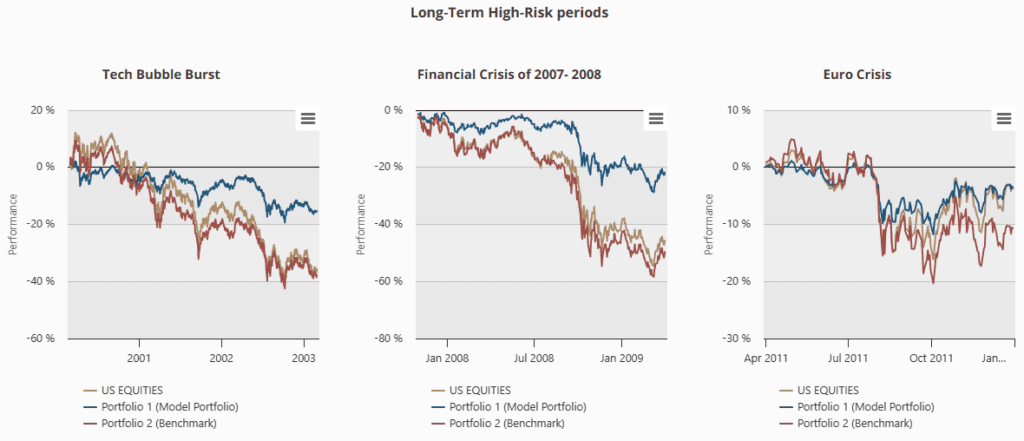
Relevant questions include:
Does the value portfolio reduce drawdowns relative to the benchmark?
How quickly does it recover?
Is tail risk amplified or mitigated?
If diversification improves behavior during stress periods, the allocation becomes more attractive from a risk management perspective.
An Iterative Process
The workflow does not end after the first evaluation.
Research typically follows an iterative loop.
Screen → Validate → Combine → Compare → Diagnose → Refine
Screen
Identify a focused subset of strategies using thematic filters and structural criteria.
Validate
Confirm robustness using out of sample performance and risk statistics.
Combine
Construct a diversified model portfolio from shortlisted candidates.
Compare
Evaluate the model against a relevant benchmark.
Diagnose
Analyze correlation structure, drawdowns and behavior during stress periods.
Refine
Adjust composition, remove redundancy, rebalance weights and re test.
Quantpedia is most effective when used as part of this loop rather than as a static library of ideas.
Conclusion
Value stock picking remains a structurally supported equity factor. However, translating academic insights into practical portfolios requires more than selecting a single strategy. A robust approach involves careful thematic filtering, out of sample validation, diversification across implementations, benchmark relative evaluation and structural risk diagnostics. The workflow presented here demonstrates how a value hypothesis can be transformed into a portfolio level research framework using Quantpedia Pro. The same process can be applied to any other thematic research question.
Author: David Mesíček, Junior Quant Analyst, Quantpedia
Are you looking for more strategies to read about? Sign up for our newsletter or visit our Blog or Screener.
Do you want to learn more about Quantpedia Premium service? Check how Quantpedia works, our mission and Premium pricing offer.
Do you want to learn more about Quantpedia Pro service? Check its description, watch videos, review reporting capabilities and visit our pricing offer.
Do you want algorithmic access to the full Quantpedia database via the API? Subscribe to Quantpedia Pro, ask for an API key, and explore the in/out-of-sample statistics, source academic papers, and code snippets — ideal for quantitative research, systematic trading workflows, and AI model training.
Are you looking for historical data or backtesting platforms? Check our list of Algo Trading Discounts.
Or follow us on:
Facebook Group, Facebook Page, Telegram, Twitter, Linkedin, Medium or Youtube
Share onLinkedInTwitterFacebookRefer to a friend


