Reviewing Patent-to-Market Trading Strategies
The following article is a short distillation of the research paper Leveraging the Technical Competence of a Stock for the Purpose of Trading written by Rishabh Gupta. The author spent a summer internship at Quantpedia, investigating the Patent-to-Market (PTM) ratio developed by Jiaping Qiu, Kevin Tseng, and Chao Zhang. The PTM ratio uses public information about the number and dates of patents assigned to publicly listed companies, calculates an expected market value of patents, and tries to predict future stock performance.
Overview of patents and their connection to financial markets
As the emphasis of the leading global tech and pharma companies is shifting towards technical know-how, companies are investing heavily on research and development and are entering the era of intangible assets, which serves as a significant element of a corporate’s market value. According to Ocean Tomo consulting, Intangible assets accounted for 90% of the market value of S&P 500 in 2020. The event of granting of a patent has proved to be one of the most significant event for any listed company. For example – UK based Poolbeg pharma’s stock price rose by 26% in May 2022 after winning two patents for treating influenza and for treating respiratory virus infections. There have been numerous studies conducted on the use of patent data for financial analysis. For example, Peter Neuhäusler et al. (2011) examined the impact of a firm’s technology and patenting on the firm’s market value; Hamdi Ben Nasr et al. (2021) found a negative correlation between the number of patents (a large sample of US firms) and stock price crash risk. This essay makes an effort to illuminate patents in a unique way. The major focus is on observing the stock price behavior after the days the patent is awarded and making a trade as a result.
The development of Patent to market (PTM) ratio
Jiaping Qiu, Kevin Tseng and Chao Zhang came up with a measure “PTM ratio” to compute market value of a firm attributable to its patents, in their research paper “Patent to market premium”. According to the authors, taking a long position in a portfolio of tickers with a high PTM ratio and a short position in a portfolio of tickers with a low PTM ratio results in a monthly equity return of 71 basis points for a hedging portfolio. Let’s see what the study article has to say regarding the methods and conclusions related to PTM ratios:
- PTM accounts for 11% to 20% of a company’s market worth.
- To prove that PTM ratio captures only distinct information from the equity return explanatory variables (Market cap, innovative efficiency, etc), the researchers used Fama-MacBeth cross sectional regression.
- For investigating asset pricing implications of a patent, the researchers used the Generalized method of moment test and it was shown that PTM ratio is a priced risk factor, meaning that it is a factor that affects price risk of a stock (risk that the value of a security will decrease).
- Both the value weighted and equal weighted portfolios show that portfolios with high PTM ratio generate excess returns.
- Firms with higher PTM ratio:
- are more flexible in delaying exercising of their option and are more robust to economic downturns (as per real options theory),
- have higher RDME (Research and development expenses to market value of equity) and higher innovative efficiency (measured based on patent citations as in Hirshleifer, Hsu, and Li, 2013)
The primary motivation behind this paper/article was to backtest the strategy based on PTM ratio and perform robustness testing by trying various combinations of the investment universe. The backtest was deployed:
- On the historical financial data for the period January 2005 to May 2022,
- Using the latest patent data covered till May 2022,
- With new inputs in Scenario analysis like change in asset allocation weighting method, change in stock market reaction period around the patent grant date and change in rebalancing period,
- On the data which will provide us an opportunity to cover the new crisis period of the Ukraine Russian war, that adds a worst case scenario for stocks and best case scenario for commodities like Oil and Gas.
Source of data
The analysis was performed on historical patent data scraped from https://companyprofiles.justia.com/companies. Justia is an American website specializing in legal information retrieval. There are 166 tickers mentioned on the website and they are US based most traded liquid stocks. The data is in the form of the count of patents granted to those companies.
Backtest processing and results
We have backtested the strategy on two halves of the past data, i.e. 1st Jan 2005 to 31st Dec 2013 and 1st Jan 2013 to 31st May 2022, and also on the complete period from 2005 till 2022. We have kept the starting cash as $1,00,000. The asset universe used for the backtest consist of the stocks from S&P 500 index that that are covered by Justia.
Brief rules for the calculation of the Patent-to-Market ratio are:
Firstly, estimate the market value (MT) of a firm’s newly granted patents by relying on the stock market reaction around patent granted dates to estimate the market value of patents – market value (MT) of a firm’s newly granted patent is equal to change in market capitalization (in excess of normal market move) during first two days after the patent is granted.
Secondly, recursively compute the firm’s cumulative market value of patents CMPi,t for firm i in year t. The Patent-to-Market (PTM) ratio for firm i at time t is simply equal to the CMP divided by the firm’s market value (MV).
Finally, Jiaping Qiu, Kevin Tseng and Chao Zhang suggest to sort stocks according to their PTM ratios into decile portfolios, long the highest decile and short the lowest decile. The strategy is value-weighted and rebalanced yearly.
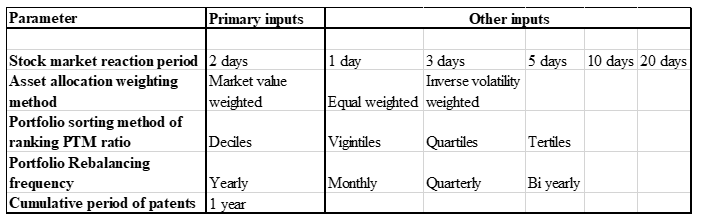
We applied the below method for robustness testing – shuffling our inputs in the whole testing process:
We changed only one of the primary inputs and kept others as intact. Suppose in the below table, when we test by changing the rebalancing frequency from yearly to monthly, we’ll keep the other four primary inputs as constant.
Results
After backtesting the strategy on two independent sets of data (2005-2013, 2013-2022), we found no symmetry in Net profit and Sharpe ratio throughout both the periods. The outcomes were totally opposite for both the periods in majority of the scenarios, which did not lead to any solid conclusion from the backtest.
We proceeded further for performing the tests on the whole period and came up with the below results.
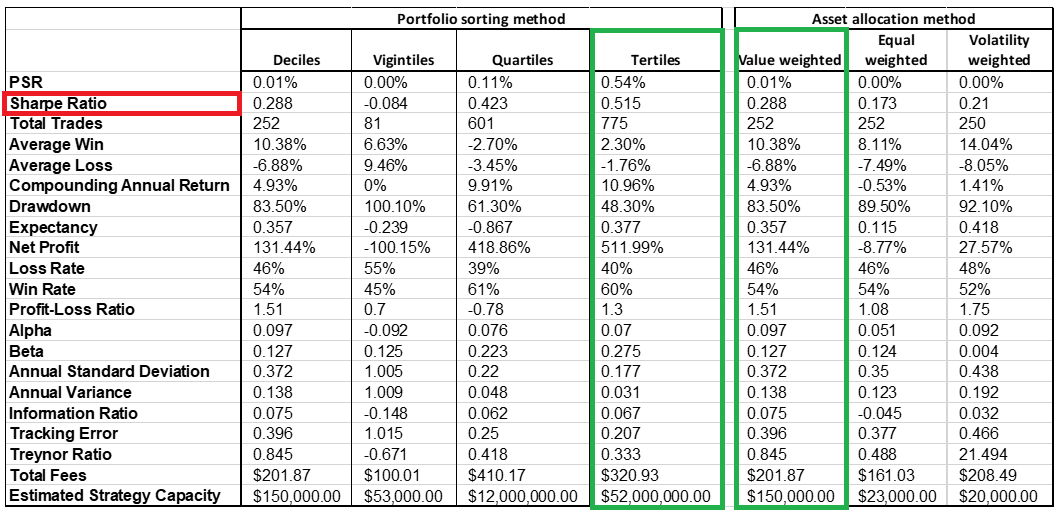
- The below table shows the results when we change only the Portfolio sorting method of ranking PTM ratio and keep the other primary inputs constant as well as when we change only the asset allocation weighting method and keep the other primary inputs constant. Green highlighted versions were the best performing strategies.
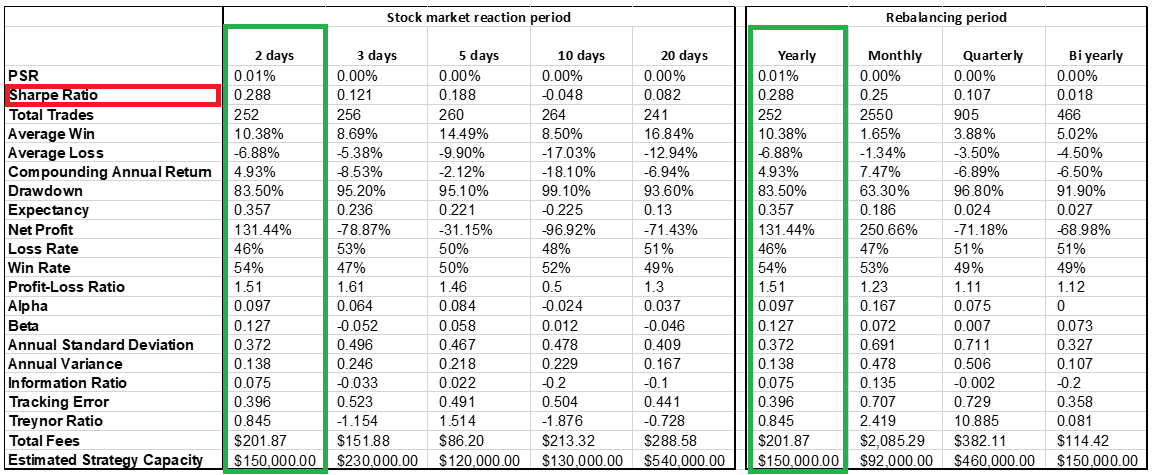
- The below table shows the results when we changed only the stock market reaction period and keep the other primary inputs constant as well as when we change only the frequency of rebalancing the portfolio and keep the other primary inputs constant. Once again, green highlighted versions were the best performing strategies.
Observations:
- The strategy is producing a negative Sharpe ratio, a negative alpha and a negative profit when we diversify the portfolio into 20 groups (vigintiles) and track the stock price 10 days after the patent is awarded. Strategy has better Sharpe ratio if we diversify more and sort portfolio into Terciles/Quartiles instead of Deciles.
- Though the Inverse volatility weighting is giving a low beta and high alpha, its net profit and Sharpe ratio is significantly less than the primary method of market value weighting.
- Changing the reaction period and asset allocation weighting method does not appear to improve the results.
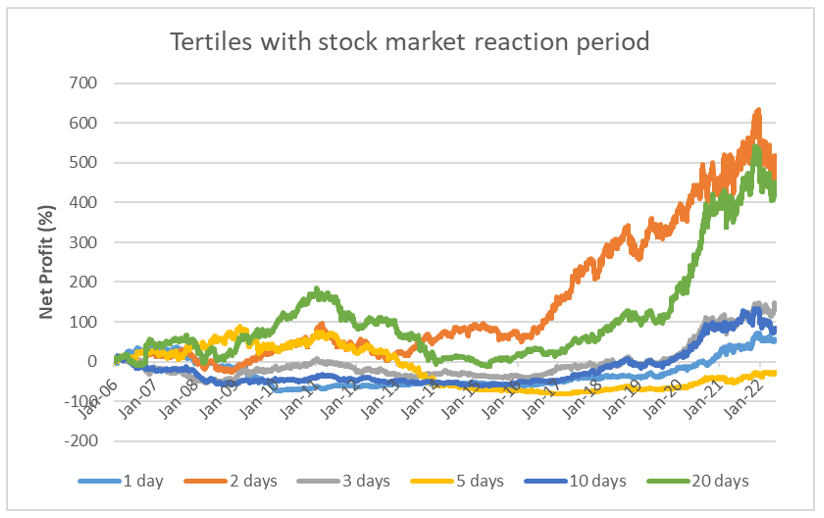
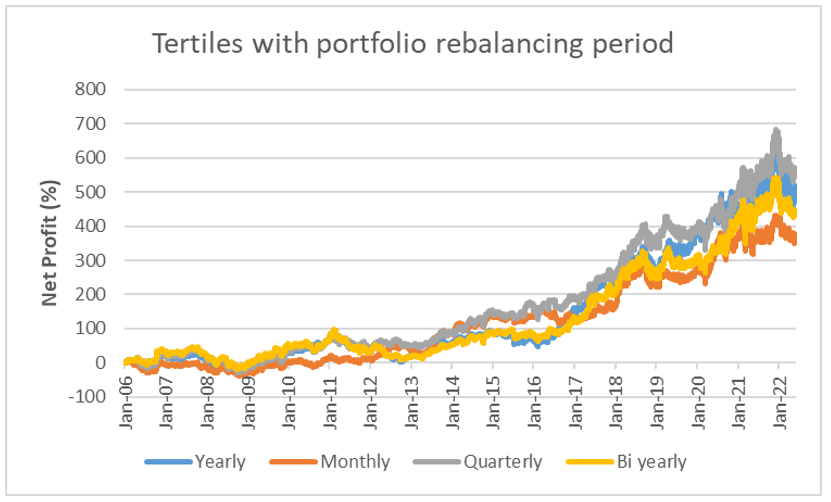
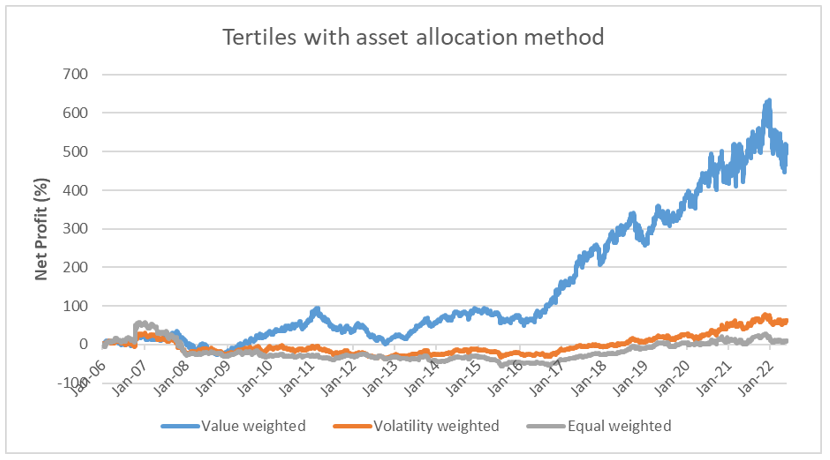
As we mentioned, we noticed a higher net profit and Sharpe ratio when diversifying the portfolio into Tertiles and Quartiles. So we’ll narrowed down our approach and backtested the strategy with keeping the diversification method as Tertiles intact in the primary inputs while modifying others.
Final observations:
- Strategy is extremely dependent on correctly picked “stock market reaction” period. The 2-day period suggested by Jiaping Qiu, Kevin Tseng, and Chao Zhang is the best; other periods (with the exception of 20-days) have significantly worse returns and return-to-risk ratios. This can suggest parameter overfit in the original paper.
- The portfolio rebalancing method doesn’t have a significant impact on the strategy’s performance; we can leave rebalancing on a yearly basis as shorter periods will cost more to the investor in terms of transaction fees.
- The value-weighted strategy has significantly better performance than other weighting methods. It can suggest that stocks with smaller market capitalization negatively contribute to performance when we sort by PTM measure.
Author: Rishabh Gupta
Are you looking for more strategies to read about? Sign up for our newsletter or visit our Blog or Screener.
Do you want to learn more about Quantpedia Premium service? Check how Quantpedia works, our mission and Premium pricing offer.
Do you want to learn more about Quantpedia Pro service? Check its description, watch videos, review reporting capabilities and visit our pricing offer.
Do you want algorithmic access to the full Quantpedia database via the API? Subscribe to Quantpedia Pro, ask for an API key, and explore the in/out-of-sample statistics, source academic papers, and code snippets — ideal for quantitative research, systematic trading workflows, and AI model training.
Are you looking for historical data or backtesting platforms? Check our list of Algo Trading Discounts.
Or follow us on:
Facebook Group, Facebook Page, Twitter, Linkedin, Medium or Youtube
Share onLinkedInTwitterFacebookRefer to a friend


