Pragmatic Asset Allocation (PAA) represents a portfolio construction approach that seeks to balance the benefits of systematic trend-following with the realities faced by semi-active investors (mainly taxes and lack of time to manage positions). Building upon the insights presented in Quantpedia’s initial overview and later in the follow-up, we see clear potential in this framework—especially for long-term investors who are looking for a middle ground between passive indexing and fully dynamic tactical allocation.
Our perspective on PAA emphasizes its practicality, especially when implemented with a quarterly rebalancing frequency. This slower rebalancing schedule helps minimize transaction costs and short-term noise while also contributing to tax efficiency—two factors that are often overlooked in backtests but critically important in real-world portfolio management. We also appreciate the model’s flexibility, allowing investors to integrate both trend and risk-based signals without relying on overly complex heuristics or frequent turnover.
Approximately a month ago, we ran a test and filtered asset allocation strategies from our Screener and looked for those that performed well on a YTD basis. One of those models that fared surprisingly well was the Pragmatic Asset Allocation model, and given the challenging market conditions so far in 2025, with mixed signals across asset classes and increased macroeconomic uncertainty, we believe it is an ideal time to revisit the PAA framework. This analysis may help clarify whether a pragmatic, rules-based approach can still hold its ground—or even outperform—in a year when many models have struggled.
Revisiting PAA model in 2024 – 2025
In this article, we revisit the PAA model using the same approaches and methodology. As in previous instances, we once again begin with a close-up look at the yield curve inversion signal – the base of the model’s structure.
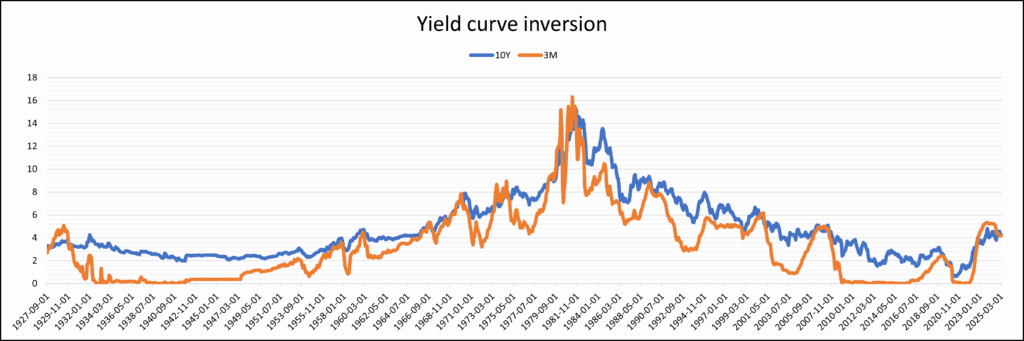
In 2022, we observed that 3-month yields had significantly jumped above the 10-year yield, and we were curious how long this inversion would last. At the time of writing our follow-up article, the duration had reached 19 months — already a remarkably long period. Let’s take a closer look.

The 3-month yield was higher than the 10-year yield for a total of 25 months, making it the longest yield curve inversion in the past 100 years. Although the inversion briefly ended at the end of 2024, the two yields are now at the same level again — signaling that the environment still may not be optimal for equities into the future (and we may enter the recession period soon).

This year, investor confidence in the U.S. market has declined significantly due to political uncertainty surrounding Trump’s economic policy decisions. Stocks have performed poorly across the board, as we can observe in SPY’s performance shown in Figure 3.
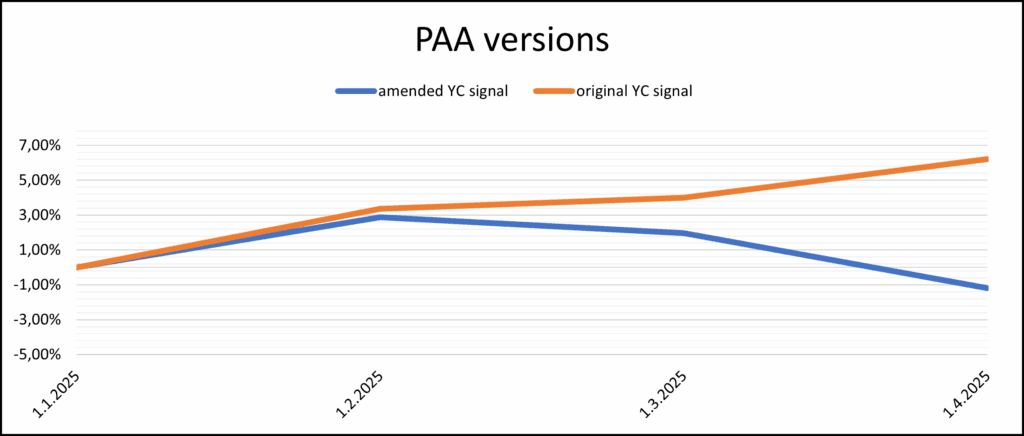
Let’s now take a look at the PAA model’s performance over the past five years. As in our previous article, we will examine both the original version of the PAA model and a modified version with an adjusted yield curve (YC) signal. In this amended version, when the yield curve inverts, the current tranche is switched from risky assets to the hedging portfolio or cash — but the YC signal remains valid for only 12 months.
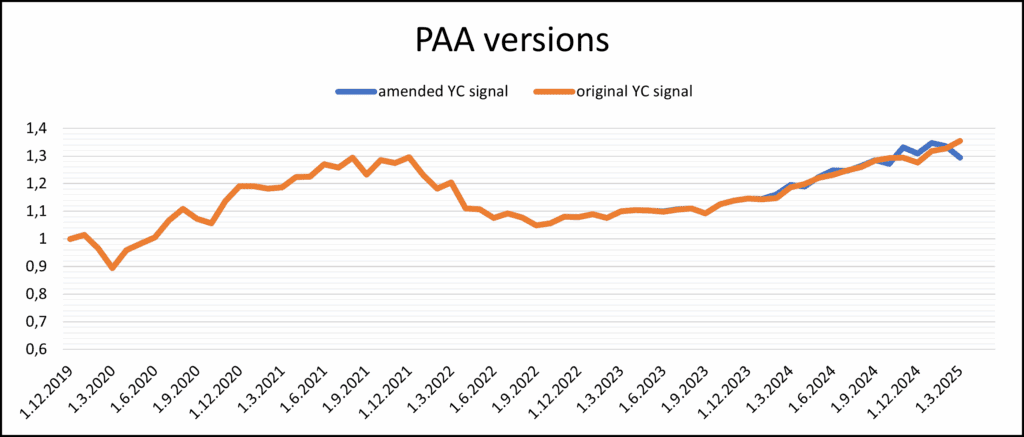
In the long run, there has been no significant difference in performance, particularly up until the end of 2023. Since then, the two versions have been alternating in holding the lead in returns, but sooner or later, they usually converged to a similar outcome. That’s not surprising as the difference in signals is small and we stated several times, that in the long-run, the performance of both versions will be very probably nearly the same.
However, in the short run, there can be differences—the year 2024 was better for equity markets, and 2025 is the year of another asset class: Gold.
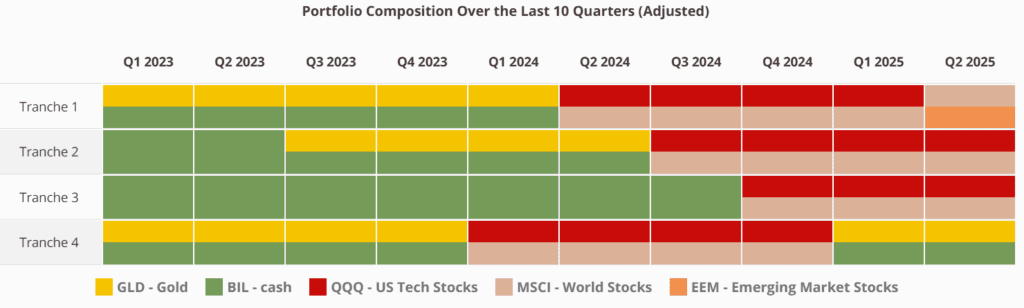
Fortunately, the PAA version using the original YC signal has a lot of Gold in the portfolio. Let’s review the current allocations (as reported in our Pragmatic Asset Allocation report, in Quantpedia’s Portfolio Analysis section). Since the beginning of 2025, it has been growing steadily, remaining largely unaffected by the recent turmoil in the stock market.
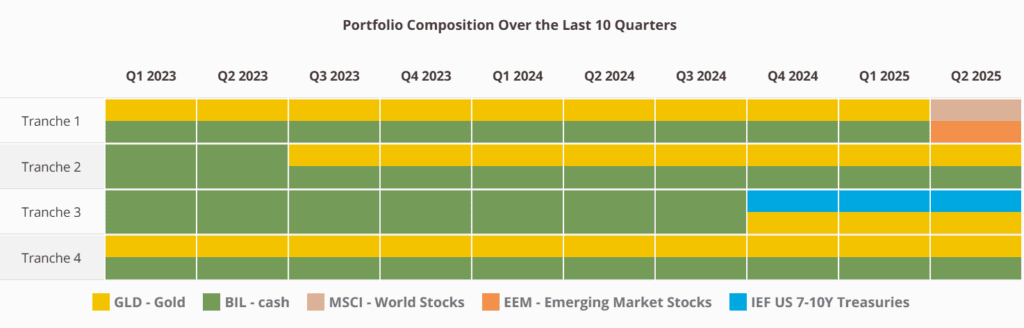
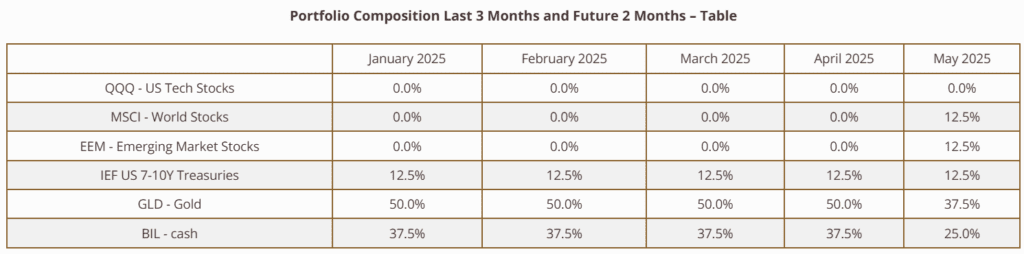
The PAA model was, during the last quarter, roughly half allocated to gold, with a significant portion in cash and the remainder in treasuries. This allocation proved highly favorable in the recent environment, as it avoided exposure to the stock market—resulting in a profitable performance, as shown in Figure 7. In the upcoming quarter, after more than two years, the allocation to gold and cash will be reduced and partially replaced by positions in EEM and MSCI.
On the other hand, the PAA version with the amended YC signal, didn’t have great start in 2025. The equity allocation that greatly boosted profits in 2024 served as a drag on the performance in 2025.
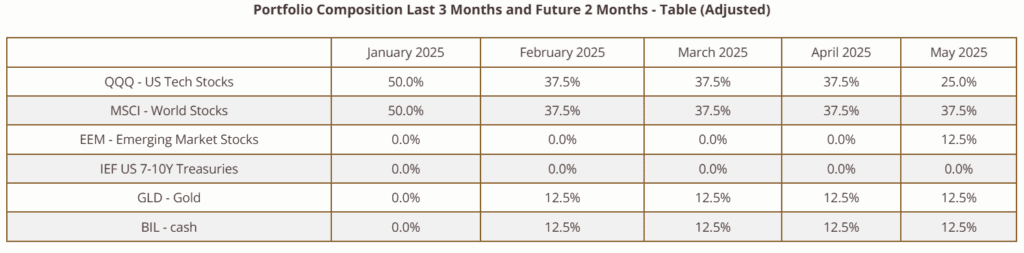
As we can observe, the version with the amended YC signal was allocated mainly into U.S. tech stocks (QQQ) and global equities (MSCI World), both of which were impacted by the recent turbulence in the stock market. For the upcoming quarter, a smaller portion will be allocated to QQQ in favor of EEM. However, due to more diversified portfolio compared to SPY (more non-US stocks, small gold and cash allocation), decline of this version of PAA has been more moderate, and as of the end of March, the return is not as negative as SPY’s.
What is the main takeaway?
We will simply recapitulate what we said a year before – the sound long-term allocation model is more important than short-term variations in the portfolio structure. In the short term, the performance of both PAA versions will slightly differ; in the long term (decades), both versions will probably perform approximately the same. In the next 3-6 months, the model portfolios of both versions will come closer to each other (and the equity curves probably, too). Our goal is for both versions of the model to maintain a healthy distance from the benchmark MSCI performance in the long term.

How will the future look like? We do not know. However, semi-active models like PAA may be a smart choice, as stagflation risks grow. Dynamic allocation allows them to shift from risky assets to safe havens like gold or cash when inflation rises and economic growth slows. Unlike traditional portfolios, PAA adapts to market conditions, helping to reduce drawdowns and protect capital during volatile periods. In a stagflationary environment, this flexibility can make a difference.
Team Quantpedia
Are you looking for more strategies to read about? Sign up for our newsletter or visit our Screener or Blog.
Do you want to learn more about Quantpedia Premium service? Check how Quantpedia works, our mission and Premium pricing offer.
Do you want to learn more about Quantpedia Pro service? Check its description, watch videos, review reporting capabilities and visit our pricing offer.
Are you looking for historical data or backtesting platforms? Check our list of Algo Trading Discounts.
Or follow us on:
Facebook Group, Facebook Page, Twitter, Linkedin, Medium or Youtube
Share onLinkedInTwitterFacebookRefer to a friend


