Revisiting Trend-following and Mean-reversion Strategies in Bitcoin
Over the past few years, significant shifts in the financial landscape have reshaped the dynamics of global markets, including the cryptocurrency sector. Events such as the ongoing war in Ukraine, rising inflation rates, the soft landing scenario in the US economy, and the recent Bitcoin halving have all profoundly impacted market sentiment and price movements. Given these developments, we decided to revisit and reassess trading strategies, specifically Trend-following and Mean-reversion in Bitcoin published in 2022, which utilized data from November 2015 to February 2022. This new study explores how these strategies would have performed from November 2015 to August 2024, taking recent changes into account. The study also examines market changes between February 2022 and August 2024, highlighting developments since previous research. Additionally, it evaluates the influence of seasonality on Bitcoin’s price action, similar to our previous article – The Seasonality of Bitcoin. By analyzing these factors, we aim to provide deeper insights into the evolving behavior of the world’s leading cryptocurrency and guide investors through the complexities of today’s market environment.
In-sample analysis
All analyses are based on the real daily BTC data from the Gemini Data page. This data represents the open prices of the BTC at 0:00 from October 9, 2015, to August 20, 2024, with the first observed day being November 11, 2015. We apply the MIN and MAX strategy to this data. The MAX strategy is founded on trend-following pattern, where an asset with the highest recent value tends to continue growing in the next few days. The MIN strategy is based on the mean-reversion theory, which posits that returns will tend to move back toward an average level over time, even if they are significantly low, they will eventually revert back to that average level.
Similarly to the original article, on every observed day (t) we calculate the maximum (MAX) and the minimum (MIN) price of the BTC over previous 10, 20, 30, 40 and 50 days:
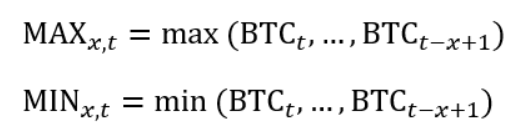
Where BTCt is the price on day t and x is the lookback period.
In the next step, we explore the behavior of the BTC prices when they reach the maximum or minimum over the given period. Unlike the original article, this time we don’t focus on the behavior below the maximum or above the minimum. For calculations, we use the formula:

Where rt,x is the return of the BTC on day t during the x-days period.
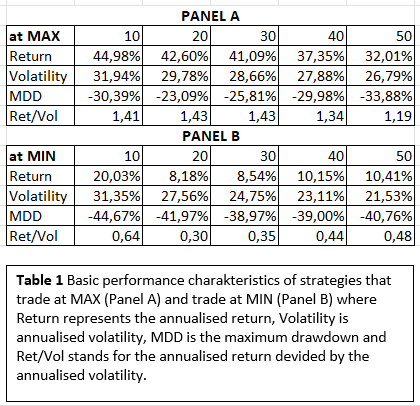
According to Table 1, both strategies remain alive and effective, especially for 10-days periods. For the MAX strategy shown in Panel A, it appears stronger than MIN strategy in Panel B, considering higher returns and lower drawdown, altough both strategies are efficient for trading.
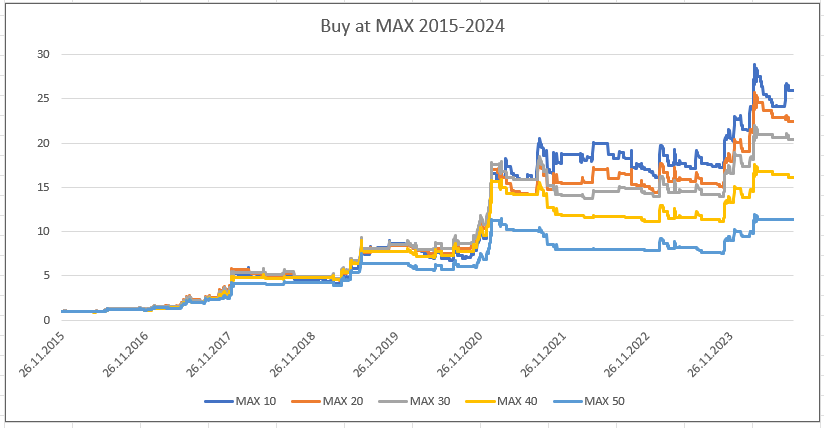

Buying at MIN shows slower growth with more flat segments in the curve compared to buying at MAX, but also results in more severe drawdowns, as confirmed by the values in Table 1.
Overall, the performance of both strategies is slightly less effective compared to the original research. However, they are still relevant and most effective when buying the BTC at the maximum or minimum price over the last 10-days, based on the results of the research.
In the previous study, we achieved the best results with a combination of the MIN and MAX strategies – buying the BTC when it reached both the minimum and maximum within the last 10-days period. Based on this, we decided to recreate the strategy for a longer time period.

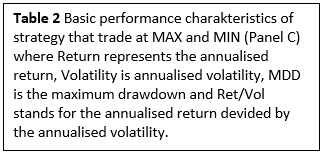

With this approach, we can still achieve high returns (the MIN+MAX strategy is close to its all-time high watermark) with lower drawdowns than just buying and holding the underlying BTC market.
Out-of-sample analysis
Subsequently, we applied these strategies only to days that were not included in the original research, specifically from February 4, 2022, to August 20, 2024. During this period, the price of Bitcoin experienced a profound decline, which makes a perfect stress test for the out-of-sample analysis.
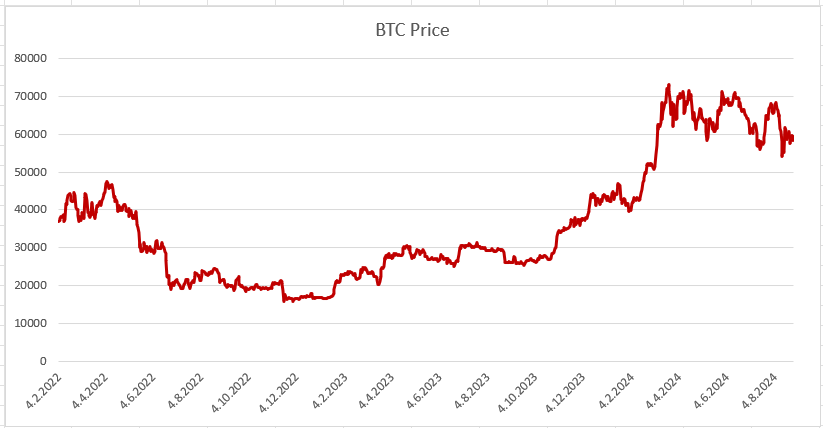
The past two and half years have been challenging for this popular cryptocurrency due to ongoing war in Ukraine, rising inflation rates or the soft landing scenario in the US economy, all of which have had strong impact on financial landscape. Additionally, April 19, 2024, marked the Bitcoin halving, which also affected the price.

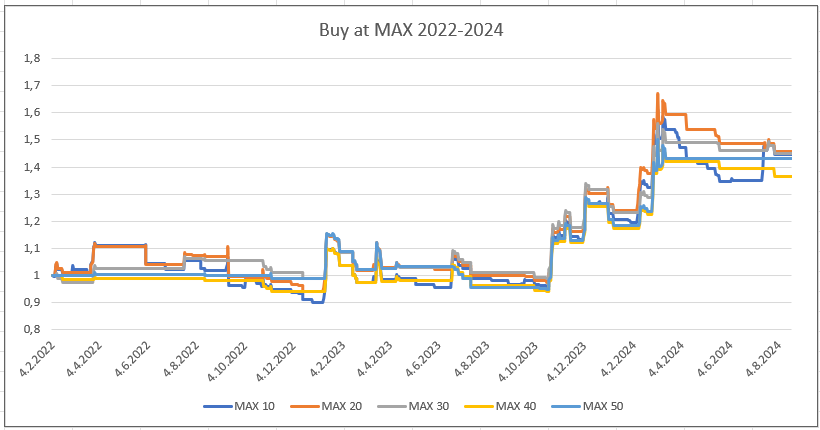

Despite the decline in the BTC price, the MAX strategy remains alive and well. Buying the BTC when it reaches a 10-days maximum appears to be less effective than buying at a 20-days maximum, however, is still worthwhile, as well as all other periods. On the other hand, the second leg of the MIN+MAX strategy – buying at the minimum has not performed well. Over the last 2.5 years, this strategy has suffered due to a decline in the BTC price, yielding low or even negative returns. Will the buying short-term stress at the BTC minimum continue to disappoint in the future? This is a question that’s hard to answer. However, based on the out-of-sample test, we would probably put more faith into the MAX strategy (buying new short-term highs), which retained its effectiveness even during the demanding past 2.5 years.
The seasonality
Since the seasonality effect in the Bitcoin is relevant, as discussed in the article The Seasonality of Bitcoin, we are curious to see if daily seasonality impacts the MIN/MAX strategies. For each day of the week from October 9, 2015, to August 20, 2024, we use modified formulas that include specific days of the week:

Using this method, we initially generated 7 graphs for the MAX strategy and then 7 graphs for the MIN strategy. The graphs in the first row correspond to calculations with time t = Monday, the second row with time t = Tuesday, and so on.
The seasonality in MAX strategy
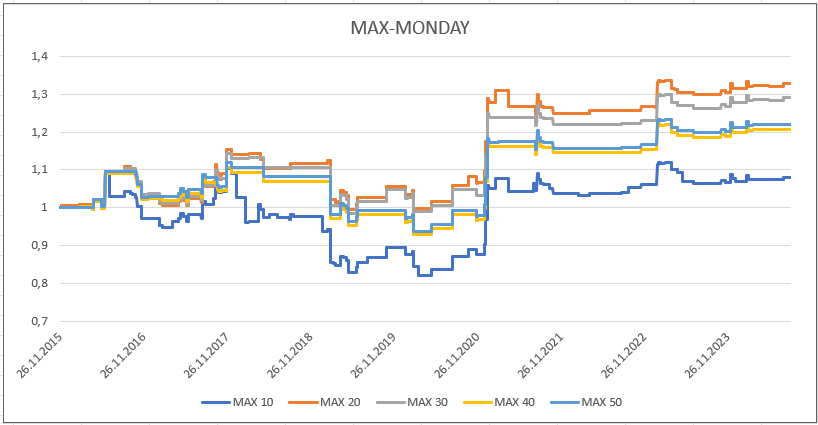


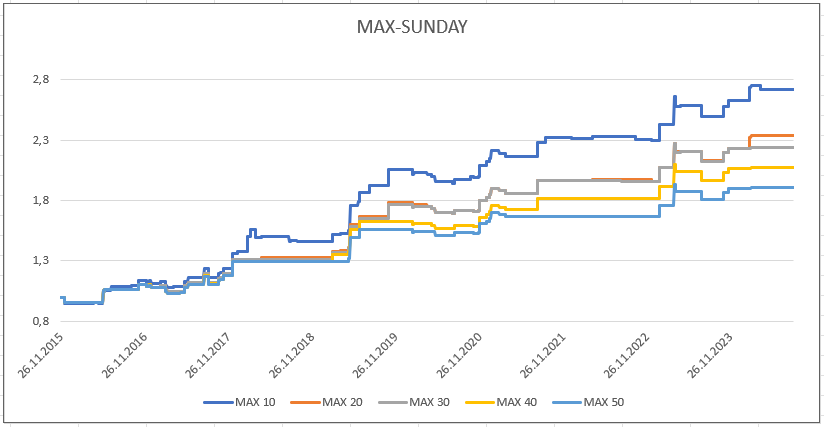
Based on the graphs above, we can claim that the strongest days for holding the BTC when it reaches the maximum are Wednesday and Sunday, where, once again, the 10-day maximum is showing the best results. We initially hypothesized the presence of a weekend effect, where Friday, Saturday, Sunday, and Monday would exhibit better performance. While the increasing curve for t = Sunday indicates the presence of this effect, other weekend days do not support this hypothesis. Additionally, the rising curve for Wednesday does not relate to the weekend effect at all, suggesting that the strong performance on these two days (Wednesday & Sunday) may be just coincidental. Therefore, our study seasonality study for the MAX effect/strategy is inconclusive.
The seasonality in the MIN strategy

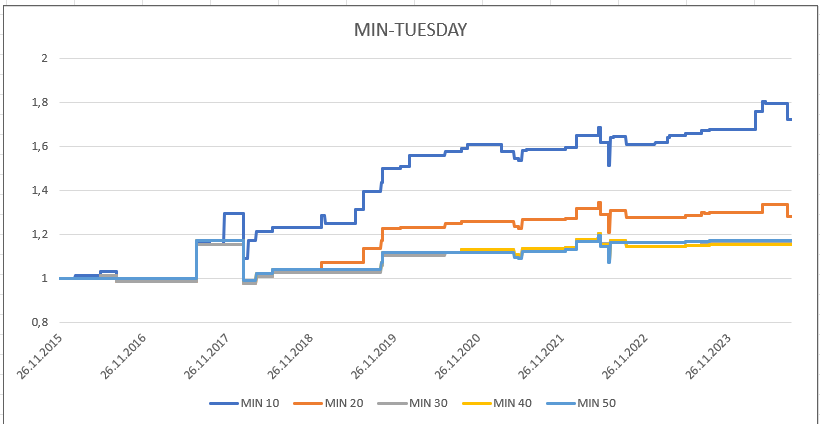

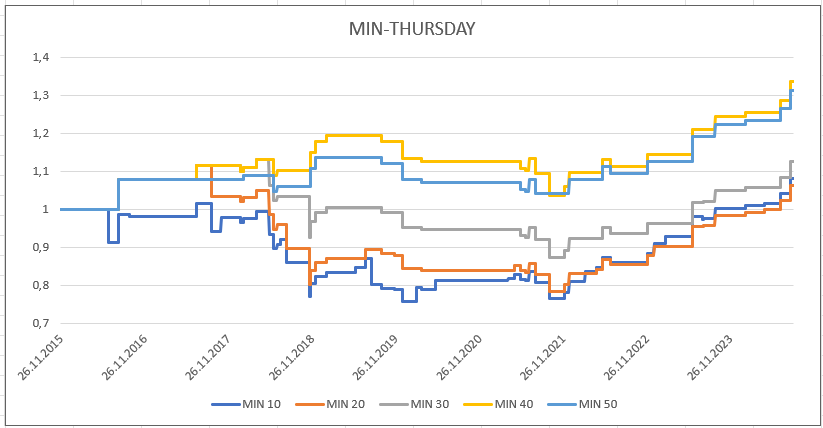


Buying the BTC at the minimum price is the most profitable on Tuesday and Saturday, with the best results once again shown for the 10-days minimum. We are of the opinion that seasonality effect is not present, even in the MIN strategy. Moreover, the highly performing days are not consecutive, so this occurrence is probably just a random coincidence as well.
Conclusion
Despite some higher-performing days, our research did not find any significant daily seasonality effect in the MIN/MAX strategies for the Bitcoin. The out-of-sample returns show that the MIN strategy is not performing as well as it did in the in-sample analysis. However, the MAX strategy remains very effective. If we hypothesize that cryptocurrencies will grow in long run, it would be reasonable to consider applying a trend-following rule to the BTC. According to the results of this research, it is possible to achieve the bulk of the BTC performance without experiencing severe drawdowns. Whether using a 10, 20, 30, 40 or 50-days maximum, the MAX strategy appears to be good choice for the systematic trading strategy.
Author: Sona Beluska, Junior Quant Analyst, Quantpedia
Are you looking for more strategies to read about? Sign up for our newsletter or visit our Blog or Screener.
Do you want to learn more about Quantpedia Premium service? Check how Quantpedia works, our mission and Premium pricing offer.
Do you want to learn more about Quantpedia Pro service? Check its description, watch videos, review reporting capabilities and visit our pricing offer.
Are you looking for historical data or backtesting platforms? Check our list of Algo Trading Discounts.
Would you like free access to our services? Then, open an account with Lightspeed and enjoy one year of Quantpedia Premium at no cost.
Or follow us on:
Facebook Group, Facebook Page, Twitter, Linkedin, Medium or Youtube
Share onLinkedInTwitterFacebookRefer to a friend


