Trend-following and Mean-reversion in Bitcoin
The following article again offers a short glimpse into the world of cryptocurrencies. For more similar articles, check our cryptocurrency trading research subpage.
Trend-following and Mean-reversion in Various Asset Classes
Indisputably, trend-following and mean-reversion are two key concepts in quantitative investing or technical analysis. The trend-following proponents suggest a performance continuation and that assets that have performed well will continue to do so. In other words, the trend-following strategies are characterized primarily as buying high and selling even higher. Conversely, the mean-reversion theory suggests that assets tend to revert to their long-term mean after all. Therefore, the mean reversion strategies are commonly described as buy low and sell high. Naturally, both approaches can also have short legs: short losers for trend-following and short winners for mean-reversion.
At first sight, the coexistence of these two effects might be confusing. One might think that either there is a continuation or reversion. However, the devil is in the details. For example, in the stocks, the past one month’s return is not connected with continuation (past winners will outperform and losers will underperform), but rather with mean reversion. This effect is commonly known as the short-term reversal. If we move a few months back, the trend-following idea becomes dominant. The effect is most widely recognized as the twelve months stock momentum. The continuation tends to disappear if we move even further back (e.g., in stocks or commodities). There is also a long-term reversal effect that suggests that past losers would outperform and vice versa for winners. Still, it is crucial to bear in mind that the trending or reverting might not be connected only with a specific time frame but also with specific situations such as liquidity provision during crises, buying the dips, short-squeezes, earnings announcements, and many more. Moreover, there are numerous ways to identify over/undervalued securities – some prefer to use the return-based metrics (e.g., momentum), others prefer moving averages, distances to x-weeks highs (lows), or even their combination.
Trend-following and Mean-reversion in Bitcoin
What about the Bitcoin? Are there trend-following or mean-reversion patterns? Or are both effects present and co-exist? In this short research, we examine how Bitcoin’s price is affected by its maximal or minimal price over the previous 10 to 50 days. Consistent with the popularity of these price-based strategies, several variants of these strategies are already well-documented. Rohrbach et al. (2017) examined exponential moving averages in fiat and cryptocurrencies. Hubrich (2017) examined the time-series momentum factor in cryptocurrencies. Detzel et al. (2020) provided Bitcoin-centered results, which used several simple moving averages to form the trading strategy. Cong et al. (2021) examined several cryptocurrency factors, and among them also the momentum factor, which seems to be present cross-sectionally in the largest cryptos, and reversal which tend to be present in the smallest cryptos. While our research is related to the existing literature, we are not aware of any analysis that examines Bitcoin’s behavior connected with nearness to maximal/minimal price of the previous days.
Main analysis
The data includes Bitcoin prices from the Gemini exchange, and the sample spans from 26.11.2015 to 3.2.2022. Since Bitcoin is traded continuously, the sample also includes weekends or holidays.
The first step consists of the calculation of the MAX or MIN at day t over the previous 10, 20, 30, 40 and 50 days:
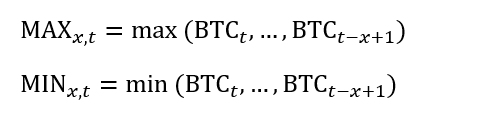
Where BTCt is the price at day t and x is the lookback period.
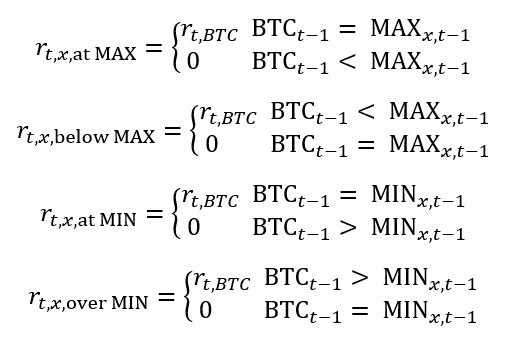
Subsequently, we can examine how does the Bitcoin behave when it is at its maximum, below its maximum, over its minimum or right at the minimum. The corresponding strategies can be formulated as follows:

Based on Table 1, there are two striking observations. First, Bitcoin seems to be the riskiest when it is below the maximum or over the minimum. It is easy to argue that the strategies that follow these two events are more frequently invested, but the pattern also holds for maximum drawdowns.
For the MAX, the Bitcoin returns are better after at MAX days, and the strategy has higher returns and lower risk compared to a strategy that buys BTC below the MAX. The observation suggests that there is a strong momentum after local x-days maximums.
For the MIN, the Bitcoin returns are more substantial when the Bitcoin price is over the local x-days minima, but the strategies are hazardous with drawdowns over 80%. On the contrary, strategies that buy BTC at the minimum are less profitable and significantly less risky. Therefore, we believe there might be a mean-reversion effect in the BTC.
For both at MAX and at MIN strategies, the shorter the lookback period is a better option, which is in line with the widely recognized dynamic behavior of the BTC. Both strategies have lower drawdowns or volatilities than the BTC (annualized volatility: 74.35% and MDD: -83.65%), but there might be a catch. The BTC trading at the MAX is a clear trend-following strategy that bets on the continuation of the good performance, and the risk lies in the negative return the following day. Betting on the mean-reversion at the bottom (at MIN) seems to be profitable and not that risky, but it is necessary to consider that BTC appears to be in favor of investors. Even though the BTC has already had several crushing drawdowns, it has always bounced back. However, there is no guarantee that when the music stops the next time, it will play it again. For now, the data suggests that the BTC tends to revert to the mean, but a black swan event can be truly costly. Therefore, money and risk management might be necessary for such a strategy.
We further examine the strategies by plotting their equity curves.

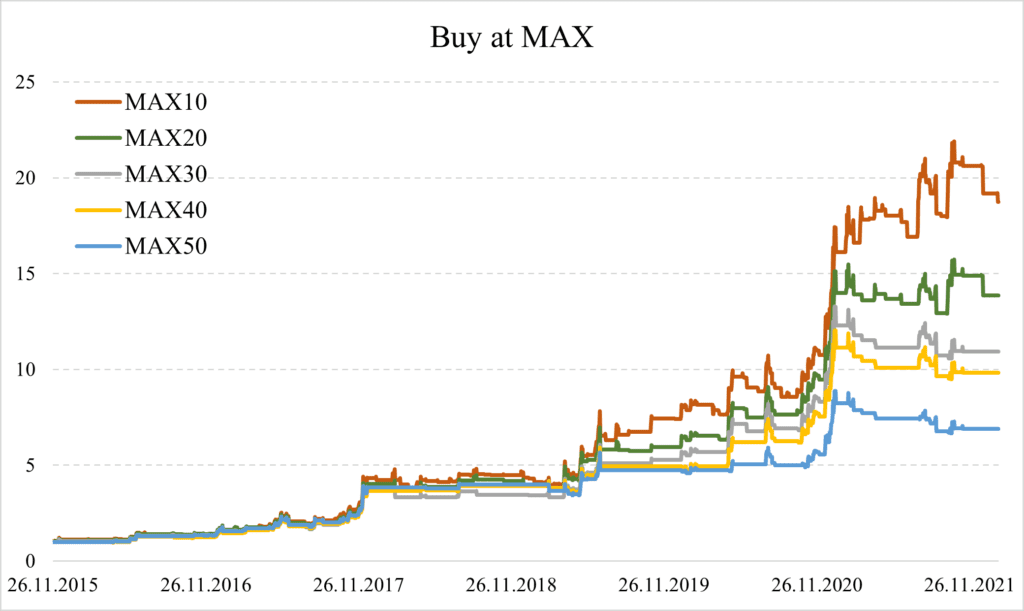
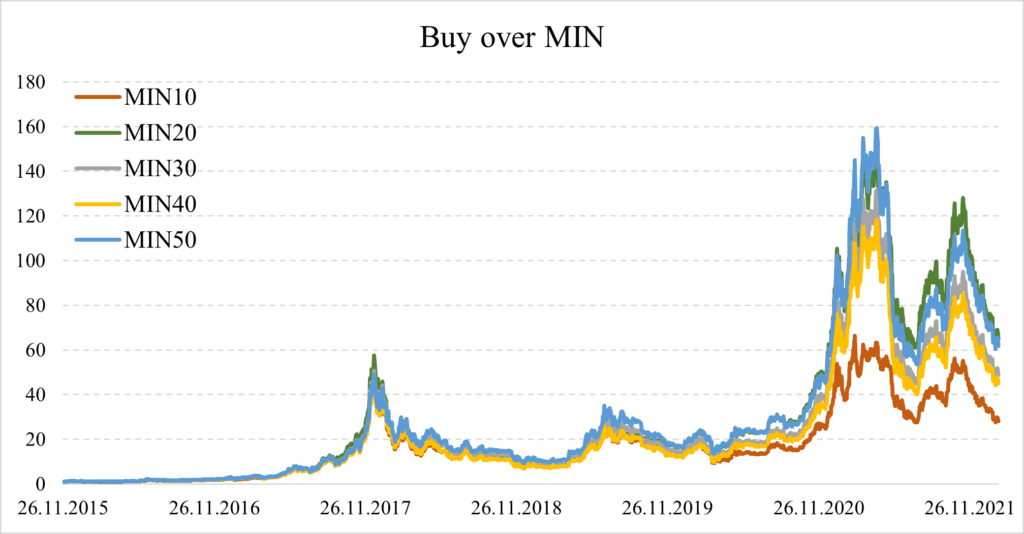
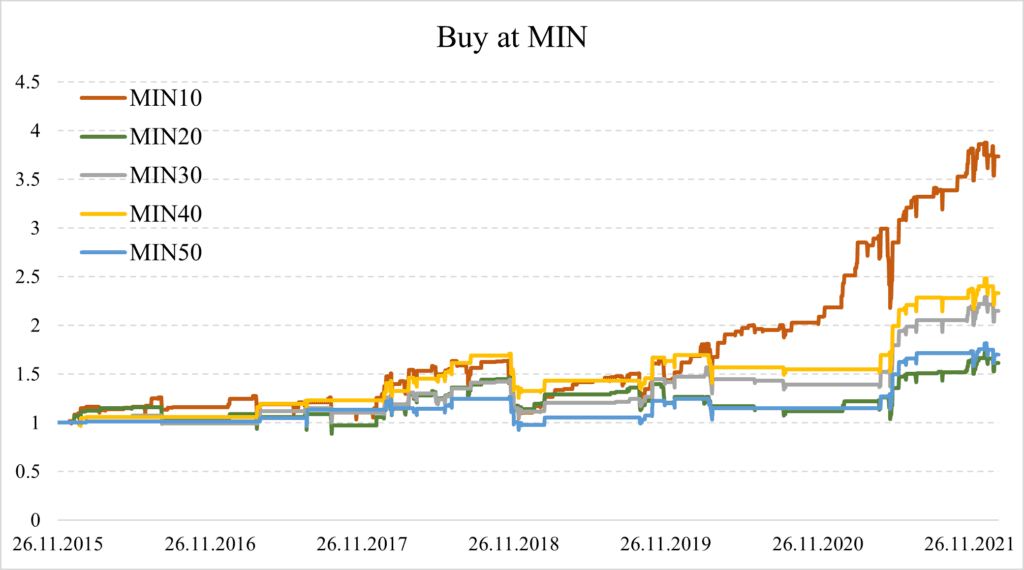
Buying BTC at the bottom or top (defined by the MAX or MIN) leads to more appeasing equity curves. Although the strategies are frequently flat, the data support the hypothesis that the Bitcoin trends at the max and bounce back at the min.
Furthermore, since both strategies are mutually exclusive – you cannot be at the MIN and MAX simultaneously, it opens an obvious possibility to combine these two strategies. For that reason, we examine the combined strategy that buys the BTC if we are at the max or at the min and stays flat otherwise.
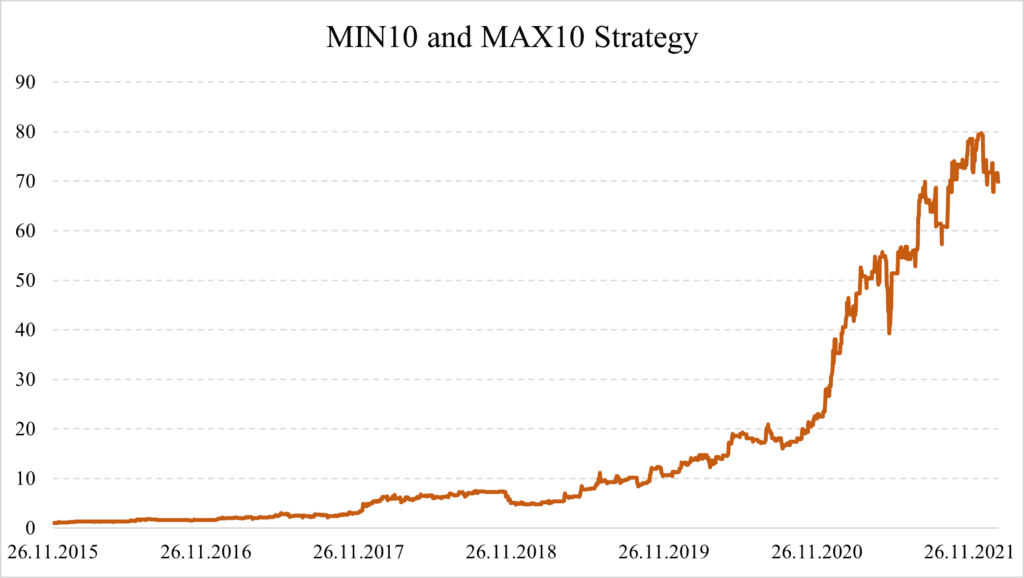
So far, the strategy would have been excellent with an annualized return of 98.43%, 47.75% volatility, -37.67% MDD, and Ret/Vol 2.06.
Short conclusion
The trend-following and mean-reversion strategies are some of the most popular in quantitative finance. Additionally, they have been found quite effective across perhaps every asset class. Bitcoin and other cryptos are no exception. Several variations of trend-following strategies such as moving averages, time-series, cross-sectional momentum, and mean-reversion strategies such as reversal were identified in cryptos.
In our short study, we examined Bitcoin as the premier cryptocurrency. The main idea was to investigate whether there are trends and reversals. Or in other words, whether the trend-following and mean-reversion principles are effective while trading BTC.
Our finding shows that when the BTC is at the local maxima, it tends to continue trending upwards. Furthermore, the local minima are also connected with abnormal price action. As a result, the BTC tends to mean-revert and bounce back. In line with other literature, shorter lookback periods work better, and we have found that after exploring 10-, 20-, 30-, 40- and 50-days periods, the shortest tend to work the best.
The final finding is that since buying BTC at the local minima and maxima are mutually exclusive; these two strategies can be combined to exploit both effects. So far, building on the trending and back-bouncing behavior of the BTC would equate to the return to the volatility ratio over 2.
Authors:
Matúš Padyšák, Senior Quant Analyst, Quantpedia.com
Radovan Vojtko, CEO & Head of Research, Quantpedia.com
Are you looking for more strategies to read about? Sign up for our newsletter or visit our Blog or Screener.
Do you want to learn more about Quantpedia Premium service? Check how Quantpedia works, our mission and Premium pricing offer.
Do you want to learn more about Quantpedia Pro service? Check its description, watch videos, review reporting capabilities and visit our pricing offer.
Are you looking for historical data or backtesting platforms? Check our list of Algo Trading Discounts.
Or follow us on:
Facebook Group, Facebook Page, Twitter, Linkedin, Medium or Youtube
Related Literature
Barr Rosenberg, Kenneth Reid and Ronald Lanstein: Persuasive evidence of market inefficiency. The Journal of Portfolio Management Apr 1985, 11 (3), 9-16; DOI: 10.3905/jpm.1985.409007
Cong, Lin and Karolyi, George Andrew and Tang, Ke and Zhao, Weiyi, Value Premium, Network Adoption, and Factor Pricing of Crypto Assets (December 2021). Available at SSRN: https://ssrn.com/abstract=3985631 or http://dx.doi.org/10.2139/ssrn.3985631
Detzel, Andrew L. and Liu, Hong and Strauss, Jack and Zhou, Guofu and Zhu, Yingzi, Learning and Predictability via Technical Analysis: Evidence from Bitcoin and Stocks with Hard-to-Value Fundamentals (January 29, 2020). Available at SSRN: https://ssrn.com/abstract=3115846 or http://dx.doi.org/10.2139/ssrn.3115846
Hubrich, Stefan, ‘Know When to Hodl’ Em, Know When to Fodl’ Em’: An Investigation of Factor Based Investing in the Cryptocurrency Space (October 28, 2017). Available at SSRN: https://ssrn.com/abstract=3055498 or http://dx.doi.org/10.2139/ssrn.3055498
Jegadeesh, Narasimhan, and Sheridan Titman. “Returns to Buying Winners and Selling Losers: Implications for Stock Market Efficiency.” The Journal of Finance 48, no. 1 (1993): 65–91. https://doi.org/10.2307/2328882.
Rohrbach, Janick and Suremann, Silvan and Osterrieder, Joerg, Momentum and Trend Following Trading Strategies for Currencies Revisited – Combining Academia and Industry (June 6, 2017). Available at SSRN: https://ssrn.com/abstract=2949379 or http://dx.doi.org/10.2139/ssrn.2949379
Werner F. M. De Bondt, and Richard Thaler. “Does the Stock Market Overreact?” The Journal of Finance 40, no. 3 (1985): 793–805. https://doi.org/10.2307/2327804.
Share onLinkedInTwitterFacebookRefer to a friend


