Systematic Allocation in International Equity Regimes
This research examines the critical quantitative investment problem of systematic tactical allocation to international equity mandates—specifically Emerging Markets (EM) and Europe, Australasia, and the Far East (EAFE)—amidst conjectured macroeconomic regime transitions. The investigation is precipitated by observable deteriorations in USD hegemony, elevated geopolitical risk premiums, and protracted macroeconomic uncertainty. These factors collectively challenge the post-Global Financial Crisis paradigm of consistent US equity outperformance, suggesting a potential inflection point in relative returns and currency-adjusted Sharpe ratios.
The central research question is whether a statistically robust, signals-based framework can be engineered to systematically time exposure to EAFE equities, thereby capitalizing on these postulated regime shifts. We move beyond traditional, static mean-variance optimization by developing a dynamic model that integrates momentum variables to generate actionable, out-of-sample allocation signals.
Introduction
The empirical core of this study constitutes a significant extension and enhancement of our prior analysis
We formulate and test the hypothesis that the conditional excess return of the US equity market over ex-US developed markets is a predictable function of lagged momentum and trend-regime states. This predictability is posited to stem from persistent, regime-dependent capital flows and slow diffusion of macroeconomic information across global markets, rather than static sectoral tilts.
By extending the data universe to 1969—rather than the more common post-1994 sample constrained by MSCI EM Index availability—we capture multiple complete USD cycles, periods of commodity-driven inflation, and earlier episodes of de-globalization. This elongated sample permits a more powerful analysis of structural breaks and regime-dependent factor efficacy. The extended dataset shall furthermore provide a fundamental basis for decomposing excess returns into currency contributions and multiple economic-cycle expansions/contractions, offering a more nuanced diagnostic of performance drivers across epochs.
The ultimate output is a disciplined, rules-based overlay strategy designed to create switch decisions between U.S. and EAFE equities based on quantified momentum variables, with the objective of generating positive alpha and improved portfolio efficiency under evolving macroeconomic conditions.
Literature Review: Empirical Foundations of International Equity and Currency Regimes
The investigation is situated within three principal strands of academic literature, which provide the theoretical and empirical substrate for our analysis:
- The Equity-Currency Nexus and the Dollar Risk Factor: Our work is grounded in foundational research on the intertemporal relationship between exchange rates and equity returns. Key studies, such as those by Brusa, F., Ramadorai, T., & Verdelhan, A. (2014), formally identify the USD as a pervasive risk factor in cross-border investing. They demonstrate that a long-USD, short-foreign-currency position explains a significant portion of the returns for global equity portfolios, providing a mechanistic link between currency appreciations and US equity outperformance. Our research indirectly extends this by mimicking the time-varying potency of this factor and its potential attenuation during hypothesized USD-weakening regimes.
- International Diversification Benefits and the Erosion of the “US Exceptionalism” Anomaly: A long-run historical perspective on global equity returns, exemplified by Dimson, E., Marsh, P., & Staunton, M. (2021) in the Credit Suisse Global Investment Returns Yearbook, provides essential context. Their century-long data series reveals that leadership between the US and ex-US markets is episodic and mean-reverting over very long horizons. Furthermore, seminal papers like Goetzmann, W. N., Li, L., & Rouwenhorst, K. G. (2001), which reconstruct historical EM data, underscore the potential for spectacular—albeit volatile—returns in emerging markets during catch-up phases. Our extended dataset from 1969 operationalizes these insights, allowing us to test whether the conditions for such a leadership rotation are presently converging.
- Macroeconomic Regimes and Asset Allocation: The third pillar draws from literature on regime-switching models and their application to tactical asset allocation. Research by Ang, A., & Timmermann, A. G. (2011) on the importance of capturing different market states informs our methodological choice to explicitly consider USD and volatility regimes. We synthesize this with the empirical findings on the predictive power of valuation spreads (e.g., Campbell, J. Y., & Shiller, R. J. (1988), cyclically adjusted price-earnings ratios applied internationally).
Data: Sources, Instruments, and Sample Period Rationale
The empirical analysis employs a long-horizon dataset constructed to capture multiple secular macroeconomic and currency regimes. Equity return series for the US and developed ex-US markets are proxied by the total return indices of the SPDR S&P 500 ETF Trust (SPY) and the iShares MSCI EAFE ETF (EFA), respectively.
While these ETF proxies provide a tractable basis for modeling implementable strategies, their return histories are synthetically extended and backfilled using the foundational long-term return data from the Quantpedia 100-Year Extended Portfolio Database. This database provides meticulously constructed total-return series for (across other asset classes) US and international equities, derived from primary sources via our own methodology.
The core sample period runs from 31 December 1969 through 31 December 2025. This inception date is strategically chosen to precede the collapse of the Bretton Woods system (1971), thereby encompassing the subsequent free-float USD regimes, the inflationary shocks of the 1970s, the USD super-cycle of the 1980s, the period of the “Great Moderation,” the Global Financial Crisis, and the recent era of quantitative easing and nascent deglobalization. This 56-year sample provides sufficient statistical power to analyze regime-dependent asset behavior, with approximately 672 monthly observations. The explicit exclusion of pre-1970 data focuses the study on the modern era of fiat currencies and integrated capital markets, while the elongation through 2025 incorporates the recent period of heightened geopolitical tension and monetary policy normalization.
A critical data limitation concerns Emerging Markets (EM). A coherent, investable EM proxy did not exist prior to the launch of standardized indices in the late 1990s. Constructing a synthetic EM portfolio ex-post would introduce significant selection and survivorship bias. Consequently, and for methodological purity, this study focuses on the EAFE-SPY spread as the primary testing vehicle. The EAFE universe provides a cleaner, historically consistent representation of developed ex-US equity performance, allowing for an unambiguous test of USD-regime and momentum effects without the confounding structural break of EM index inception.
Methodology: Systematic Spread Construction and Condition-Regime Hypothesis Testing
Spread Construction and Empirical Behavior
The foundational analytical construct is a dollar-neutral spread between the EAFE and US equity markets. Formally, we define a fully collateralized spread position S at time t as the difference between the total return of asset EFA and that of SPY over a specified period. The cumulative performance of this static spread (Figure 1) exhibits distinct regime characteristics: high volatility and mean-reversion in the 1970s-1980s, followed by a pronounced, persistent negative drift from the mid-1990s onward, consistent with the era of US technological dominance and dollar strength. This visual evidence supports the formal hypothesis that the spread is trending and may be forecasted using regime-sensitive technical and macroeconomic signals.

Figure 1: Cumulative Performance of EFA-SPY spread (1970-2025).
Hypothesis Generation and Systematic Trading Rules
We postulate one simple hypothesis for generating alpha from the dynamic EFA-SPY relationship:
H: Spread Momentum (Time-Series): The relative performance spread S exhibits persistent intermediate-term trends that can be captured with time-series momentum signals.
To test this hypothesis, we, for this moment, engineer the following discrete systematic strategy:
Empirical Results: Regime-Dependent Performance of Systematic Spread Strategies
Spread Momentum Strategy (Strategy A)
The performance of the pure momentum strategy on the EFA-SPY spread, as defined by the rule:
is evaluated across lookback windows X ∈ {6, 12, 24, 36} months.
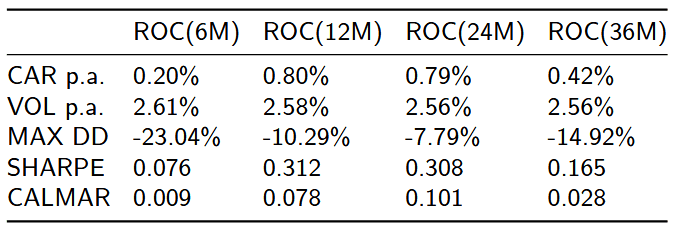
Now, let us first just evaluate legs of the strategy for sub-rules; a) only long EFA and simultaneously short SPY if and only if the momentum variable (ROC, in this case) is positive:
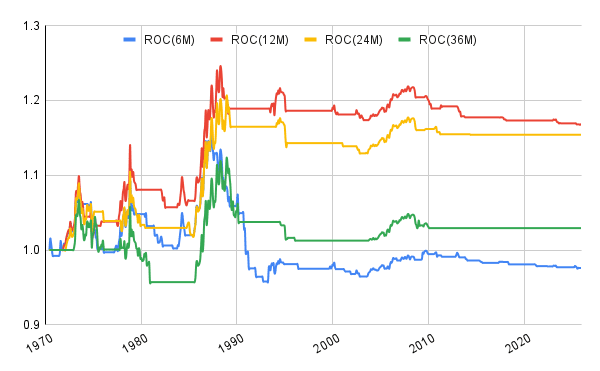
Figure 2: Visual representation in the form of equity curves of +S performance with positive momentum rule only, for all four lookback windows
Descriptive Statistics (Sample: 1970-2025). Presents annualized mean return, volatility, maximum drawdown, and Sharpe and Calmar ratios.
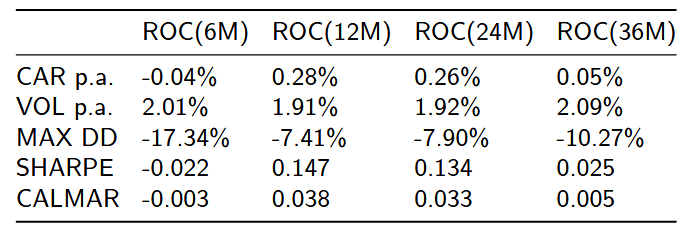
Table 1: Standard performance and risk metrics reported for the strategy performed, depicted in Figure 2
And following, we take a closer look at the performance of the other sub-rule; b) shorting the spread -S with an inverted rule; so, we fulfill it as long as the momentum is negative:
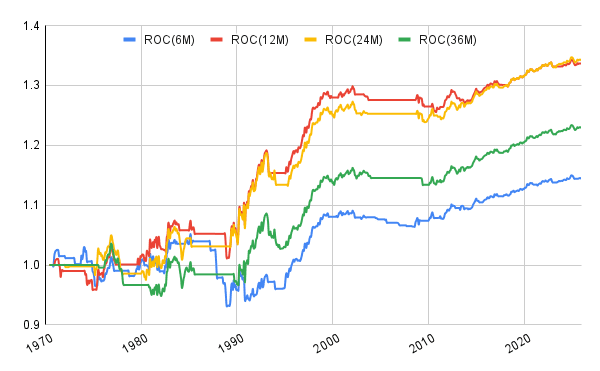
Figure 3: Visual representation in the form of equity curves of –S performance with the negative momentum rule only, for all four lookback windows

Table 2: Standard performance and risk metrics reported for the strategy performed, depicted in Figure 2
And, this is the performance of both sub-rules, a) and b), in one convoluted strategy, as introduced at the beginning of this sub-chapter:
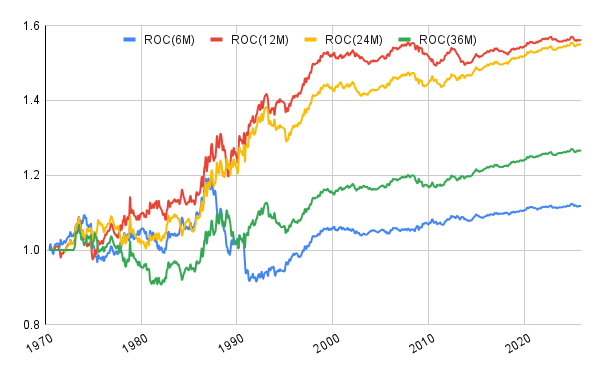
Figure 4: Cumulative equity curves for Strategy A across momentum windows (6, 12, 24, 36 months), 1970-2025.
The performance of the alternative conditional strategy is governed by a simple moving average (SMA) as follows:
where is evaluated for X ∈ {3, 6, 12, 24, 36} months.
Now, for the first rule, long (buying) spread performance in the case of the actual (monthly) price of the spread is at least the same (larger or equal) as the simple moving average of an arbitrarily chosen lookback window.

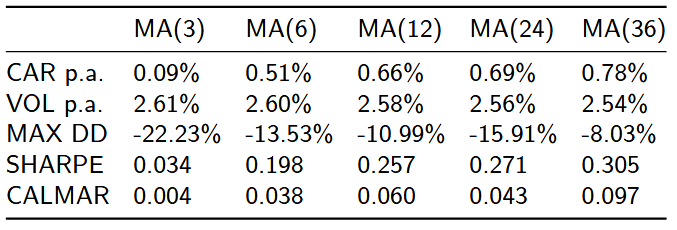
Figure 5: Visual representation in the form of equity curves of +S performance with positive alternate momentum rule only, for all five lookback windows
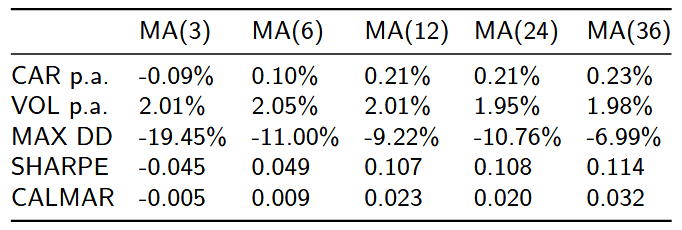
Table 4: Standard performance and risk metrics reported for the strategy performed, depicted in Figure 5
Following, we use shorting the spread -S when the current month’s value is under the simple moving average of a defined lookback period:
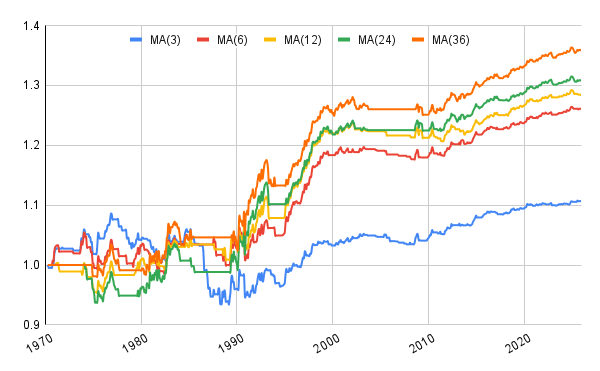
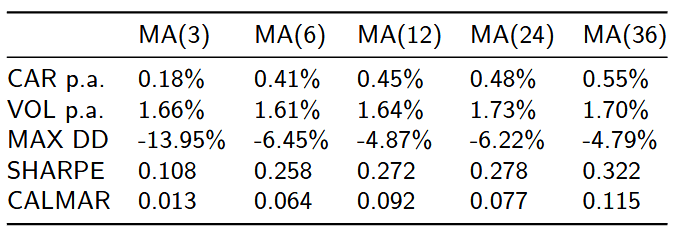
Table 5: Standard performance and risk metrics reported for the strategy performed, depicted in Figure 6
Same as in the last case, for the alternate strategy, we also couple both standalone legs to always decide on one outcome, and get a complete view of how the spread collectively performs with a simple moving average under both classifications:
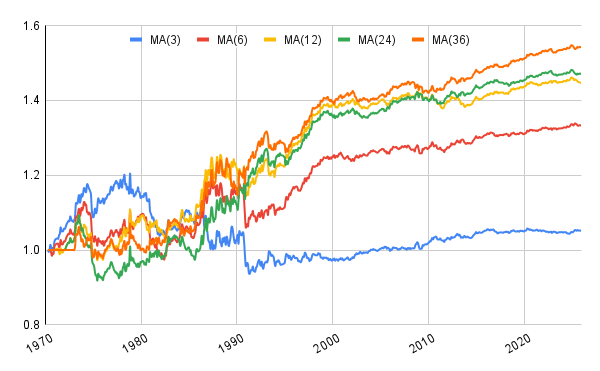
Figure 7: Cumulative equity curves for Strategy B across SMA windows (3, 6, 12, 24, 36 months), 1970-2025.
Author: Cyril Dujava, Quant Analyst, Quantpedia
Are you looking for more strategies to read about? Sign up for our newsletter or visit our Blog or Screener.
Do you want to learn more about Quantpedia Premium service? Check how Quantpedia works, our mission and Premium pricing offer.
Do you want to learn more about Quantpedia Pro service? Check its description, watch videos, review reporting capabilities and visit our pricing offer.
Are you looking for historical data or backtesting platforms? Check our list of Algo Trading Discounts.
Or follow us on:
Facebook Group, Facebook Page, Twitter, Linkedin, Medium or Youtube
Share onLinkedInTwitterFacebookRefer to a friend


