Why Do US Stocks Outperform EM and EAFE Regions?
Introduction
Investing in emerging markets (EM) or developed markets (DM) outside of the United States tends to follow cyclical trends. At times, it becomes popular and crowded to focus solely on U.S. stocks, while in other periods, the trend shifts to favor everything except U.S. equities. This inclination often relies on historical and past performance data, although it doesn’t guarantee identical outcomes in the future. Nevertheless, people use these historical patterns as a guide to anticipate favorable results. For example, between 2004 and 2007, Chinese equities experienced a significant boom, and the resurgence of U.S. outperformance became evident after 2015, continuing until the outbreak of Covid-19 in 2020. Afterward, the market experienced a heavy outperformance of tech stocks, similar to during the tech bubble of the millennium when there was a heavy investment focus on Nasdaq.
But what drives these periods of popularity? When do U.S. markets outperform Emerging Markets or other Developed Markets? When do large-cap stocks outperform small-cap stocks, and when do growth stocks outperform value stocks? Are those ebbs and flows in the performance of major thematic investments somehow interlinked, and can we uncover some insights into why this occurs? Those are the questions we will try to answer in the following analysis.
Existing Literature
A major factor behind the strong performance of the U.S. equity market in comparison to its counterparts is the presence of an exceptionally high number of the world’s most productive companies headquartered in the United States. When we assess global companies according to their returns on capital, American companies consistently emerge as notable leaders.
On the other hand, while we can find reasons to be optimistic about the continued strong performance of U.S. stocks, historical trends indicate that international stocks may soon experience a resurgence. Looking back to 1975, the cycles of U.S. stock outperformance relative to international stocks have typically lasted around eight years on average. At present, we find ourselves 12.6 years into the current cycle of U.S. outperformance, as indicated by 5-year monthly rolling returns.
Approach and Methodology
This led us to our research questions: we will look at these cycles of underperformance and outperformance closer, try to better understand them and maybe even more precisely predict them (when they end, what stage of the cycle we are in, and when a new cycle emerges).
Set-Up and Data Preparation
Our data collection consisted of the following sources:
- Yahoo Finance (finance.yahoo.com)
- MSCI global markets indices (https://app2.msci.com/products/index-data-search/)
We have taken historical data about five representative ETFs from Yahoo Finance. To replicate the findings, you should get daily data that are dividends + splits adjusted (column Adj Close) and map them to EOM (end-of-month) values.
However, recently, Yahoo Finance discontinued free end-of-day data downloads. As a result, we recommend sourcing data from our preferred provider, EODHD.com – the sponsor of our blog. EODHD offers seamless access to +30 years of historical prices and fundamental data for stocks, ETFs, forex, and cryptocurrencies across 60+ exchanges, available via API or no-code add-ons for Excel and Google Sheets. As a special offer, our blog readers can enjoy an exclusive 30% discount on premium EODHD plans.
Since there was not always a corresponding ETF market with a sufficient length, we also needed to calculate the history behind the corresponding indices. We found some corresponding indices on Yahoo Finance; for the other, the MSCI index archive website (link little above) was useful for our purposes (we usually selected Index Level Gross when we picked historical indexes).
Our analysis starts in 1/31/1994, ends in 8/31/2023 and here is the recapitulation of underlying data sources:
| product | ETF | index |
| US Large Cap | SPY | S&P 500 (TR) (^SP500TR) |
| US Small Cap | IWM | Russel TR Index |
| US Large Value | IVE | SP500 TR Value index |
| EAFE countries | EFA | MSCI Index |
| EM countries | EEM | MSCI Index |
Approach
- We obtained and prepared all data, as described in the previous step.
- Then, we calculated the monthly performance for each abovementioned ETF.
- We calculated four main spreads (against SPY) [SPY-IWM as a proxy for large vs. small cap investment theme, SPY-IVE as a proxy for growth vs. value investment theme, SPY-EFA as a proxy for the US vs. DM theme, and finally, SPY-EEM as a proxy for US vs. EM investment theme].
- Finally, we plotted all four spreads and tried to see clues on which we might lay out hypotheses.
Spreads Visualisations
This is the performance of 4 spreads of SPY (US equities) vs. other investment themes (IWM as a proxy for small-cap stocks, IVE as a proxy for value stocks, EFA as a proxy for EAFE stocks, and EEM as a proxy for EM stocks):
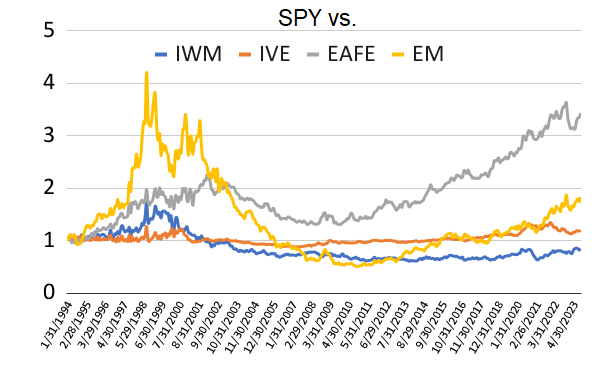
As you are used to knowing, the x-axis shows the time series by date, the y-axis the appreciation of the value of $1 USD invested in each such spread (always long SPY, and sell corresponding ETF/theme, 100% weight in long ETF and -100% weight in short ETF).
Here they are in the table with the usual risk performance and parameters:
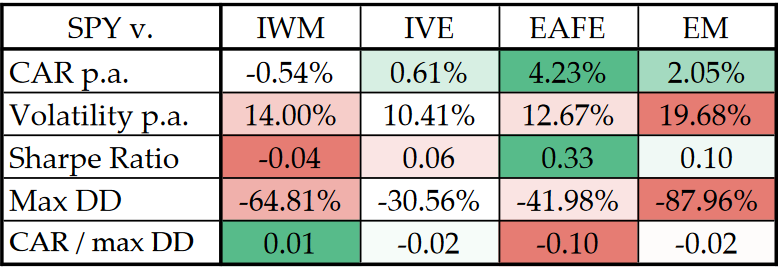
What are the first findings? We can conclude that over the last 30 years (approximately, more precisely, 29 and 1/2 years), the broad US stock market totally crushed EAFE (Europe, Asia, and Far-East) developed markets region (by over 4% on a yearly basis), outperformed Emerging Market stocks (by over 2% on a yearly basis), slightly outperformed value stocks (by 0.6%) and underperformed somewhat broad small-cap US stocks (by -0.5%).
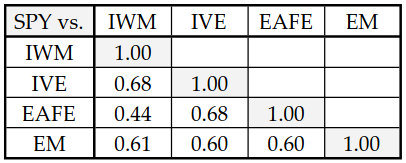
And here comes the correlation matrix:
Here is the distribution of yearly total returns of the previously mentioned spreads:
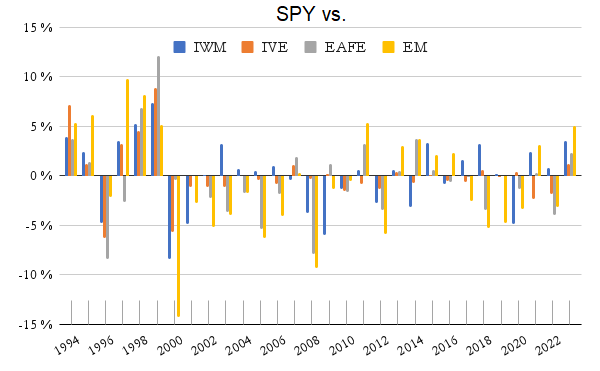
The main takeaway from the correlation matrix and distribution of the yearly returns is that the average correlation between spreads is around 0.6, which is pretty high. It is also clearly visible in the performance chart that if any spread is performing well (so, for example, the US outperforms EM stocks), the other ones generally do well too; for example, the broad US market also “participates” in overperformance against EAFE, value and small-caps along with EM.
From the first visual representation (equity curves of all four spreads), it is obvious that the spreads tend to trend, so as a second step, we have undergone a battery of various tests to test out the trend-following nature of the spreads. We have not limited ourselves only to testing trendfollowing but also various reversals and tried to find out what patterns drive the cycles in spreads.
Trend-following rules tests
In the following part of the analysis, we tested simple trend-following strategies on all four individual spreads (SPY as a proxy for US equities vs. other investment themes, IWM as a proxy for small-cap stocks, IVE as a proxy for value stocks, EFA as a proxy for EAFE stocks, and EEM as a proxy for EM stocks). We use various lag periods, ranging from 6 months to 3 years. The trading rule is pretty simple and straightforward: if the past X months of performance of spread is positive, for the next month, we are long spread (long SPY, short corresponding equity ETF); else, we short the spread (short SPY, long corresponding ETF).
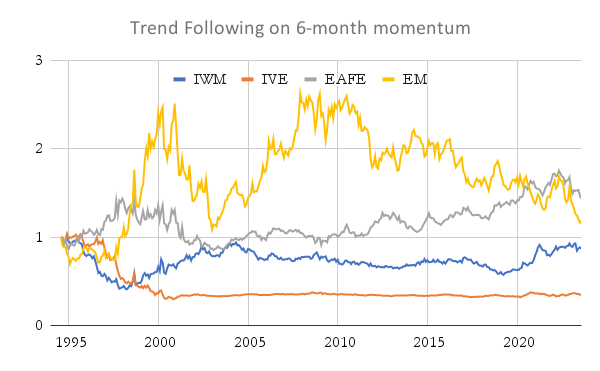
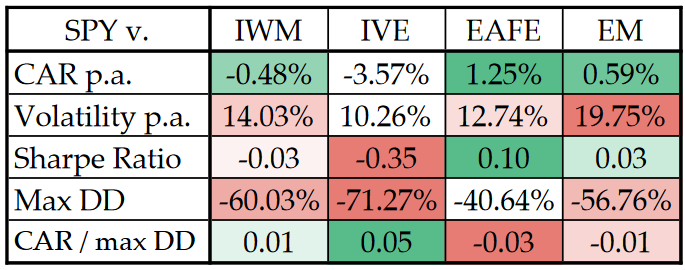
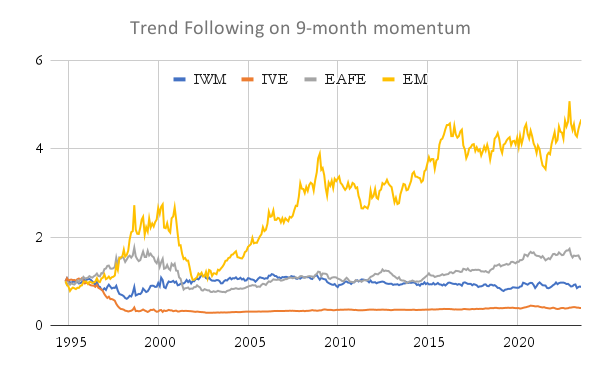
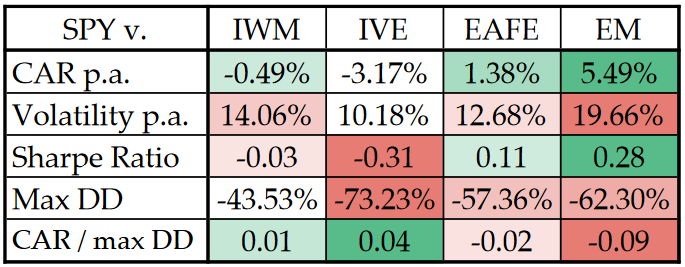
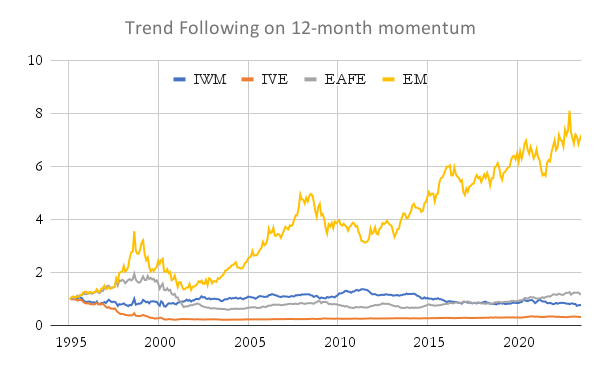
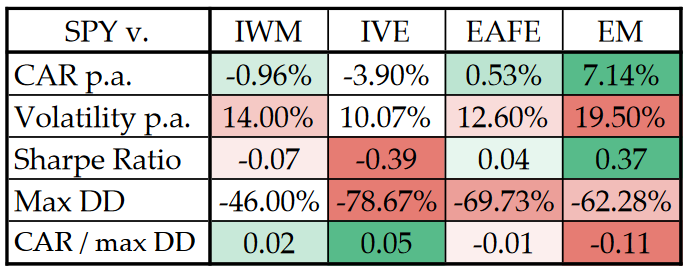
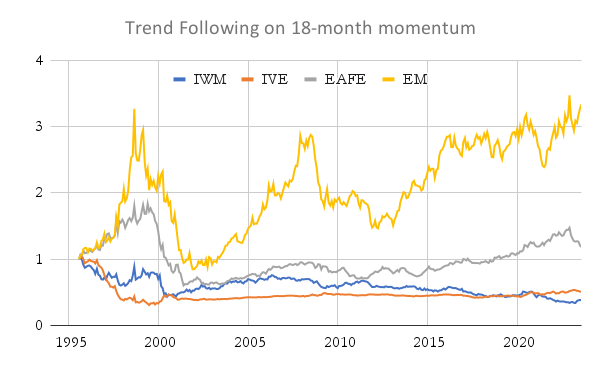
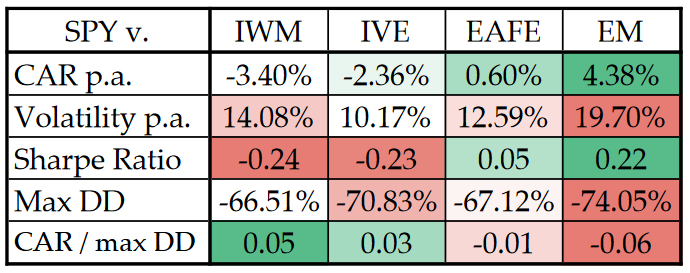
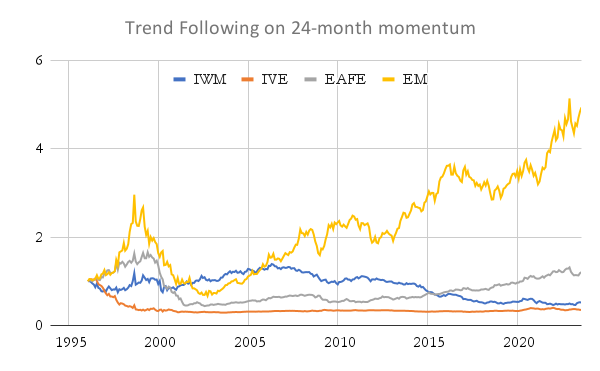
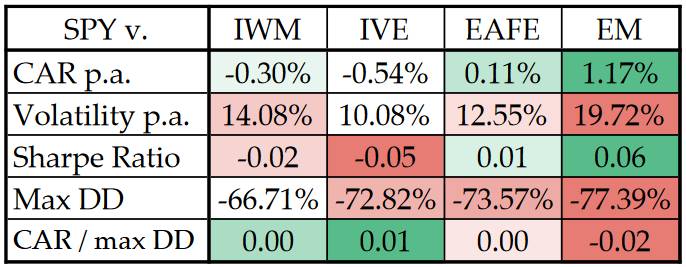
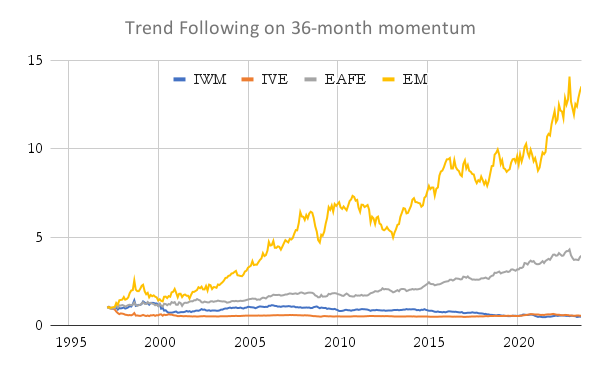
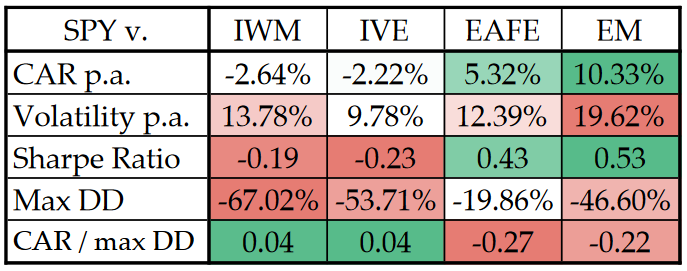
The SPY vs. EM and SPY vs. EAFE are the most trending spreads, particularly at higher/longer timeframes. The SPY vs. EM is performing fine also at the 1-year momentum horizon but really stars at the 3-year momentum lag. The main problem is a really high drawdown in all trend strategies. So, what’s the quick conclusion for the asset allocator? If US stocks outperform EM or EAFE stocks on a 12-36-month horizon, then you can probably safely bet that they will continue to do so for some time …
The other two spreads (SPY vs. IWM/small caps and SPY vs. IVE/value stocks) do not show profitable performance when we apply trend-following rules. On the other hand, those two spreads tend to show reversal patterns, mostly in the first years of the sample. We will show these reversal patterns in the following part of the analysis…
Reversal rules results
In the following part of the analysis, we tested simple reversal strategies. We use two lag periods (1-month and 3-month). The trading rule is once again simple: if the past X months of performance of spread is positive, for the next month, we are short spread (short SPY, long corresponding equity ETF); else, we long the spread (long SPY, short corresponding ETF).
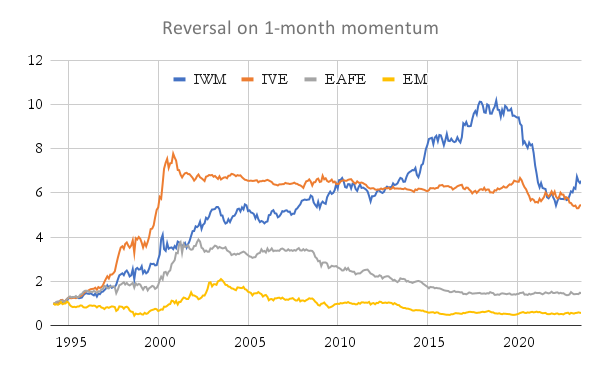
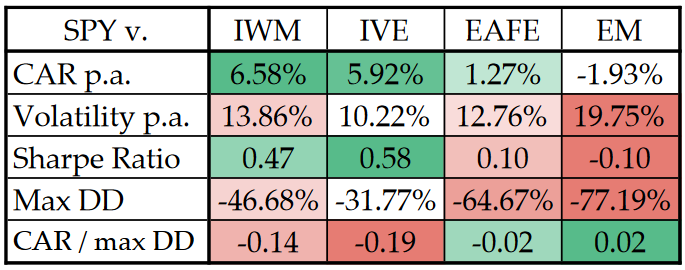
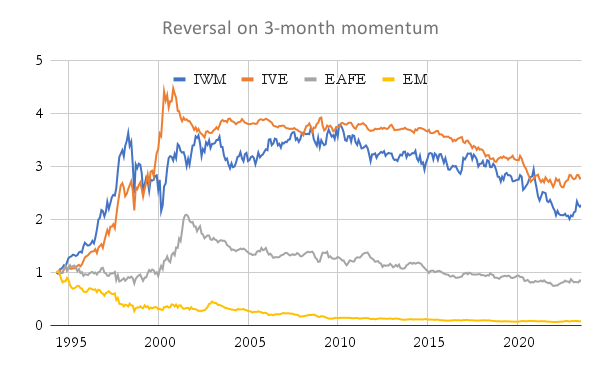
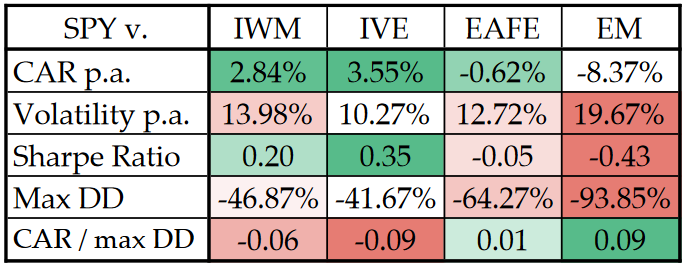
At shorter time frames (1 month and 3 months), the reversal rule is highly favored. Mainly, it seems that the SPY vs. IWM (small caps) spread is the most sensitive on reversal patterns. However, most of the performance of the reversal strategies is concentrated in the first part of the data sample (the 1990s and the beginning of the 2000s) when the market was less efficient. Reversal rules in the last 10-15 years do not offer any continuation in the alpha …
Analysis of the Effects of the US Dollar
Why do US stocks outperform EM and EAFE stocks in such trends for a longer period? It may seem like a puzzle at first. But there is one underlying force that connects those markets and may be the key if we want to understand better the behavior of those two particular spreads (SPY vs. EM and SPY vs. EAFE). This force is the US dollar.
The EM and EAFE ETFs are usually priced in USD, and if the local EM of EAFE currency strengthens against the USD, it is seen in the performance of the ETF. On the other hand, the appreciation of the USD translates into the underperformance of the EM and EAFE markets. You may remember our article where we replicated over 100 years of data on the United States Dollar. After that, we enriched our research by testing its impact on various asset classes. For a refresher, here are published blog posts about our findings:
The main conclusion from the articles mentioned above is that the US Dollar tends to trend, and its strength/weakness translates into the performance of the main asset classes, with the strongest impact on the performance of commodities. A lot of the EM (and some EAFE) countries are big commodity producers, and their stocks are a part of the broad EM and EAFE indexes. It would not be surprising if the US dollar also had some impact on the performance of SPY vs. EM or SPY vs. EAFE spreads.
So let’s review the findings:
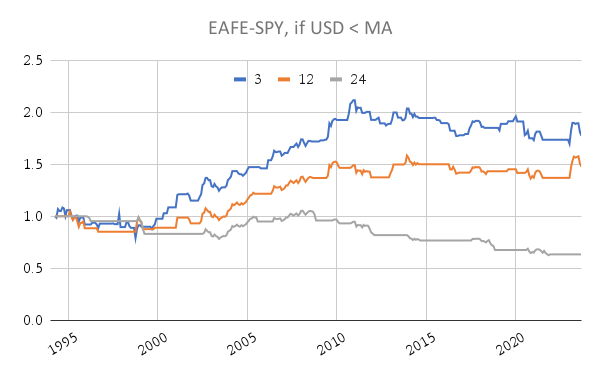
We decided to switch the SPY vs. EAFE spread to long EAFE stocks and short SPY so that we could better show and explain our findings. We can definitely see that if you are long EAFE and short SPY during times of weak USD Dollar (mainly when the USD is under its 3- or 12-month moving average), you would be yielding positive performance.
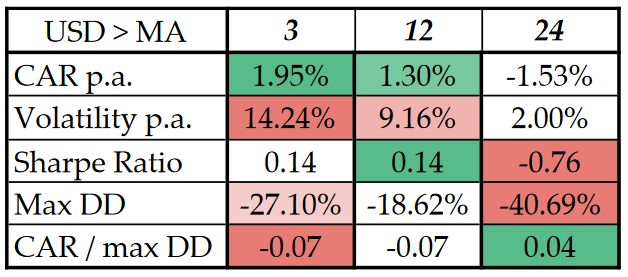
On the other hand, if we use this exact spread in the case of a strong Dollar (USD over its moving average), the results are the following:
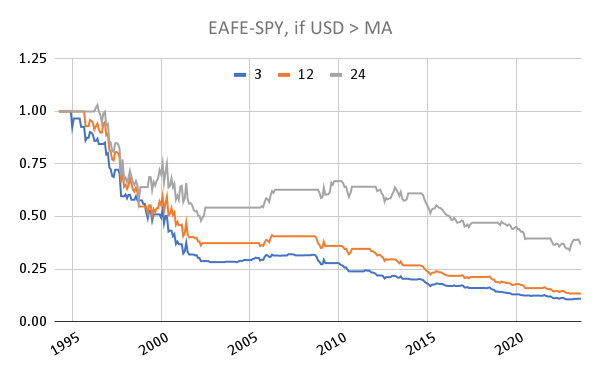
Being reverse, thus going long EAFE, short SPY in case of a strong USD Dollar (current month over its chosen average) is a significantly negative endeavor.
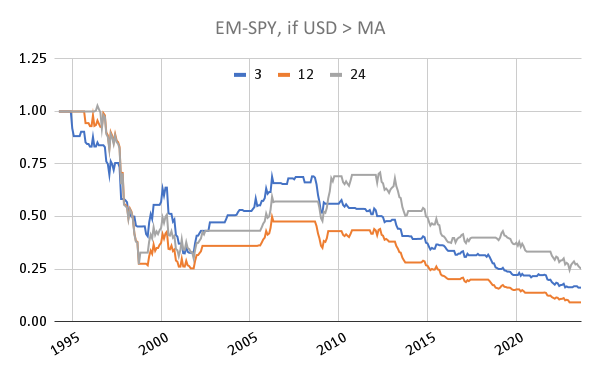
And here are the results for EMs:
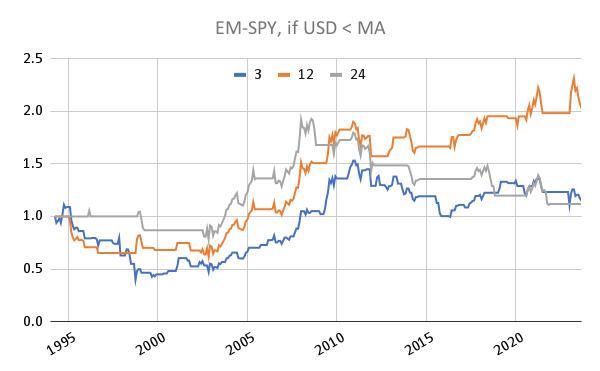
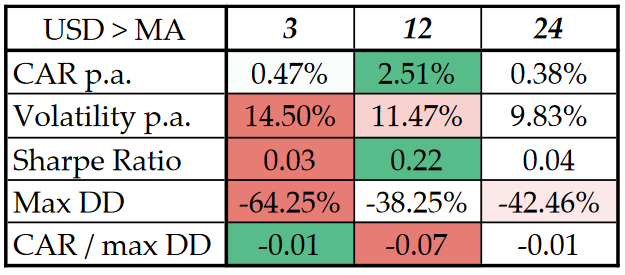
Here, we also have positive results, but they are significant only in the case of a 12-month timeframe.
And here it is with the reversed rules. We can once again see that strong USD is not helpful if you want to invest outside of the US market.
Conclusion
We have tested and tried to unravel some of the forces that may be affecting the timing of the periods of the US market outperformance and/or underperformance. We have found out that periods of outperformance and underperformance come in cycles, and some spreads (US vs. EM or US vs. EAFE) are more suited to trade using trend-following rules, while other spreads (for example, large vs. small caps) sometimes show a mean-reverting behavior.
As an interesting additional test, we introduced a simple complementary US dollar regime filter to see how it impacts results. The strength of the US dollar doesn’t impact the large vs. small cap and growth vs. value spread a lot. But the US dollar has a significant impact on the outperformance/underperformance of the EAFE and EM region against the US market.
Author:
Cyril Dujava, Quant Analyst, Quantpedia.com
Are you looking for more strategies to read about? Sign up for our newsletter or visit our Blog or Screener.
Do you want to learn more about Quantpedia Premium service? Check how Quantpedia works, our mission and Premium pricing offer.
Do you want to learn more about Quantpedia Pro service? Check its description, watch videos, review reporting capabilities and visit our pricing offer.
Do you want algorithmic access to the full Quantpedia database via the API? Subscribe to Quantpedia Pro, ask for an API key, and explore the in/out-of-sample statistics, source academic papers, and code snippets — ideal for quantitative research, systematic trading workflows, and AI model training.
Are you looking for historical data or backtesting platforms? Check our list of Algo Trading Discounts.
Or follow us on:
Facebook Group, Facebook Page, Twitter, Linkedin, Medium or Youtube
Share onLinkedInTwitterFacebookRefer to a friend


