Thanksgiving and Christmas Trading Strategies
This article examines the impact of major consumer holidays, Thanksgiving and Christmas, on financial markets. Using historical price data from 2004 to 2024, we analyze daily performance trends in the 10 trading days before and after each holiday to determine whether seasonal spending influences asset prices. Our findings suggest that seasonal consumer spending influences financial markets, with Amazon benefiting around Thanksgiving and gold during Christmas.
Introduction
There are times of the year when people spend more than usual. Valentine’s Day brings higher spending on flowers and chocolate, while Halloween drives costume and candy sales. However, Christmas and Thanksgiving stand out as world’s peak consumer holidays, with significantly higher spending levels. Among the most influential shopping events in the Western Hemisphere, Thanksgiving and Christmas are both culturally and economically important. Thanksgiving, celebrated on the fourth Thursday of November in the U.S., marks the start of the holiday shopping season. The following day, Black Friday, has become one of the largest retail events, with businesses offering deep discounts. Similarly, Christmas, on December 25th, drives purchasing of gifts, decorations, food, and travel.
These spending surges also affect financial markets. One well-known phenomenon is the Santa Claus Rally—the tendency for stocks to rise in the last few trading days of December and the first few days of January. This is part of a broader concept known as seasonality—recurring trends that occur at specific times of the year. Financial markets often react to these seasonal consumption patterns, and traders have developed investment strategies to take advantage of them.
Seasonality is well-known to investors as well as researchers. At Quantpedia, we have analyzed over 100 seasonal trading strategies across commodities and stocks, revealing predictable patterns in certain sectors during specific times of the year. Our next goal is to assess how these major consumer holidays influence financial markets and whether these patterns present profitable investment opportunities beyond pre-holiday effect.
First, we introduce the data and methodology used in our study. We then present our results and discuss key trends in asset performance around Thanksgiving and Christmas.
Methodology & Data
Our investment universe consists of five exchange-traded funds (ETFs): DIA, XLY, XLP, GLD, and AMZN. Historical data were pulled from EODHD.com – the sponsor of our blog. EODHD offers seamless access to +30 years of historical prices and fundamental data for stocks, ETFs, forex, and cryptocurrencies across 60+ exchanges, available via API or no-code add-ons for Excel and Google Sheets. As a special offer, our blog readers can enjoy an exclusive 30% discount on premium EODHD plans.The investment period spans from November 18, 2004, to December 31, 2024.
To assess the impact of holiday-driven consumption on financial markets, we analyzed daily performances in the 10 trading days before (D-10) and 10 trading days after (D+10) each holiday (Thanksgiving and Christmas). Only trading days were considered to maintain consistency, as financial markets are closed on certain holiday dates. For each ETF, we calculated the average performance on each relative day (D-10 to D+10) across all years. For example, to determine AMZN’s performance on D-10, we collected its daily performance on D-10 for each year from 2004 to 2024, then calculated the average of these values. This process was repeated for all ETFs and all relative days to obtain a historical trend of performance around Thanksgiving and Christmas.
We hypothesize that XLY, AMZN, and GLD outperform benchmark ETFs (DIA and XLP) due to increased consumer spending during Thanksgiving and Christmas. Extensive holiday purchasing is likely to be reflected in the stronger performance of consumer-focused ETFs (XLY, AMZN) and gold (GLD), compared to broad market benchmarks.
Results
In this section we summarize the key trends observed in our analysis of Thanksgiving and Christmas. Our findings are best illustrated using column graphs.
Thanksgiving
For Thanksgiving, we observe that consumer discretionary (XLY) slightly outperforms consumer staples (XLP). The same pattern appears when comparing XLY to DIA, the broad market index. We present the visual interpretation of averages of performances on each relative day across all years for both XLY (Figure 1) and DIA (Figure 2).
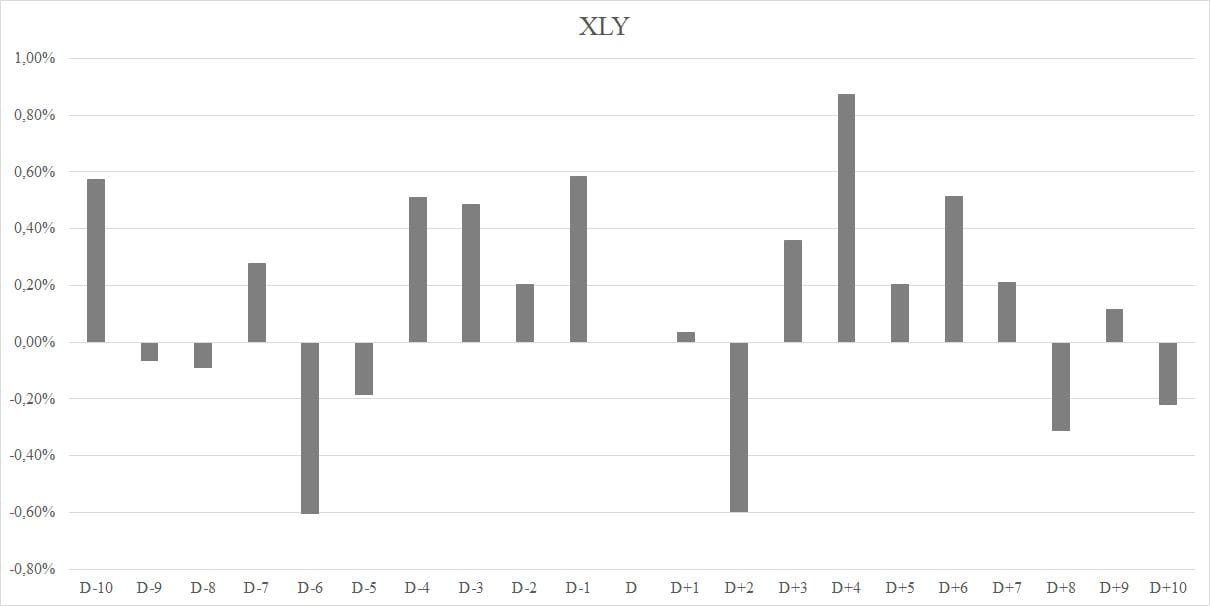
Figure 1 XLY Average Performance around Thanksgiving (D-10 to D+10, 2004–2024)
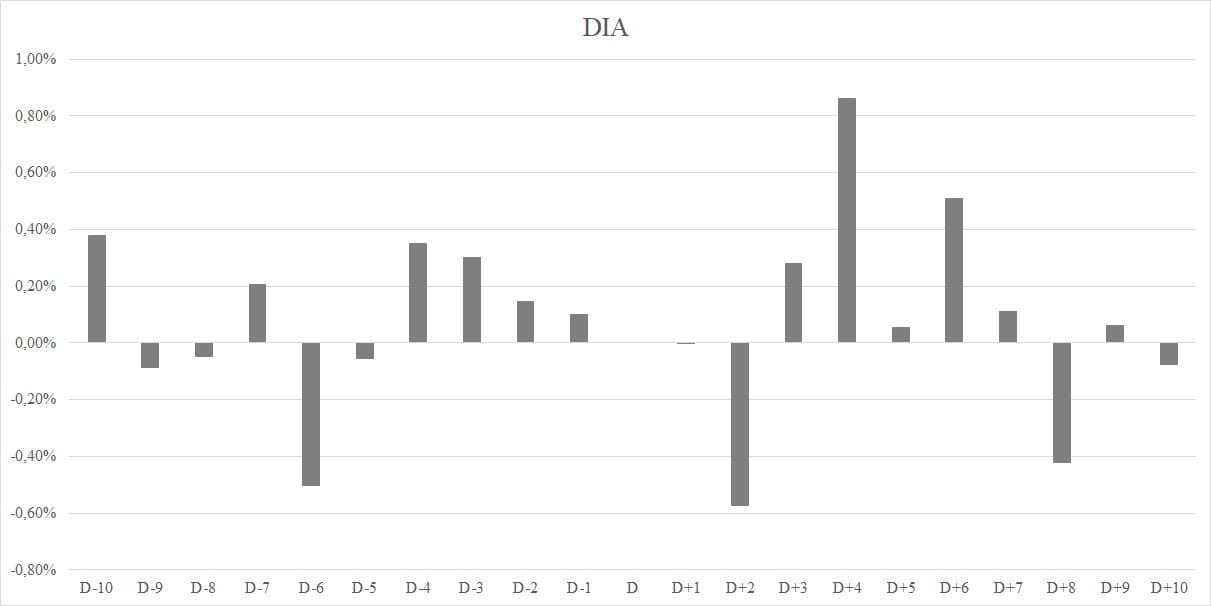
Figure 2 DIA Average Performance around Thanksgiving (D-10 to D+10, 2004–2024)
We believe this outperformance is largely driven by Amazon (AMZN), which holds a 20% weight in XLY. To test our hypothesis, we analyzed the spread between XLY and DIA and found a clear drift around Thanksgiving (Figure 3). This suggests that the consumer discretionary sector gets a seasonal boost during this period.
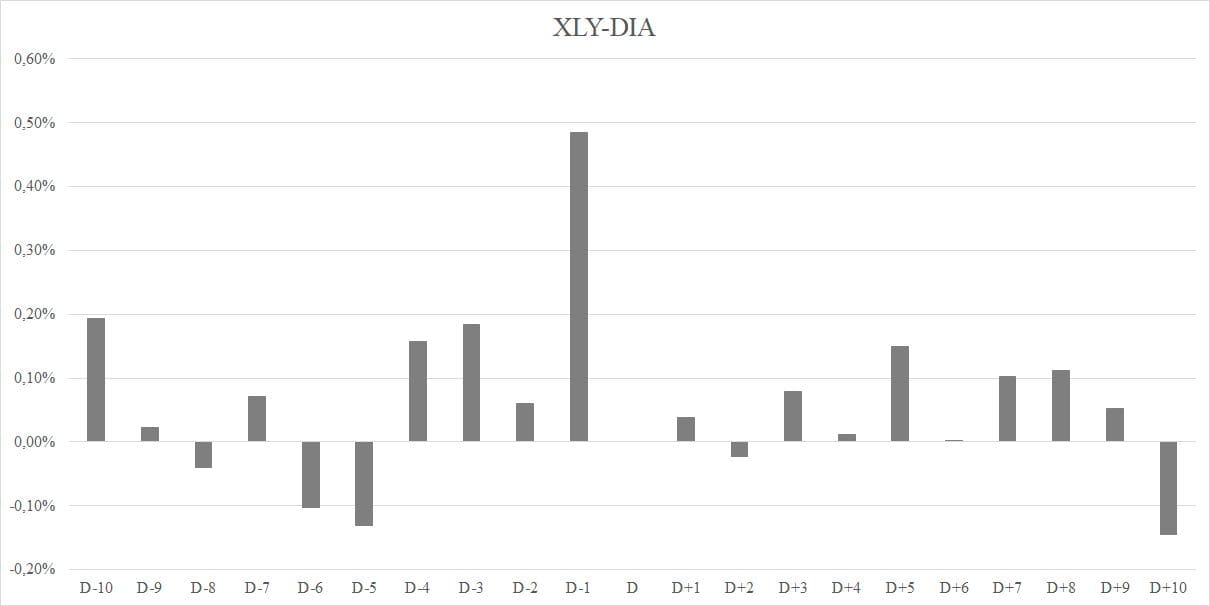
Figure 3 XLY-DIA Average Performance around Thanksgiving (D-10 to D+10, 2004–2024)
Since AMZN makes up a significant portion of XLY, we wanted to measure how much of XLY’s outperformance over DIA comes from Amazon. Our hypothesis is that AMZN is the main driver of this spread. We illustrate this idea on Figure 4, with blue line representing the outperformance of XLY over DIA and black line representing the 20% weighted AMZN. It seems that the magnitude of XLYs outperformance movement is close to AMZNs movement. In other words, the outperformance of XLY over DIA can primarily be attributed to AMZN which constitutes for 20% of XLY.
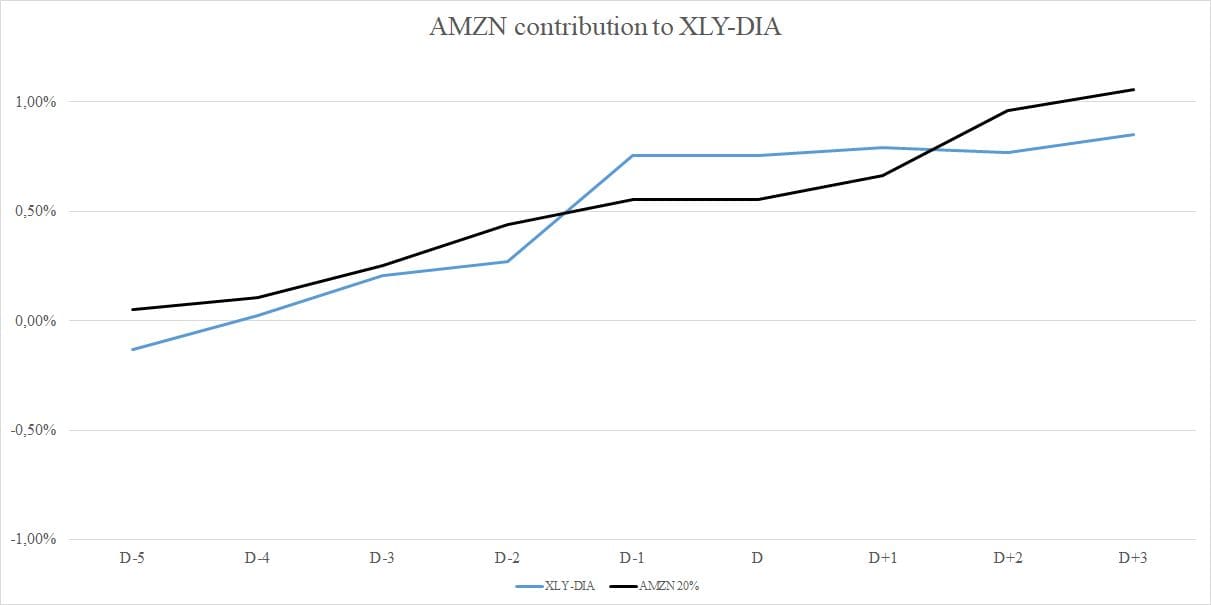
Figure 4 AMZN contribution to XLY-DIA around Thanksgiving (D-5 to D+3, 2004–2024)
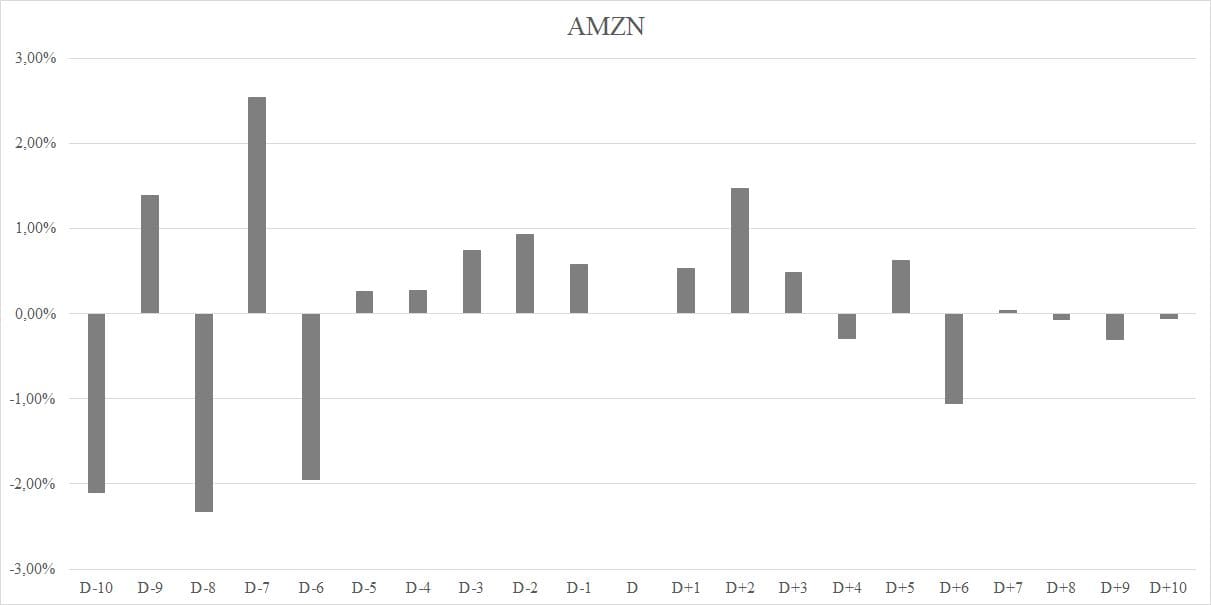
Figure 5 AMZN Average Performance around Thanksgiving (D-10 to D+10, 2004–2024)
A closer look at AMZN’s performance (Figure 5) reveals a clear upward drift between D-5 and D+3, suggesting that Amazon’s stock benefits from the holiday shopping period. This trend is also visible in the equity curve (Figure 6), which tracks AMZN’s performance from D-5 to D+3 across years 2004 to 2024. Looking at a longer time frame, Amazon has shown a consistent upward drift since 2004 as a result of increasing popularity of online shopping.
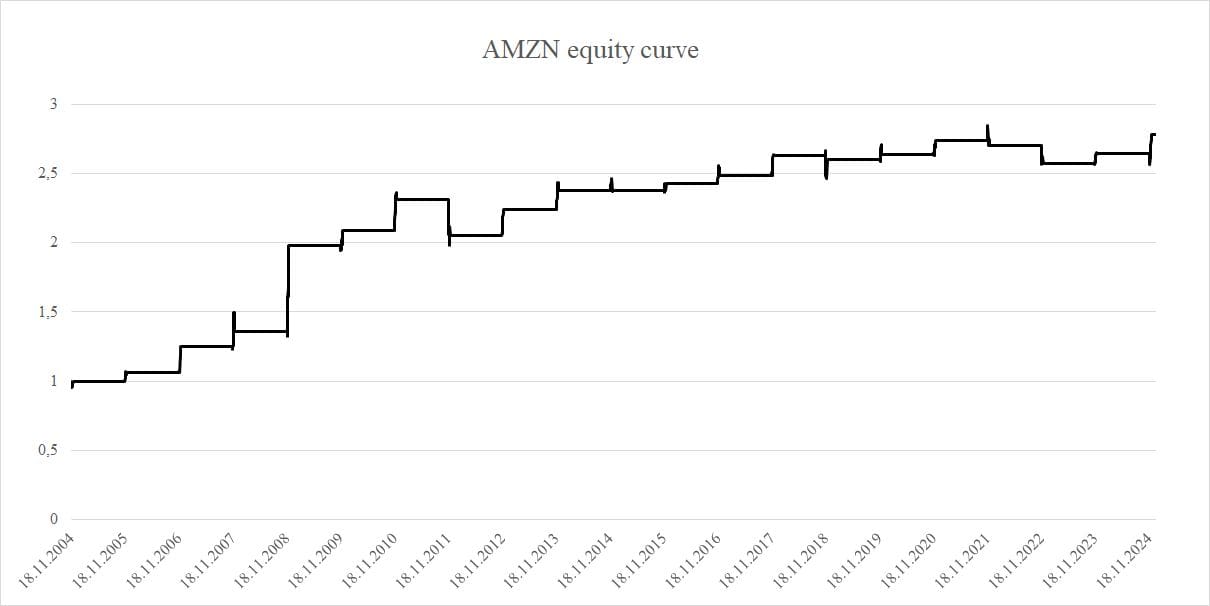
Figure 6 AMZN equity curve (2004–2024)
We propose a strategy of buying AMZN on D-5 and holding the position until D+3, with D standing for Thanksgiving Day. The strategy delivers an average annual return of 5.18% with a volatility of 9.30%. The maximum drawdown observed over the full period is 15.88%. The Sharpe Ratio, which reflects risk-adjusted returns, stands at 0.56, while the Calmar Ratio, comparing annual return to maximum drawdown, is 0.33 (Table 1).

Table 1 Performance Table AMZN (D-5 to D+3, 2004–2024)
When testing for gold (GLD) performance, no significant trend appears around Thanksgiving. Unlike consumer discretionary stocks, gold prices do not show a strong pattern during this period.
Christmas
Moving to Christmas, we see a different pattern. The well-documented pre-holiday effect is strongest on D-1, the day before Christmas, for AMZN, XLY, and DIA. However, after D-1, no clear trends appear for most ETFs.
Interestingly, gold (GLD) behaves differently around Christmas compared to Thanksgiving. A strong and consistent trend appears when buying GLD on D-2 (December 23rd) and holding it until D+5, approximately the first trading day of the New Year (Figure 7).
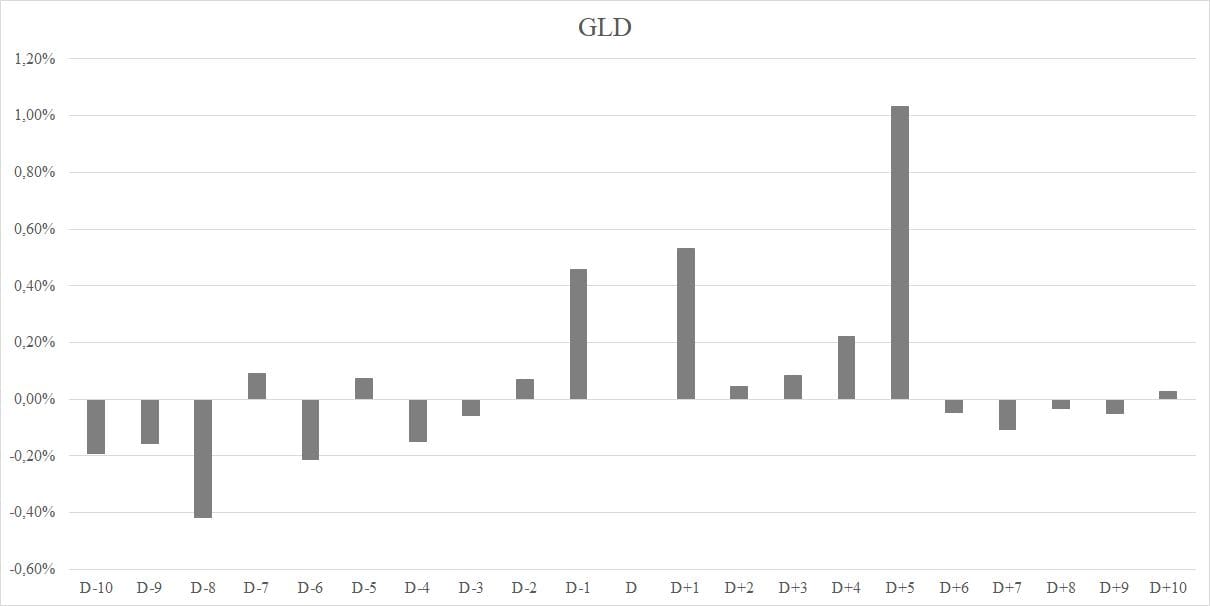
Figure 7 GLD Average Performance around Christmas (D-10 to D+10, 2004–2024)
This seasonal price drift is visible in the equity curve (Figure 8), supporting the idea that gold demand rises during Christmas.
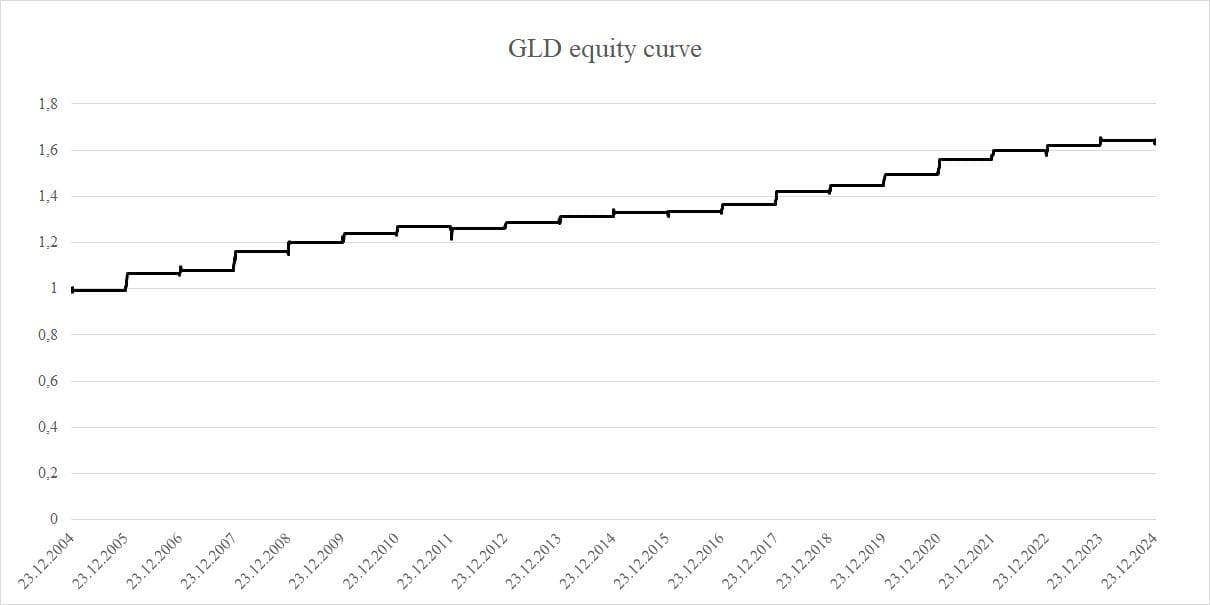
Figure 8 GLD equity curve (2004-2024)
We propose a strategy of buying GLD on D-2 (December 23rd) and holding the position until D+5, with D representing Christmas Day. The strategy delivers an average annual return of 2.48% with a volatility of 2.51%. The maximum drawdown over the full period is 4.34%. The Sharpe Ratio stands at 0.99, while the Calmar Ratio is 0.57 (Table 2).

Table 2 Performance Table GLD (D-2 to D+5, 2004–2024)
Conclusion
We studied the impact of Thanksgiving and Christmas, major consumer holidays, on financial markets, focusing on the performance of 5 ETFs. The results suggest that seasonal effects exist, but they vary by asset and timing.
For Thanksgiving, the data shows a clear drift in AMZN’s performance from D-5 to D+3. For Christmas, a strong pre-holiday effect occurs on D-2, particularly for AMZN, XLY, and DIA. The exception is GLD, which shows a consistent seasonal trend. Buying gold on D-2 (December 23rd) and holding it until D+5 (around the first trading day of the New Year) results in a visible price drift.
Overall, our findings confirm the presence of seasonal market patterns linked to major shopping holidays. The consumer discretionary sector benefits from increased spending around Thanksgiving, while gold sees a seasonal boost during Christmas. These findings suggest that seasonal consumer spending can impact financial markets, creating potential opportunities for investors.
Author: Margaréta Pauchlyová, Quant Analyst, Quantpedia
Are you looking for more strategies to read about? Sign up for our newsletter or visit our Blog or Screener.
Do you want to learn more about Quantpedia Premium service? Check how Quantpedia works, our mission and Premium pricing offer.
Do you want to learn more about Quantpedia Pro service? Check its description, watch videos, review reporting capabilities and visit our pricing offer.
Are you looking for historical data or backtesting platforms? Check our list of Algo Trading Discounts.
Would you like free access to our services? Then, open an account with Lightspeed and enjoy one year of Quantpedia Premium at no cost.
Or follow us on:
Facebook Group, Facebook Page, Twitter, Linkedin, Medium or Youtube
Share onLinkedInTwitterFacebookRefer to a friend


