The Distribution of Stock Market Concentration in the U.S. Over the History
More and more, a few mega-cap companies dominate the US stock market performance. Financial journals come up with different names for those stocks every few years. They are now called the “Magnificent Seven“, but we all remember FAANG, right? Naturally, several questions arise – Is the current status quo, when the stock market capitalization is highly concentrated among the few extremely large companies, an exception or rule over history? And what’s the impact of this concentration on the performance of the one particular factor – the Size premium? We present the research paper written by Emery and Koëter that tries to answer those questions.
Analysis from (Emery and Koëter, 2023) shows that the expected size premium increases during higher stock market concentration periods. These results indicate that the capital allocation effect dominates the relation between stock market concentration and the size premium. Moreover, these results occur predominantly among firms in industries with a greater dependence on external equity financing or for firms with relatively low book-to-market ratios (i.e., growth firms).
Smaller firms receive less attention, are less likely to complete a seasoned equity offering, and have higher fundamental volatility during periods of higher stock market concentration. The first of two proposed channels is the thesis that stock market concentration implies that the idiosyncratic risk of large firms needs to be diversified in the market portfolio. This phenomenon could create a risk premium for large firms while the expected returns for small firms decrease due to diversification. The second one is that stock market concentration could reflect less efficient capital allocation, which makes it more difficult for small firms to raise equity financing, thus increasing their expected returns.
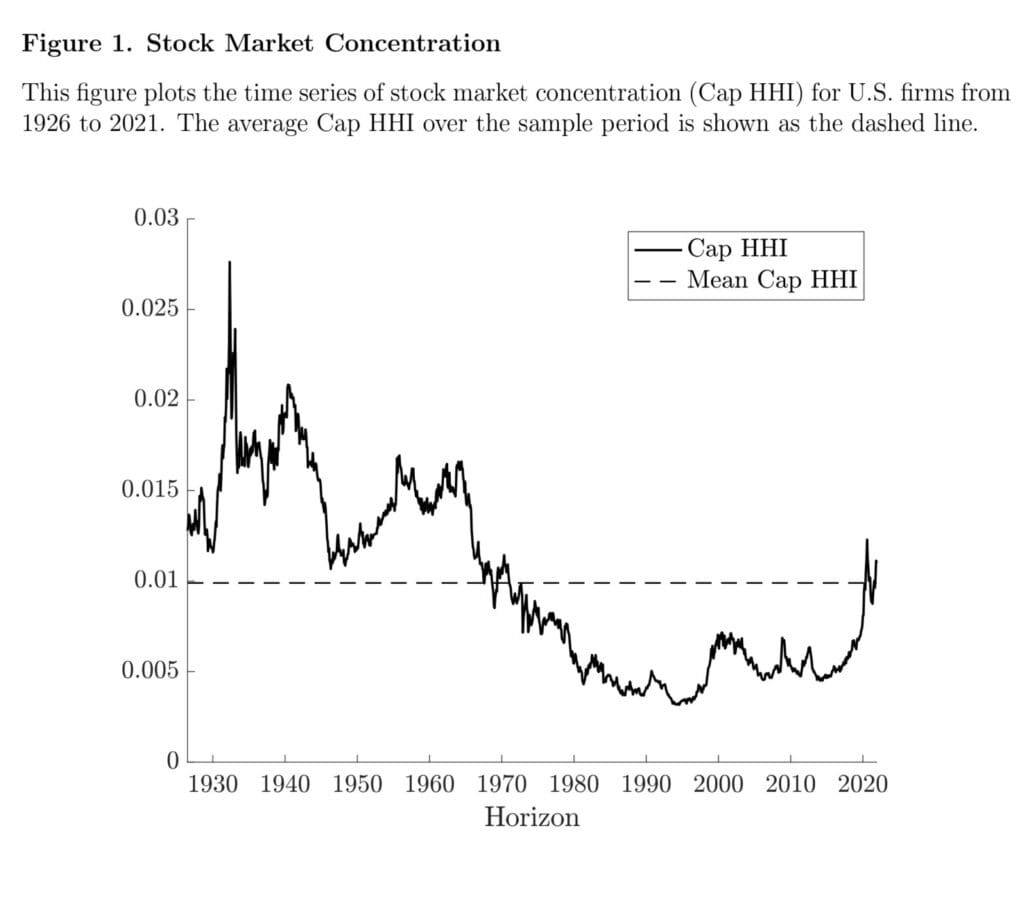
We would like to point out Figure 1, which plots the time series of stock market concentration from 1926 through 2021. The stock market was significantly more concentrated prior to 1970 than it has been in the past several decades. However, stock market concentration has increased substantially recently to levels not seen since the early 1970s.
However, despite the dominance of the capital allocation effect, authors also find evidence of a granular diversification effect. Specifically, the expected size premium weakens following idiosyncratic shocks to the largest firms in the stock market. Evidence also corroborates that stock market concentration is associated with less efficient capital allocation (Bae et al., 2021).
Overall, this is an excellent contribution to understanding the asset pricing implications of stock market concentration and the resulting granularity, which is increasingly vital due to the steady rise in market concentration.
Authors: Logan P. Emery and Joren Koëter
Title: The Size Premium in a Granular Economy
Link: https://papers.ssrn.com/sol3/papers.cfm?abstract_id=4597933
Abstract:
The distribution of market capitalization in the U.S. is highly concentrated. We investigate how this phenomenon impacts the difference in returns between small and large firms (i.e., the size premium). If the stock market is sufficiently concentrated (i.e., granular), large firms may carry a risk premium because their idiosyncratic risk is not diversified in the market portfolio. At the same time, prior work has shown that small firms may be allocated too little capital in concentrated stock markets, which could increase their expected returns. We find that the expected size premium increases by 13.33 percentage points per annum during periods of higher concentration, indicating that the capital allocation effect dominates. Evidence from a variety of tests on investor attention, equity financing, fundamental volatility, and capital intensity support this conclusion. Nonetheless, we also find evidence of an active granular diversification effect, as the size premium weakens following idiosyncratic increases in granularity.
As always, we present several exciting figures and tables:
Notable quotations from the academic research paper:
“Specifically, we investigate how stock market concentration affects the size premium. First documented by Banz (1981), the size premium refers to the fact that firms with relatively low market capitalization tend to earn higher stock returns compared to firms with relatively high market capitalization.2 The characteristics of a granular economy may have important implications for the size premium. If the idiosyncratic risk of the largest firms is not diversified in aggregate, then investors should require a premium to hold those stocks, which increases the expected returns of large firms. This granular diversification effect suggests that higher stock market concentration should decrease the expected size premium.
Given the opposite predictions of the granular diversification and capital allocation effects, our analysis focuses on determining which effect dominates the relation between stock market concentration and the size premium. We begin by assessing the level of stock market concentration in the U.S. Concentration tends to increase during poor economic conditions and has increased substantially in recent decades. For example, the 20 largest firms represented 19.7% of total market capitalization in 1995 and 33.0% of total market capitalization in 2021. We also show that the stock market is sufficiently concentrated to generate granular effects. Using a simple modeling framework, we estimate that idiosyncratic variance accounts for between 4.5% and 14.8% of market variance, which suggests that granular effects are nontrivial.
While we establish our main results using portfolio-level regressions, our results also hold at the firm level, in which we include a battery of control variables to mitigate concerns of alternative explanations. One particular concern is that the effects we attribute to stock market concentration could simply be a reflection of product market concentration or the resulting market power of dominant firms. Product market concentration, which is often measured using the concentration of sales, and market power, which is often measured using markups, directly affect firm fundamentals, which in turn determine asset prices. Moreover, several studies have found that these quantities are significant predictors of stock returns (Hou and Robinson, 2006; Bustamante and Donangelo, 2017; Corhay et al., 2020; Loualiche, 2021; Clara, 2023). To isolate the effect of stock market concentration, we explicitly control for sales concentration (at both the economy and industry levels) and markups (using the measure developed by De Loecker et al. (2020)) in our regressions. Even with these controls, stock market concentration significantly predicts the size premium. In addition, if stock market concentration simply reflects product market concentration, one would expect the effects of stock market concentration to be stronger when measured within product markets (i.e., industries). In contrast, we find that stock market concentration within industries does not significantly predict the size premium. The effects of stock market concentration therefore primarily exist at the stock market level.
Although the capital allocation effect dominates the granular diversification effect, it does not exclude the possibility that both effects are simultaneously present. To investigate the granular diversification effect more directly, we calculate the value-weighted idiosyncratic shocks to the ten largest firms as a shock to the granularity of the stock market. Positive shocks further tilt the market portfolio toward these largest firms such that investors may require additional compensation for the increased exposure to the idiosyncratic risk of these firms. Moreover, investors could become willing to pay a premium for other firms to diversify this increased idiosyncratic risk, with the effect being amplified for smaller firms because their supply of equity deviates more significantly from a fully diversified allocation. Taken together, these effects create a discount in the value of large firms and a premium in the value of small firms, which result in lower and higher expected returns going forward, respectively. Consistent with this prediction, we find that the expected size premium decreases by 3.99 percentage points per annum following a one standard deviation increase in idiosyncratic shocks to the ten largest firms. This effect comes from both the large and small firms, whose returns increase and decrease following these shocks, respectively. Moreover, both stock market concentration and idiosyncratic shocks to the ten largest firms significantly, but oppositely, predict the size premium when included in the same regression. This result supports the conclusion that the capital allocation and granular diversification effects are simultaneously present.
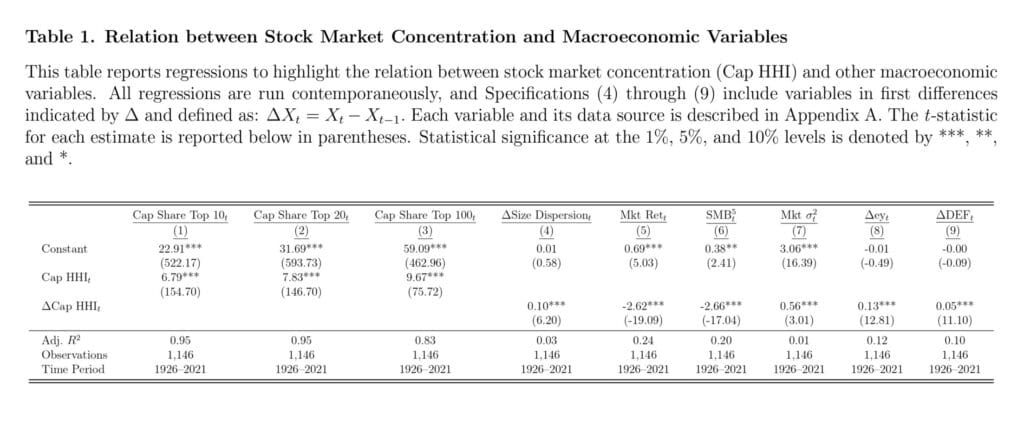
Table 1 reports regressions to illustrate the relation between stock market concentration and other macroeconomic variables. First, in Specifications (1) through (3), we show the strong connection between Cap HHI and the relative market capitalization of the top 10, 20, or 100 firms in the U.S. stock market. The results indicate that Cap HHI is strongly associated with the U.S. stock market being dominated by a few very large firms. Second, in Specification (4), we relate changes in Cap HHI to changes in the relative size dispersion of the U.S. stock market, which is captured by the difference between the 90% and 10% quantile of the size distribution scaled by the median of the size distribution. The results in Specification (4) show that changes in Cap HHI are positively associated with changes in the relative size dispersion. However, the R2 is only 0.03, which indicates that the relative size dispersion explains only a small amount of the variation in Cap HHI. Thus, Cap HHI appears to be mostly driven by the set of very large firms.
As can be seen [on Figure 2], the distribution does not follow a linear relation in the log-log plot, and therefore is not accurately described by a power law distribution. Instead, the distribution closely resembles the distribution of sales as reported in Compustat, which has been characterized as log normal (Stanley et al., 1995) rather than power law due to the omission of private firms (Axtell, 2001). To circumvent this issue, previous research has estimated ζ using only the largest firms, thus reducing the likelihood of omitted firms (Hill, 1975; Gao, 2023). To demonstrate, we plot the top 10% of stocks for December 2021 in Panel B of Figure 2.”
Are you looking for more strategies to read about? Sign up for our newsletter or visit our Blog or Screener.
Do you want to learn more about Quantpedia Premium service? Check how Quantpedia works, our mission and Premium pricing offer.
Do you want to learn more about Quantpedia Pro service? Check its description, watch videos, review reporting capabilities and visit our pricing offer.
Do you want algorithmic access to the full Quantpedia database via the API? Subscribe to Quantpedia Pro, ask for an API key, and explore the in/out-of-sample statistics, source academic papers, and code snippets — ideal for quantitative research, systematic trading workflows, and AI model training.
Are you looking for historical data or backtesting platforms? Check our list of Algo Trading Discounts.
Or follow us on:
Facebook Group, Facebook Page, Telegram, Twitter, Linkedin, Medium or Youtube
Share onLinkedInTwitterFacebookRefer to a friend


