Time Series Variation in the Factor Zoo
Factor investing and detailed allocation according to different sets of factors are lively researched topics with many unanswered and open questions. Many views are often conflicting and from both radical sides — on one, that only a few factors should be necessary to explain the cross-section of mean returns, which is attractive, especially because of its simplicity; on the other, that you can use complex (authors examine the 161 “clear predictors” and 44 “likely predictors”) combinations of factors from less known and unorthodox models, but falling into dangerous and often unexamined “factor zoo” with many undesirable, unexamined and non-controllable outcomes. A huge gap is often seen in finance between the theory of academia and practical applications (by PMs [portfolio managers]), and so is especially present in this one. Let’s take a look at what the complexity of factors does for various equities pricing models.
Previous academic research generally agrees that a substantial number of factors have significant explanatory power and that the number of significant factors varies substantially over time. Authors of previous research papers use simulation methods to show that neither the average number of periods where a factor is significant or the average period of time with significance is consistent with the null hypothesis that factor premia are constant over time; they further show that the number of significant factors varies with measures of economic complexity and firm diversity. The diversity of used factors suggests that the determinants of expected returns are not necessarily confined to those predicted by these standard models and can vary as market conditions and the economic environment change.
Hendrik Bessembinder, Aaron Burt, and Christopher M. Hrdlicka (Jan 2022), in their paper, contribute to the subject with the claim that widely–used three– to six–factor models (for examples, several of Fama and French’s) do a better job of explaining the cross–section of returns as compared to the Capital Asset Pricing Model (CAPM). However, while these models outperform the CAPM in terms of explaining returns to characteristic-sorted (size and market-to-book) portfolios, they do not reliably outperform industry portfolios and most often perform worse than the CAPM for the cross-section of stock returns. Return premia have been shown to depend on intermediaries’ funding liquidity, leverage, and balance sheets, as well as on the state of the economy. In short, it is unclear that return premiums in actual capital markets are necessarily governed by only a small and time–invariant set of factors. On the other hand, out-of-sample Sharpe ratios for portfolios formed from the principal components of factors that are significant in-sample are economically large and comparable to those obtained from recent machine learning applications.
Further, the results of existing studies that assess whether factors identified in-sample are useful for portfolio construction out-of-sample are altered when the only substantive change in research design is to allow for time variation in factor premia. On balance, the paper findings suggest that multiple and time–varying factors may be required to price the cross–section of returns as the economy continues to evolve dynamically and new firms are listed. Dynamic economic factors such as recession indicator variables, interest rates, and investors’ requests on new firms’ valuations, including the percentage of firms that pay dividends, and mean institutional ownership rates, contribute to mention that some of the factors may become archaic and not usable anymore. The last result is noteworthy in part because the three- to six-factor models all include the market factor, implying that the non-market factors degrade the ability of the models to explain mean returns to individual stocks. To the extent that the perception that only a few factors should matter for stocks, in general, is based on the performance of three- to six-factor models in explaining returns to characteristic-sorted portfolios, the perception is misplaced. The identity of the marginal investor can differ across stocks and in any given stock can vary through time.
Authors: Hendrik Bessembinder, Aaron Burt, and Christopher M. Hrdlicka
Title: Time Series Variation in the Factor Zoo
Link: https://papers.ssrn.com/sol3/papers.cfm?abstract_id=3992041
Abstract:
The ability of three- to six-factor models to explain the cross-section of stock returns varies substantially over time, providing scope for time-varying numbers of additional factors. We show that additional factors are relevant and non-redundant, as out-of-sample Sharpe ratios formed from principal components of factors identified in-sample are economically substantive and continue to increase up to more than twenty factor principal components. The numbers of significant factors are strongly related to variation in economic conditions and measures of diversity in firm characteristics. These results suggest that time variation in the number of significant factors reflects time-varying economic complexity.
As always, we present several interesting figures and tables:
Notable quotations from the academic research paper:
“[F]oundational asset pricing models such as the CAPM or the consumption-based CAPM imply that a single factor should be sufficient to explain the cross-section of returns if it is measured correctly. […] Variation in the economic relevance of individual factors can arise because of changes in individual factors’ return premium per unit of factor risk or in the quantity of factor risk (i.e., factor betas).2 It is broadly recognized that the return premia associated with canonical factors such as firm size or value (market-to-book ratio) have varied substantively over time.3 Haddad, Kozak, and Santosh (2020) broaden this avenue of inquiry by showing that time variation in the top few principal components associated with a set of fifty “anomaly” portfolios can be identified based on the market-to-book ratios of the factors themselves. Our results are consistent with Haddad, Kozak, Santosh (2020) in that both their study and ours document that conditional return premia can be substantially higher than unconditional premia. However, we focus on time variation in the relevance of individual factors rather than a constant set of principal components formed from a fixed set of factors. We document that time variation in the number of significant factor premia is more the rule than the exception across a large sample of over two hundred factors, demonstrate the economic relevance and non-redundancy of the significant factors both in- and out-of-sample, and assess the economic determinants of variation in the number of significant factors.
Cochrane (2011) observes that essentially all variation in price-to-dividend ratios is attributable to changes in discount rates, i.e., expected returns. If factor models determine expected returns it follows that variation in discount rates is attributable to time variation in interest rates and factor return premia.
At first glance, our findings may appear to contrast with conclusions reached by earlier authors. Kelly, Pruitt, and Su (2019) present evidence indicating that as few as five latent factors identified by the technique of Instrumented Principal Components Analysis can outperform existing factor models and lead to insignificant alpha estimates. Kozak, Nagel, and Santosh (2020) report that a stochastic discount factor formed from a small number of factor principal components performs well in terms of the pricing model’s out-of-sample R-squared statistic, and Kozak, Nagel, and Santosh (2018) report that factor principal components beyond the first few do not contribute meaningful to out-of-sample Sharpe ratios. However, our rolling estimation approach allows for flexible time variation in factor return premia in a manner that these studies do not.6 We apply our methods to the same data studied by Kozak, Nagel and Santosh (2018) and show that the divergence of our outcomes from theirs is attributable to our allowance for time variation in factor return premia. Further, we use the data and programs posted by Kozak, Nagel and Santosh (2020) to show that, even though they do not allow for time variation in factor premia, out-of- sample Sharpe ratios implied by their analysis continue to increase as more factor principal components are used to form portfolios, even while the R-squared statistic on which they focus rises only modestly.
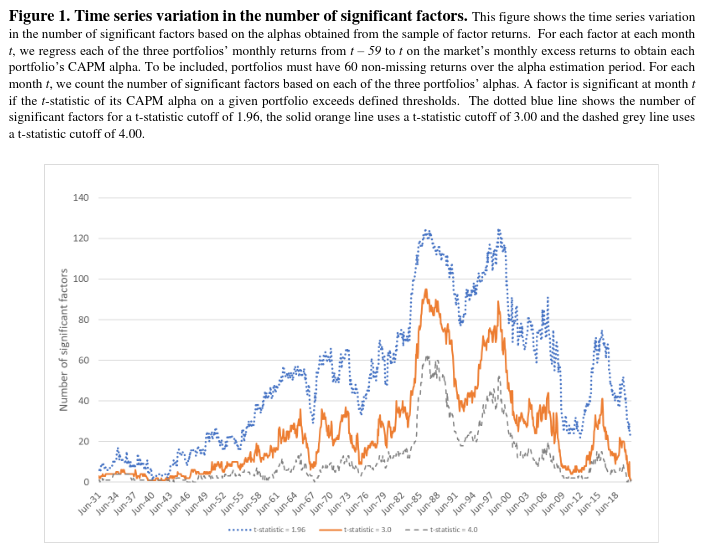
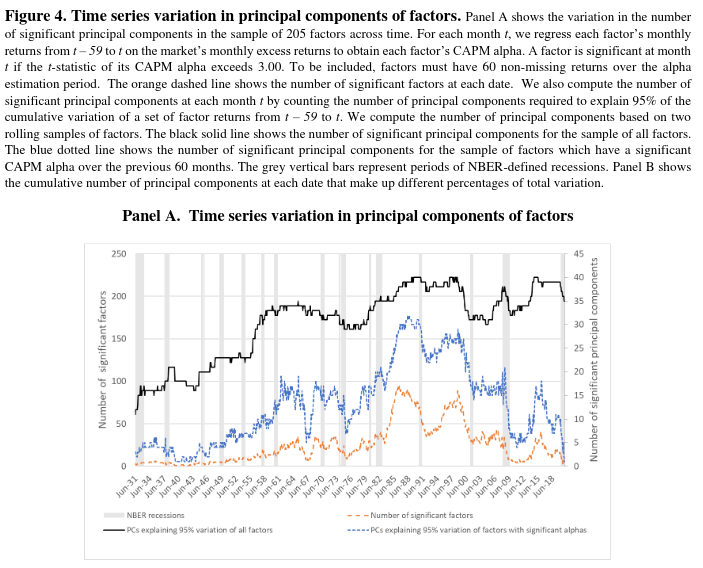
[…] we display the number of factors with significant prior-sixty-month CAPM alphas as of each month. The orange solid line in Figure 1 panel A displays time series variation in the number of significant factors. For comparison, we also display with the dotted blue and dashed grey lines the numbers of factors that are significant based on alternative t-statistics hurdles of 1.96 and 4.00, respectively.9 While we focus on outcomes based on a t-statistic of 3.00, all three measures are highly correlated and support similar conclusions regarding the importance of allowing for time variation in the number of factors.
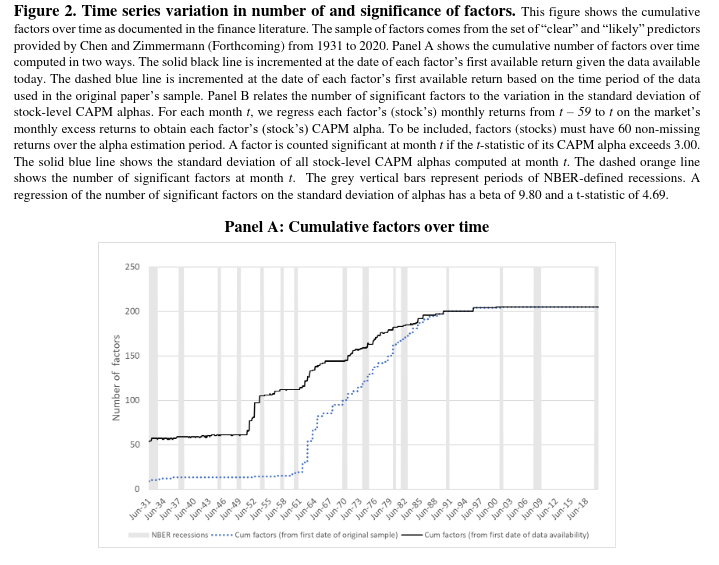
Figure 2 displays information regarding the scope for multiple factors to explain returns. Panel A of Figure 2 displays the number of factors amongst the 205 studied by Chen and Zimmermann (2021) that were identified in the CRSP data for each of the indicated dates. The dotted blue line displays the factor count starting from the earliest data used in the original studies, while the solid black line includes factors as of the (often earlier) date for which all data necessary to construct the factors is now available.12 […] The key point conveyed by Panel A of Figure 2 is that the literature has identified a substantial number of factors that can be studied even in data from the earlier decades covered by the CRSP dataset.
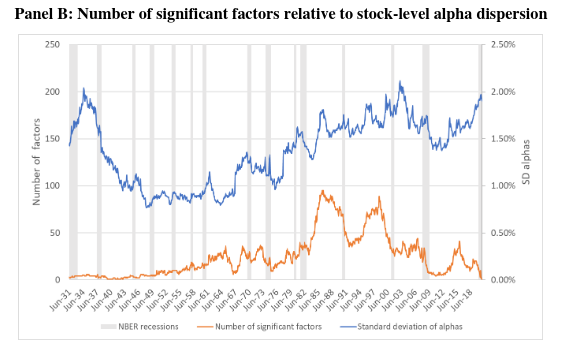
Panel B of Figure 2 displays information regarding CAPM alpha estimates for factors as well as individual stocks. The dotted orange line displays the number of factors with statistically significant (t- statistic greater than 3.00) alpha estimates based on return data for the prior sixty months. The solid blue line displays the cross-sectional standard deviation of estimated individual stock CAPM alphas over the same periods. As noted, we view the cross-sectional variation in CAPM alphas to comprise a useful measure of the amount of variation in mean stock returns that can potentially be explained by pricing factors other than the overall market, i.e., as a measure of the scope for additional factors to be relevant.
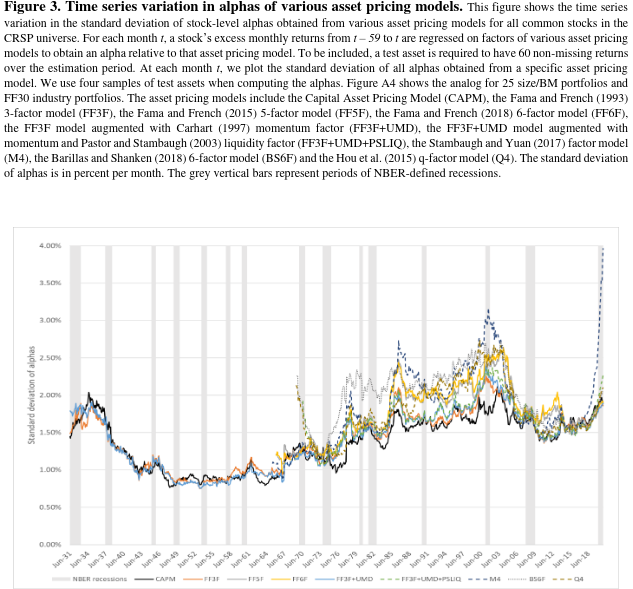
Figure 3 displays data informative as to the extent to which the use of prominent multi-factor models improves on the CAPM in terms of reducing the cross-sectional standard deviation of individual firm alpha estimates. Large reductions in the variability of firm alpha estimates, if observed, would be indicative that the factors employed in these workhorse models have substantive explanatory power for mean firm returns, implying limited scope for additional factors. […]
The most noteworthy result that can be observed on Figure 3 is that the multifactor models do not outperform the CAPM in terms of reducing the cross-sectional variability of individual stock alpha estimates. […]
That is, the prominent three- to six-factor models typically leave more, not less, unexplained variation in mean individual stock returns, as compared to the CAPM. This reduction in explanatory power is all the more notable because the market return is included as a factor in the three-to-six factor models. The inclusion of factors in addition to the market must necessarily improve fit (as measured by R-squared) in the time series factor regression for each individual stock. However, the inclusion of these additional factors results in stock-specific intercept estimates that are on average further from rather than nearer to the benchmark of zero that is implied by the factor models. The implication is that the non- market factors included in the three-to-six factor models degrade the ability to explain the cross-section of average individual stock returns.13”
Are you looking for more strategies to read about? Sign up for our newsletter or visit our Blog or Screener.
Do you want to learn more about Quantpedia Premium service? Check how Quantpedia works, our mission and Premium pricing offer.
Do you want to learn more about Quantpedia Pro service? Check its description, watch videos, review reporting capabilities and visit our pricing offer.
Do you want algorithmic access to the full Quantpedia database via the API? Subscribe to Quantpedia Pro, ask for an API key, and explore the in/out-of-sample statistics, source academic papers, and code snippets — ideal for quantitative research, systematic trading workflows, and AI model training.
Are you looking for historical data or backtesting platforms? Check our list of Algo Trading Discounts.
Or follow us on:
Facebook Group, Facebook Page, Twitter, Linkedin, Medium or Youtube
Share onLinkedInTwitterFacebookRefer to a friend


