Transaction Costs of Factor Strategies
A very important research papers related to all equity factor strategies … Authors: Li, Chow, Pickard, Garg Title: Transaction Costs of Factor Investing Strategies Link: https://papers.ssrn.com/sol3/papers.cfm?abstract_id=3359947 Abstract: Although hidden, implicit market impact costs of factor investing strategies may substantially erode the strategies’ expected excess returns. The authors explain these market impacts costs and model them using rebalancing data of a suite of large and longstanding factor investing indices. They introduce a framework to assess the costs of rebalancing activities, and attribute these costs to characteristics such as rate of turnover and the concentration of turnover, which intuitively describe the strategies’ demands on liquidity. The authors evaluate a number of popular factor-investing strategy implementations and identify how index construction methods, when thoughtfully designed, can reduce market impact costs. Notable quotations from the academic research paper: “Factor investing strategies have become increasingly popular. According to data from Morningstar Direct, assets under management (AUM) in factor investing ETFs and mutual funds across global markets increased from just below US$75 billion in 2005 to more than US$800 billion by the end of 2016. In practice, when a provider rebalances an index, most managers tracking it execute the necessary transactions near the close of the rebalancing day in order to minimize their portfolio’s tracking error. The fund managers may appear to be perfectly tracking the index; in another words, minimizing implementation shortfall, which is the aggregate difference between the average traded price and the closing price of each of the index’s underlying securities on the rebalancing day. Thus, the total implementation cost of an index fund could be perceived as merely the sum of the explicit costs associated with trading, such as commissions, taxes, ticker charges, and so forth. This notion misses the propagating market impact that trading has on the index’s value. The large volume of buy and sell orders for the same securities, executed at the same time, can result in securities prices moving against the managers, producing losses for both the index and the fund investors. This implicit cost is often overlooked because it is not visible when comparing a fund’s net asset value (NAV) and the index’s value; it can, however, be overwhelmingly large relative to the explicit costs for strategies with massive AUM. This article focuses on unmasking the market impact costs that arise from synchronous buying and selling. We analyze the behavior of stocks that were traded during the rebalancing of 49 FTSE RAFI™ Indices (henceforth, “the indices”). We find significant evidence of market impact on the rebalancing day and a subsequent price reversal over the next four days. We find that the magnitude of price impact is predictable, because it is directly related to the security’s liquidity and the size of the trade. Specifically, we identify that a fund incurs approximately 30 basis points (bps) of trading costs due to market impact for every 10% of a stock’s average daily volume (ADV) traded in aggregate by the factor investing index–tracking funds.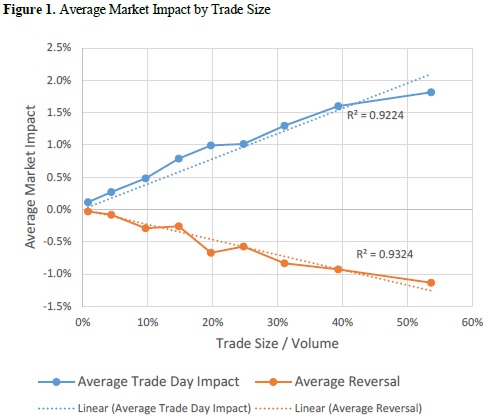
| Algo Trading Data Discounts are available exclusively for Quantpedia’s readers. |
 ”
”
Are you looking for more strategies to read about? Sign up for our newsletter or visit our Blog or Screener.
Do you want to learn more about Quantpedia Premium service? Check how Quantpedia works, our mission and Premium pricing offer.
Do you want to learn more about Quantpedia Pro service? Check its description, watch videos, review reporting capabilities and visit our pricing offer.
Do you want algorithmic access to the full Quantpedia database via the API? Subscribe to Quantpedia Pro, ask for an API key, and explore the in/out-of-sample statistics, source academic papers, and code snippets — ideal for quantitative research, systematic trading workflows, and AI model training.
Are you looking for historical data or backtesting platforms? Check our list of Algo Trading Discounts.
Or follow us on:
Facebook Group, Facebook Page, Telegram, Twitter, Linkedin, Medium or Youtube
Share onLinkedInTwitterFacebookRefer to a friend


