Trend Breaks in Trend-Following Strategies
Trend-following strategies are very effective when markets are cleanly trending, but they suffer when trends end too soon. How markets behaved during the last few years, were they prone to last-longing trends? Are we able to immunize trend-following to endure the negative impact of trend breaks better? A research paper written by Garg, Goulding, Harvey, and Mazzoleni finds a negative relationship between the number of turning points (a month in which slow 12-month and faster 2-month momentum signals differ in their indications to buy or sell) and risk-adjusted performance of a 12-month trend-following strategy. The average number of turning points experienced across assets has increased in recent years. But we can implement a “dynamic” trend-following strategy that adjusts the weight it assigns to slow and fast time-series momentum signals after observing market breaks to recover much of the losses experienced by static-window trend following…
Authors: Garg, Goulding, Harvey, Mazzoleni
Title: Breaking Bad Trends
Link: https://papers.ssrn.com/sol3/papers.cfm?abstract_id=3594888
Abstract:
We document and quantify the negative impact of trend breaks (i.e., turning points in the trajectory of asset prices) on the performance of standard trend-following strategies across several assets and asset classes. The frequency of trend breaks has increased in recent years, which can help explain the lower performance of monthly trend following in the last decade. We illustrate how to repair trend-following strategies by exploiting the return forecasting properties of the different types of trend breaks: market corrections and rebounds. We construct dynamic multi-asset trend-following portfolios, which harvest more than double the average returns of standard trend-following investing strategies over the last decade.
Notable quotations from the academic research paper:
“Trend-following investing (i.e., time-series momentum strategies) can successfully exploit trends in asset prices. Trend will occasionally break down, however, and reverse direction (i.e., at market corrections and rebounds). At and after these breaks, or turning points, in momentum, such trend following tends to place bad bets because trailing returns can reflect an older, inactive trend direction. Faster trend signals (e.g., only a few months of trailing returns), rather than solving the problem, increase the tendency of placing bad bets because faster signals often reflect noise instead of a true turn in trend.
We study the impact of trend breaks and present three main new findings. First, we document and quantify the impact of turning points on trend following. We defi ne a turning point for an asset as a month in which its slow (longer lookback horizon) and fast (shorter lookback horizon) momentum signals di ffer in their indications to buy or sell. We fi nd a negative relationship between the number of turning points that an asset experiences and the risk-adjusted performance of its 12-month trend-following strategy.
Second, we find that the number of breaking points can help explain the deterioration of trend-following performance in more recent years.
As our third main fi nding, we present trend-following strategies that react dynamically to asset turning points and that improve performance of multi-asset trend-following portfolios, especially in months after asset turning points, which have become more frequent in recent years.
In Exhibit 2, we plot the annual returns of a multi-asset portfolio of static 12-month trend-following strategies as a function of the average number of turning points for those assets in the year.
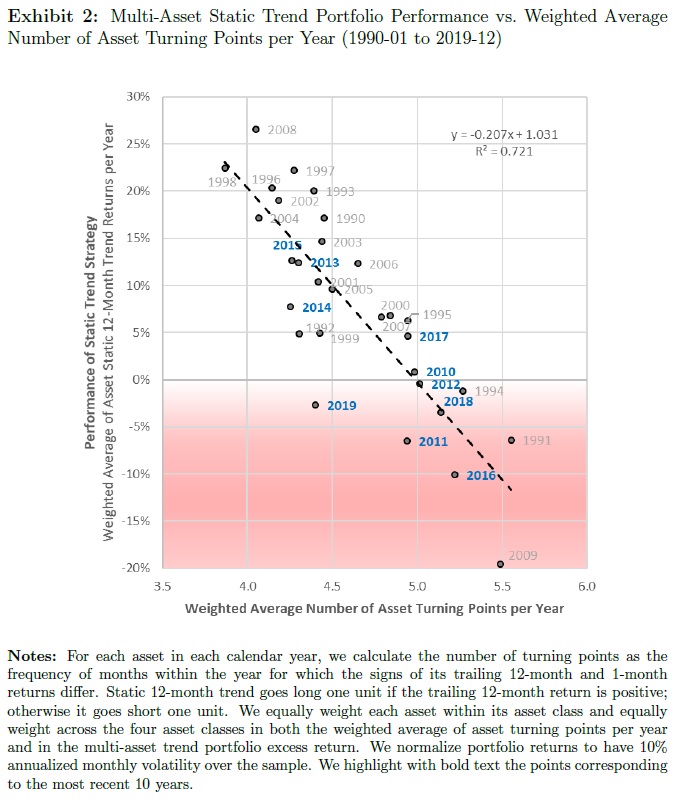
Exhibit 2 shows a distinct negative relationship between the number of turning points and the risk-adjusted performance of trend-following strategies. The downward sloping fi tted trend line (R2 = 0.72 and slope -0.21) quanti fies the negative relationship. A one-standard-deviation increase in the weighted average number of asset turning points (+0.45, say, from 4.50 to 4.95) translates to approximately 9.2 percentage points lower annual return, which is economically signi ficant relative to the 10% annualized volatility level over the sample.
The dynamic trend strategy return for each asset in each month blends the fast and slow returns in a way that can vary after observing di fferent market states. The mixing parameters tilt each asset’s strategy away from or toward its fast trend strategy. We use the 2- and 12-month look-back horizons for fast and slow signals, respectively, in our empirical analysis.
| What about Data? Look at Quantpedia’s Algo Trading Promo Codes. |
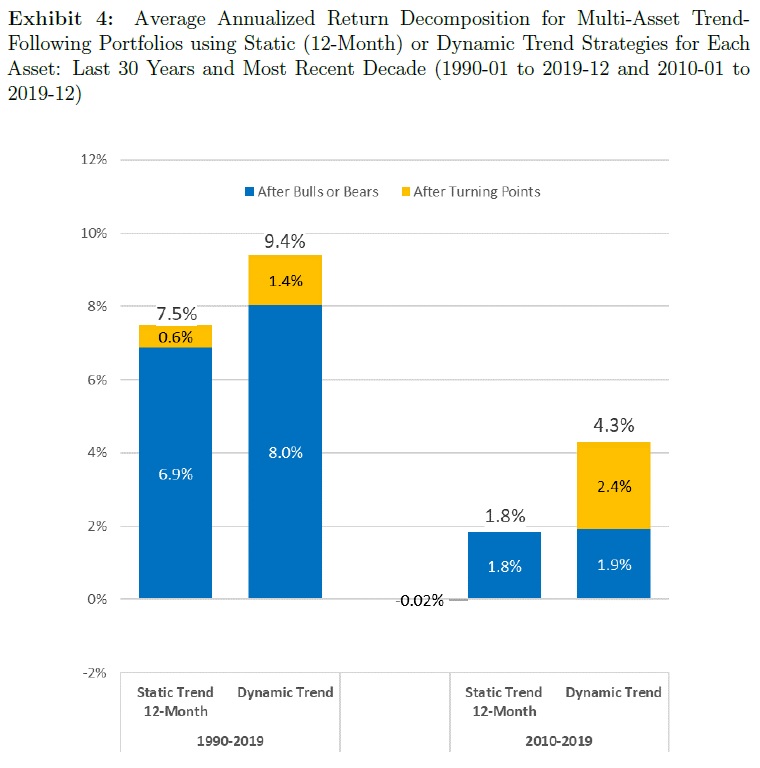
In Exhibit 4, we compare the annualized monthly returns of this multi-asset dynamic trend portfolio alongside the 12-month static multi-asset trend portfolio, with each portfolio normalized to have 10% volatility over the stated sample periods. Exhibit 4 also shows the decomposition of these returns into returns following Bulls or Bears and returns following turning points, Corrections or Rebounds. Multi-asset static trend generates approximately 7.5% annualized average return over the 30-year evaluation
period, yet only 1.8% in the most recent decade. Moreover, the vast majority of the returns to the multi-asset static trend portfolio in either evaluation period can be attributed to months after Bull or Bear phases. In contrast, the multi-asset dynamic trend portfolio not only generates returns after Bull or Bear phases in similar magnitude to the static strategy, but also generates returns in months after turning points. Average returns of both static and dynamic methods have decreased in recent years; however, dynamic trend generates a 4.3% average return in the recent decade, which is more than double the 1.8% generated by static trend. Moreover, the bulk of those gains are from returns harvested after turning points.”
Are you looking for more strategies to read about? Sign up for our newsletter or visit our Blog or Screener.
Do you want to learn more about Quantpedia Premium service? Check how Quantpedia works, our mission and Premium pricing offer.
Do you want to learn more about Quantpedia Pro service? Check its description, watch videos, review reporting capabilities and visit our pricing offer.
Do you want algorithmic access to the full Quantpedia database via the API? Subscribe to Quantpedia Pro, ask for an API key, and explore the in/out-of-sample statistics, source academic papers, and code snippets — ideal for quantitative research, systematic trading workflows, and AI model training.
Are you looking for historical data or backtesting platforms? Check our list of Algo Trading Discounts.
Or follow us on:
Facebook Group, Facebook Page, Telegram, Twitter, Linkedin, Medium or Youtube
Share onLinkedInTwitterFacebookRefer to a friend


