What’s the FED Perspective on Inflation Surprises and Equity Returns
The period of high inflation in the 1970s prompted researchers to carefully examine the relationship between inflation and stock returns and to look for ways to avoid unexpected inflation. The year 2022 brought back inflationary pressures to the U.S. economy not seen in more than 40 years, and this has spurred new efforts to answer long-standing questions about inflation and asset prices. Authors from the Board of Governors of the Federal Reserve System (2023) bring a fresh perspective on this topic, and their paper allows us to get a FED insider’s view on the ageless question of how inflation affects equity returns.
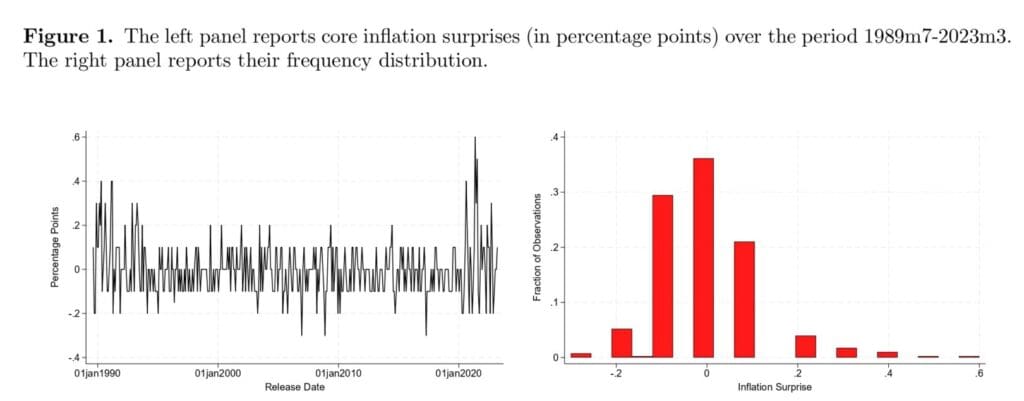
Authors contribute to this latest effort by examining the stock price response to inflation surprises around the timing of inflation announcements for a large group of publicly traded U.S. companies. The original approach is that in contrast with the majority of previous studies, which focus on core inflation, they focus rather than headline inflation because (i) core inflation is not affected by the volatile price behavior of food and energy items, and (ii) core inflation seems to be more relevant for monetary policy decisions.
Using a large cross-section of U.S. publicly traded firms and their corresponding close-to-open returns around inflation announcements, they found that the average U.S. public company’s reaction to core inflation surprises is significantly negative. This moderate response varies over time and becomes stronger (i.e., more negative) when inflation expectations and the output gap are above their long-run targets, thus highlighting a monetary policy expectation channel as an important driver of these findings.
In addition, they identify five firm-level characteristics that significantly affect the propagation of inflation surprises in the cross-section of equity returns: net leverage, markup, market capitalization, book-to-market, and CAPM beta. As from our last blog post, we would leave a little tidbit for practitioners who would love to adopt some of the insights from the paper. These characteristics can be used to identify inflation-sensitive and inflation-insensitive firms and construct risk-adjusted excess returns (Inflation-Based Spread) that could be potentially used to hedge against inflation surprises.
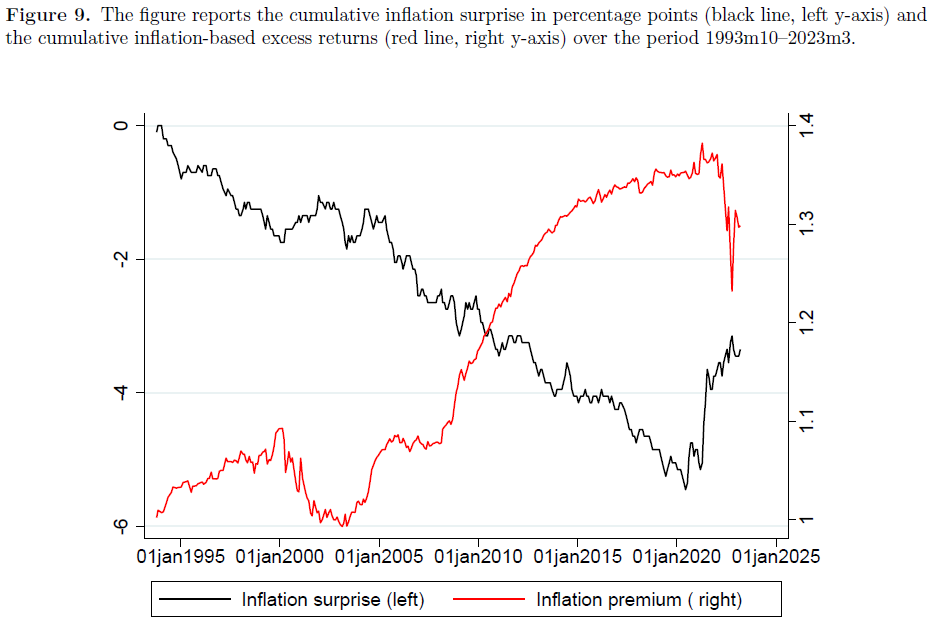
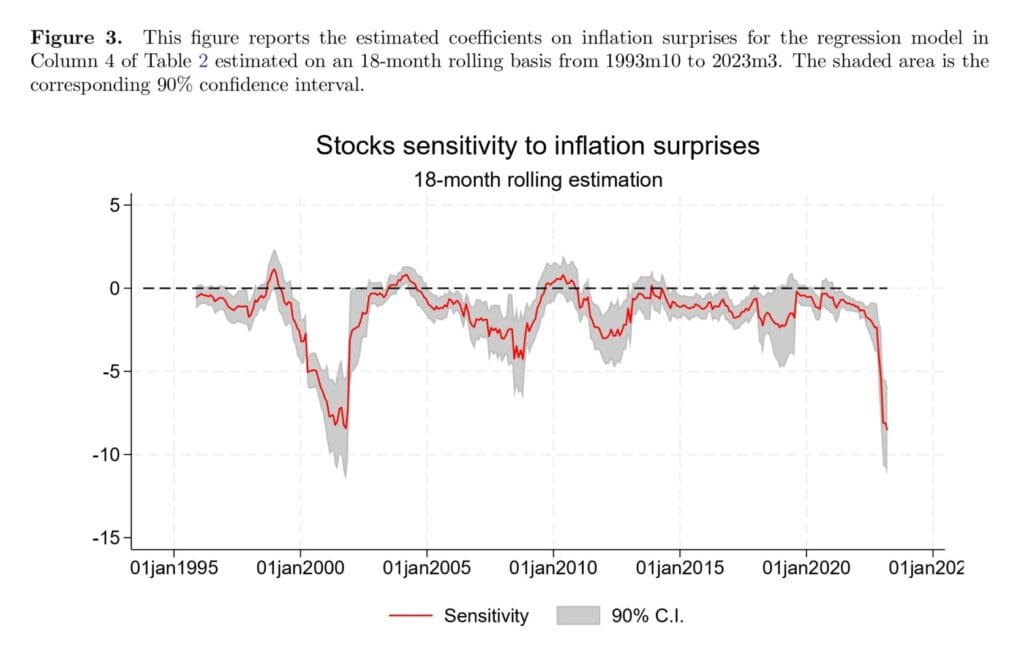
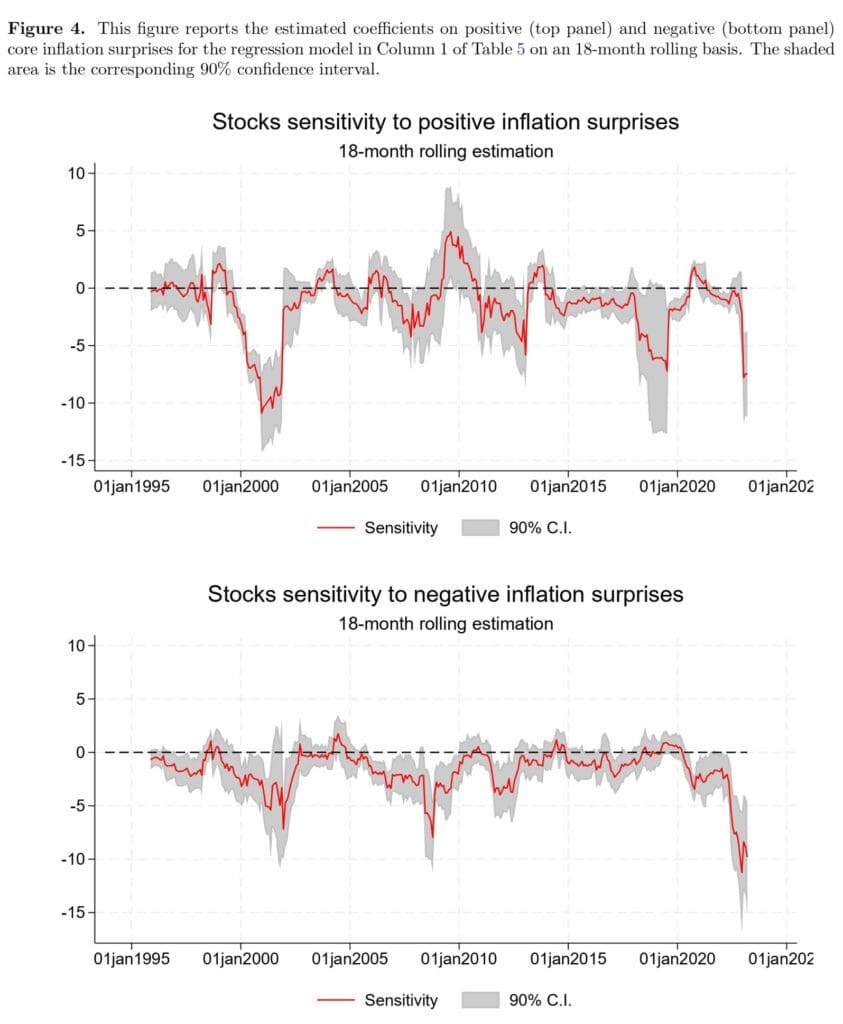
From plenty of figures and data in tables, we highlight Figure 9 which shows the cumulative performance of the inflation surprise factor, and the Figure 4, which shows stocks sensitivity to positive inflation surprises, together with the corresponding 90% confidence interval on an 18-month rolling basis.
Authors: Antonio Gil de Rubio Cruz, Emilio Osambela, Berardino Palazzo, Francisco Palomino, and Gustavo Suarez
Title: Inflation Surprises and Equity Returns
Link: https://papers.ssrn.com/sol3/papers.cfm?abstract_id=4280699
Abstract:
U.S. stocks’ response to inflation surprises is, on average, robustly negative and shows pronounced time-series variability. Consistent with a view that stock prices respond to inflation surprises that affect the monetary policy stance, we document the largest stock market sensitivity during periods when inflation expectations and the output gap are running high. During these periods, firms with low net leverage, large market capitalization, high market beta, low book-to-market, and low markups are especially susceptible to inflation surprises.
And; As always, we present several interesting figures and tables:
Notable quotations from the academic research paper:
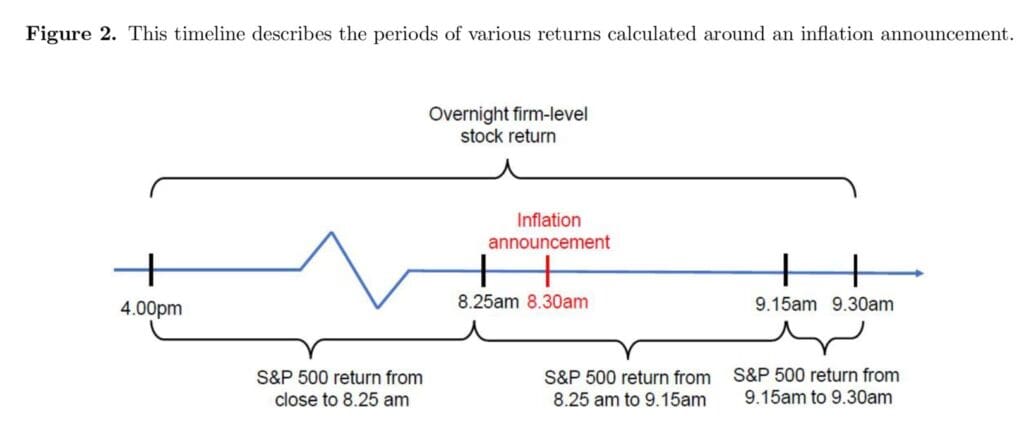
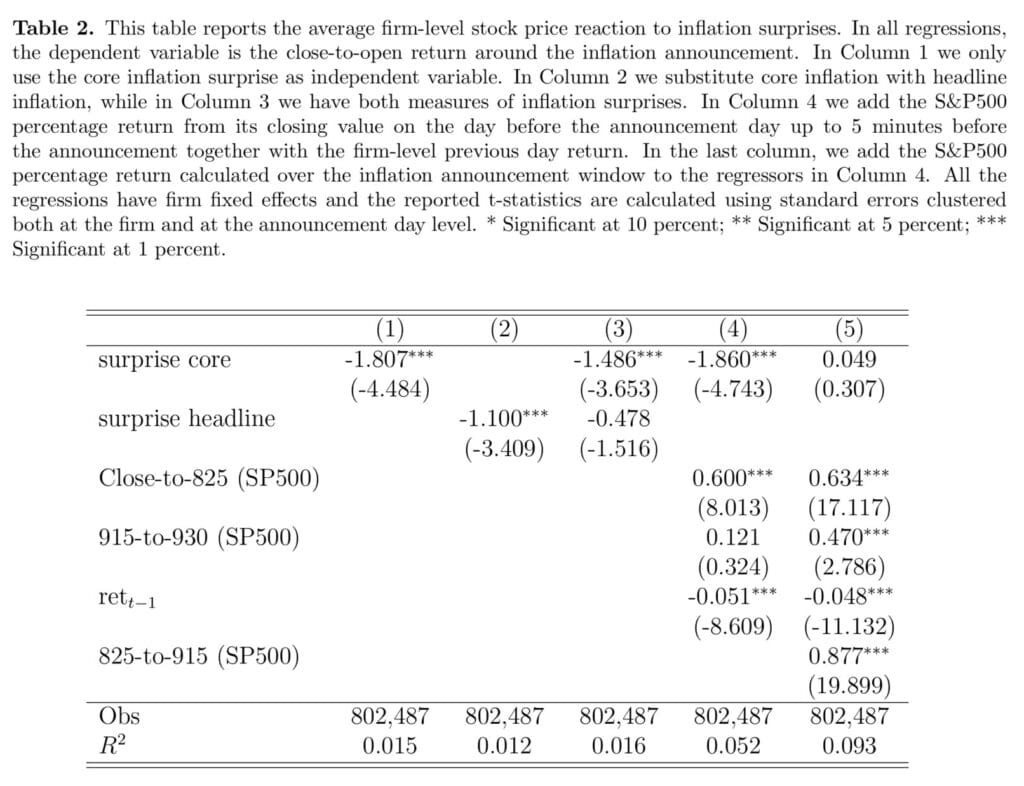
“The first part of our analysis addresses the question: When do inflation surprises matter for stock returns? To answer this question, we use our large panel of U.S. publicly traded firms to study the average response of equity prices to inflation surprises by regressing close-to-open equity returns on inflation surprises. Admittedly, close-to-open equity returns are not ideal for high-frequency identification purposes since they are very likely polluted by other systematic news like earnings announcements, news from abroad, or any other systematic news that is revealed when U.S. equity markets are closed. To mitigate this concern, we use S&P500 futures to calculate a market-wide equity return outside a narrowly defined inflation announcement window. Specifically, we include in our regression the market return from closing to 8.25am and from 9.15am to market opening on the announcement day. In this way, all systematic news outside our inflation announcement window (8.25am-9.15am) is accounted for.
We start by showing that the average stock price response to inflation surprises is robustly negative over our 1993-2023 sample. For each 0.1 percentage-point surprise in month-on-month core inflation, stock prices, on average, decline about 0.18%. We also show that (i) headline inflation surprises do not matter when core inflation surprises are controlled for, (ii) that the stock price reaction is confined at opening and no significant residual response is detected in the first 5 minutes of market trading or in the rest of the trading day, and (iii) that the response of stocks is robustly negative across a series of broadly defined industries and it is weaker in absolute value for industries in which price adjustments are more frequent.
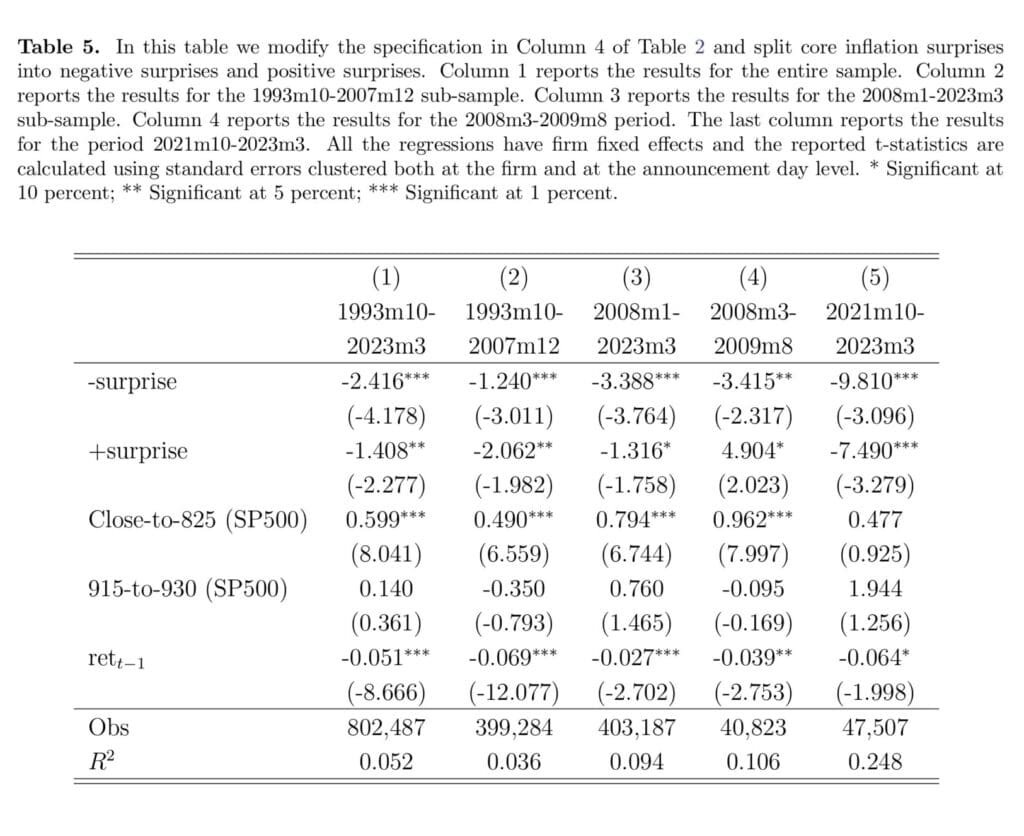
Next, we document substantial time variation in the average stock price response to inflation surprises. In particular, when we split the core inflation surprise into negative and positive surprises we find that the response to negative inflation surprises fluctuates relatively less over time than the response to positive inflation surprises. The latter varies dramatically over time and it becomes positive at various junctures in our sample, usually around recessionary periods. This finding is in accordance with the view that positive inflation shocks are good news during bad economic times since they might signal an economic recovery (e.g., Knif, Kolari, and Pynn¨onen (2008)).
During the recent monetary policy tightening cycle, which started in March 2022, equity prices had, on average, the largest sensitivity in our sample to both positive and negative inflation surprises. This is to be expected when inflation surprises are closely associated with movements in monetary policy expectations.3 For example, a positive inflation surprise can move market expectations toward a more aggressive policy rate tightening, which has a negative effect on stock prices via both a discount rate and an expected cash flows channel. […]
In the second part of the paper, we take advantage of the large cross-section of firms to answers the following question: Which stocks react more when the stock market is particularly susceptible to inflation surprises? We look for the answer by interacting the inflation surprise measure with a battery of characteristics and contemporaneously control for announcement day fixed effects, thus removing any systematic news that might affect stock returns on a particular announcement day. The estimated coefficient on the interaction terms tells us how much more (or less) stocks react to inflation surprises depending on a given characteristic.
We find that net leverage, markups, market capitalization (size), book-to-market, and market beta significantly affect how individual stocks respond to unexpected inflation and their estimated signs are consistent with what has been documented separately in previous studies. Following a positive inflation shock, firms with high net leverage, high book-to-market, and high markups experience a milder decline in their stock prices, while large firms and firms with a high CAPM beta suffer a stronger decline. The significance of these results does not change much (i) if we split the sample in pre- and post-Global Financial Crisis or (ii) if we look at small and large stocks separately.
Table 2 reports the results of our baseline analysis. All the regressions have firm fixed effects and the reported t-statistics are calculated using standard errors clustered both at the firm and at the announcement day level. We restrict the sample to days when intraday S&P500 futures data are available to facilitate the comparison across the different specifications. In Column 1, we report the unconditional response of the firm-level overnight returns to inflation surprises. The estimated coefficient is negative and strongly significant, implying that stock returns fall, on average, by about 0.18% following a 0.1 percentage point positive core inflation surprise (roughly a 1-standard deviation surprise).”
Are you looking for more strategies to read about? Sign up for our newsletter or visit our Blog or Screener.
Do you want to learn more about Quantpedia Premium service? Check how Quantpedia works, our mission and Premium pricing offer.
Do you want to learn more about Quantpedia Pro service? Check its description, watch videos, review reporting capabilities and visit our pricing offer.
Do you want algorithmic access to the full Quantpedia database via the API? Subscribe to Quantpedia Pro, ask for an API key, and explore the in/out-of-sample statistics, source academic papers, and code snippets — ideal for quantitative research, systematic trading workflows, and AI model training.
Are you looking for historical data or backtesting platforms? Check our list of Algo Trading Discounts.
Or follow us on:
Facebook Group, Facebook Page, Telegram, Twitter, Linkedin, Medium or Youtube
Share onLinkedInTwitterFacebookRefer to a friend


