Which Alternative Risk Premia Strategies Works as Diversifiers?
In the ever-evolving world of finance, the quest for stable returns and risk mitigation remains paramount. Traditional asset classes, such as stocks and bonds, have long been the cornerstone of investment portfolios, but their inherent volatilities and susceptibilities to market fluctuations necessitate a more diversified approach. Enter the domain of alternative risk premia (ARP) – strategies designed to capture returns from diverse sources of risk, often orthogonal to traditional market risks. Our exploration in this blog post delves deep into this subject, shedding light on which ARP strategies can truly serve as robust diversifiers in the complex financial tapestry.
A novel paper by Suhonen and Vatanen (2023) examined the risks and diversification properties of multi-asset alternative risk premia [ARP] strategies using a novel database of ARP factors. Encouragingly, they found that the factors derived from investment strategies offered by global investment banks using dimensionality-reducing methods are consistent with those composites used in previous related research. Hence, the factors may offer a possible solution to the “data dilemma” in risk premia analysis (as discussed in Gorman and Fabozzi 2022b.)
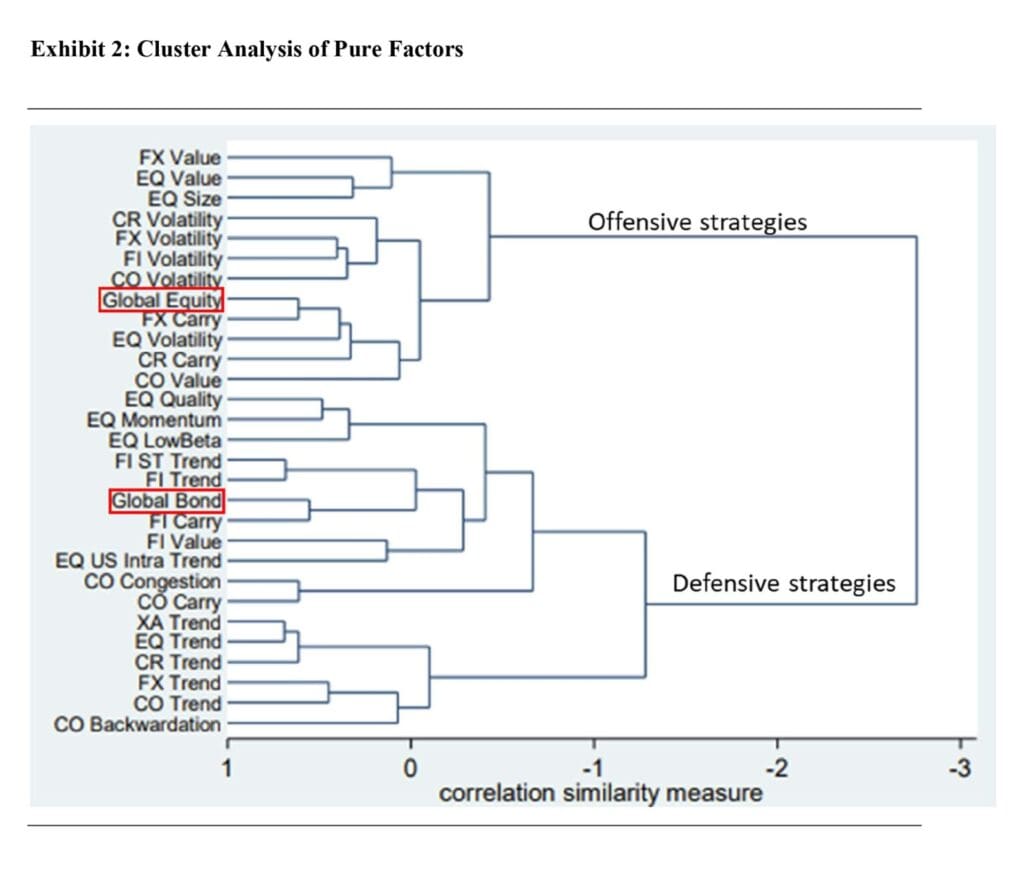
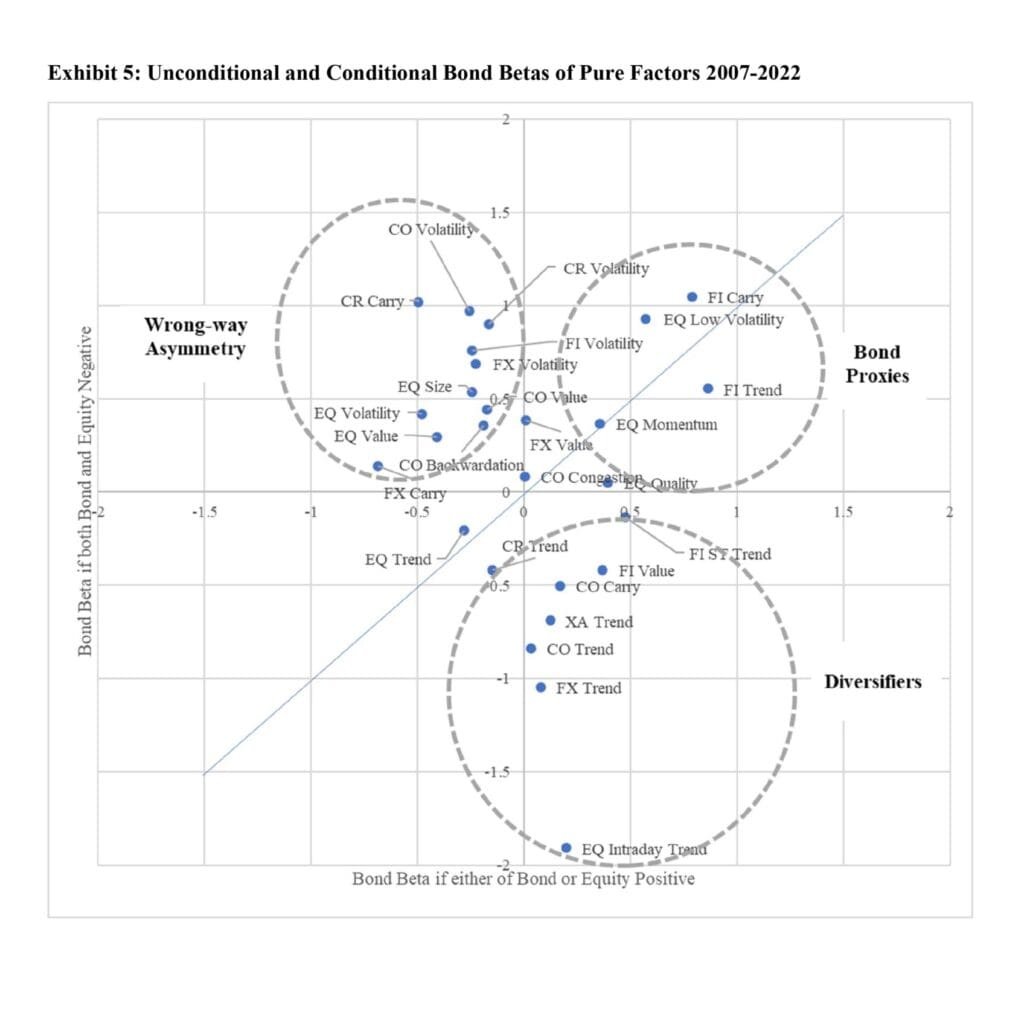
In the first place, we would love to highlight Exhibit 2, which presents a cluster analysis of 27 Pure Factors and a Global Equity and Global Bond benchmark (MSCI World and Bloomberg Barclays Global Treasury Index, respectively). Exhibit 5 stresses that most of the trend strategies have positive convexity in the bond beta. The ultimate conclusion is that macro trend strategies appear promising candidates for portfolio diversification during bond market draw-downs.
The strategies fall broadly into offensive and defensive categories based on their equity market risk but differ in their exposures to the bond market. For several strategies, sensitivities to traditional assets change materially during market draw-downs, especially for bond market exposure. Trend strategies and the commodity cluster appear to be the most promising candidates for portfolio diversification as their bond betas generally reduce during bond selloffs.
Authors: Antti Suhonen and Kari Vatanen
Title: Does Alternative Risk Premia Diversify? New Evidence for the Post-Pandemic Era
Link: https://papers.ssrn.com/sol3/papers.cfm?abstract_id=4459574
Abstract:
We examine the risks and diversification properties of multi-asset alternative risk premia (“ARP”) strategies using a novel data set based on investable ARP products. We first show based on a natural experiment that despite differences in scope and methodology, our data is consistent with historical evidence from alternative ARP benchmarks. The strategies fall broadly into offensive and defensive categories based on their equity market risk, but differ in their exposures to the bond market. For several strategies, sensitivities to traditional assets change materially during market drawdowns, especially for bond market exposure. Trend strategies and the commodity cluster appear as the most promising candidates for portfolio diversification as their bond betas generally reduce during bond selloffs. Furthermore, we present novel findings on ARP performance links to real rates and breakeven inflation changes. Our results underscore the need to analyze ARP strategies beyond linear and unconditional correlation measures.
As always, we present several interesting figures and tables:
Notable quotations from the academic research paper:
“We analyze a family of 27 PremiaLab “Pure Factors” spanning five asset classes and ten high-level ARP styles. The Pure Factors are derived from the performance of a broad universe of ARP strategies promoted by global investment banks using dimensionality-reducing techniques. We show that despite the fundamental differences in construction, the distributional properties of Pure Factors share much commonality with the corresponding composite benchmarks of Vatanen and Suhonen (2019) during their overlapping history from 2007 to May 2018.
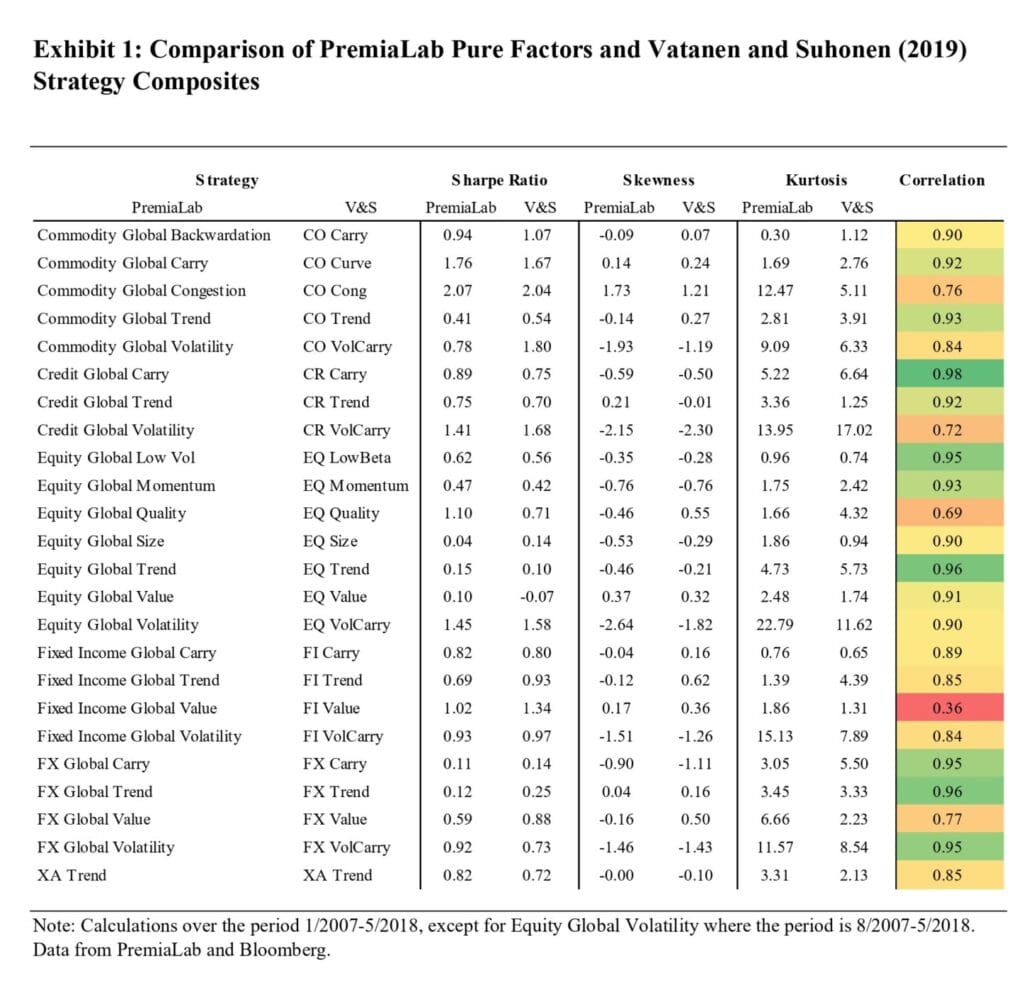
We test the consistency of the PremiaLab Pure Factors with a composite benchmark in a natural experiment. We compare the distributional properties and correlation of the Pure Factors against the composite ARP portfolios presented in Vatanen and Suhonen (2019) over a timeframe from January 2007 to May 2018 (the period of analysis in their study.) Exhibit 1 shows the Sharpe ratio, skewness, and excess kurtosis of the PremiaLab and Vatanen and Suhonen (2019) composites, as well as the correlation between the two series for each strategy. We are able to match 24 out of the 28 strategies in Vatanen and Suhonen (2019) with a corresponding PremiaLab Pure Factor4.
The Sharpe ratios of the Pure Factors and the composites are remarkably similar, differing on average by just -0.06 (median -0.00) across the 24 strategies. The largest deviations can be found in Commodity Volatility where the PremiaLab Pure Factor Sharpe ratio is under half of that of the composite, and Equity Quality, where the PremiaLab Pure Factor Sharpe ratio is 0.39 greater than that of the composite. The average difference in skewness is -0.20 (median – 0.14), and 1.03 (median 0.17) in excess kurtosis.
The correlations between the Pure Factor and composite series, reported in the final column of Exhibit 2, are 0.86 on average (median 0.90). The highest correlations are found for carry, trend, and volatility strategies as well as Equity Low Beta; these strategies typically rely on easily observable inputs and signals. On the other hand, the lowest correlations are recorded for value and Equity Quality strategies, and Credit Volatility. We test the uniformity of the distributions of the two data series formally using a Kolmogorov-Smirnov test on the 24 strategy pairs. The null hypothesis of similarity of distributions is rejected only for Commodity Volatility (at 99% level of significance), Credit Volatility (99%) and Equity Quality (95%). For the remaining 21 strategy pairs, the Kolmogorov-Smirnov test fails to reject the null of similar distributions.
The cluster analysis identifies two broad categories of strategies, the first exhibiting risk-on i.e. offensive characteristics and proximity to global equities, and the second having a more defensive profile with similarities to global bonds. The first group consists mainly of Carry and Volatility strategies, as well as value styles in equities, FX, and commodities. The second group comprises most fixed income and commodity strategies, defensive equity strategies (Low Volatility, Momentum, and Quality), as well as the Trend style. However, statistical properties of the Trend strategies differ from the bond-like strategies and they form a separate sub-cluster within the defensive strategies. Notably, the results of the cluster analysis are broadly similar to the analysis in Vatanen and Suhonen (2019) despite a different data source, benchmark methodology, and sample period.
All of the offensive or risk-on styles exhibit wrong-way asymmetry in the bond betas (betas increase during selloffs), and the effect is most pronounced for most of the Volatility factors as well as Credit and FX Carry. On the defensive side, Trend strategies, Fixed Income Value, and Commodity Carry show substantial positive convexity in the bond betas, whereas for Equity Low Volatility and Commodity Value the convexity is negative. We illustrate the effect further in Exhibit 5 that plots the bond betas of the Pure Factors when either or both of bond and equity returns is non-negative (x-axis) versus the beta when both bond and equity returns are negative (on the y-axis.) The asymmetric behavior of returns of the Pure Factors can be described with three different groups. Strategies whose beta to bonds turn from negative to positive during combined bond and equity market selloffs have a wrong-way asymmetry from the perspective of portfolio diversification. Strategies that maintain positive beta to bonds during the selloffs act as “bond proxies” from a risk standpoint. Finally, strategies whose beta turn from positive to negative are possible candidates for portfolio diversification during the joint selloffs.
Our analysis of Pure Factors repeats the results of Vatanen and Suhonen (2019) by showing that the risk characteristics of the most ARP strategies change in the tails of equity and bond market return distributions. As a consequence, linear and unconditional correlation measures and betas are not accurate or fully informative of portfolio behavior during large market drawdowns. Instead, possible diversification and hedging properties of the strategies should be evaluated in the different conditional market events.
We have shown that most ARP strategies do not diversify an equity-bond portfolio during drawdowns, and some strategies have significant wrong-way asymmetry in their traditional asset betas. On the positive side, there are strategies that can diversify and even hedge the portfolio in the events where both equity and bond markets returns are negative. Macro Trend and Equity Quality strategies, as well as the long/short strategies on the commodity term structures have worked best in our data sample.
In common with most studies of risk premia strategies, the Pure Factors reflect both live and backtested performance of the underlying investment bank indices. We would estimate that data prior to circa 2015 is mostly backtested, and consequently two particular caveats are in order. First, as previously noted, results from the 2007-9 period rely mainly on hypothetical returns which might be embellished by overfitted algorithms seeking to improve the simulated performance during the GFC. Second, the Equity Intraday Trend factor that exhibits strong diversification characteristics is based on strategies that were mostly launched in 2019-2020 to specifically address the lack of diversification benefits in more established ARP strategies, and consequently the results from prior years should be interpreted with caution.”
Are you looking for more strategies to read about? Sign up for our newsletter or visit our Blog or Screener.
Do you want to learn more about Quantpedia Premium service? Check how Quantpedia works, our mission and Premium pricing offer.
Do you want to learn more about Quantpedia Pro service? Check its description, watch videos, review reporting capabilities and visit our pricing offer.
Do you want algorithmic access to the full Quantpedia database via the API? Subscribe to Quantpedia Pro, ask for an API key, and explore the in/out-of-sample statistics, source academic papers, and code snippets — ideal for quantitative research, systematic trading workflows, and AI model training.
Are you looking for historical data or backtesting platforms? Check our list of Algo Trading Discounts.
Or follow us on:
Facebook Group, Facebook Page, Telegram, Twitter, Linkedin, Medium or Youtube
Share onLinkedInTwitterFacebookRefer to a friend


