Which Stock Return Predictors Reflect Mispricing and Which Risk-Premia?
The degree of stock market efficiency is a fundamental question of finance with considerable implications for the efficiency of capital allocation and, hence, the real economy. Return predictability is a cornerstone that allows investors to estimate their returns with ranging precision. Some anomalies allow one to exploit loopholes in global markets and capture substantial alpha, which violates the Efficient Market Hypothesis (EMH). However, whether this alpha arrives from risk premia or its source is mispricing is still puzzling academics around the globe, and they wrap their head around solving these tricky question.
In his paper, Jonas Frey (2023) takes on the challenge of determining whether some well-known stock predictors represent mispricing or risk. The overall results suggest that for at least 40% of them, the predictable excess returns align with predictable changes in future earnings expectations, suggesting that they are at least partially driven by mispricing. The analysis does not capture mispricings stemming from biased beliefs about future required returns or market frictions and uses an imperfect proxy for the market’s future earnings expectations; the actual share of mispricings among the predictors is likely even higher.
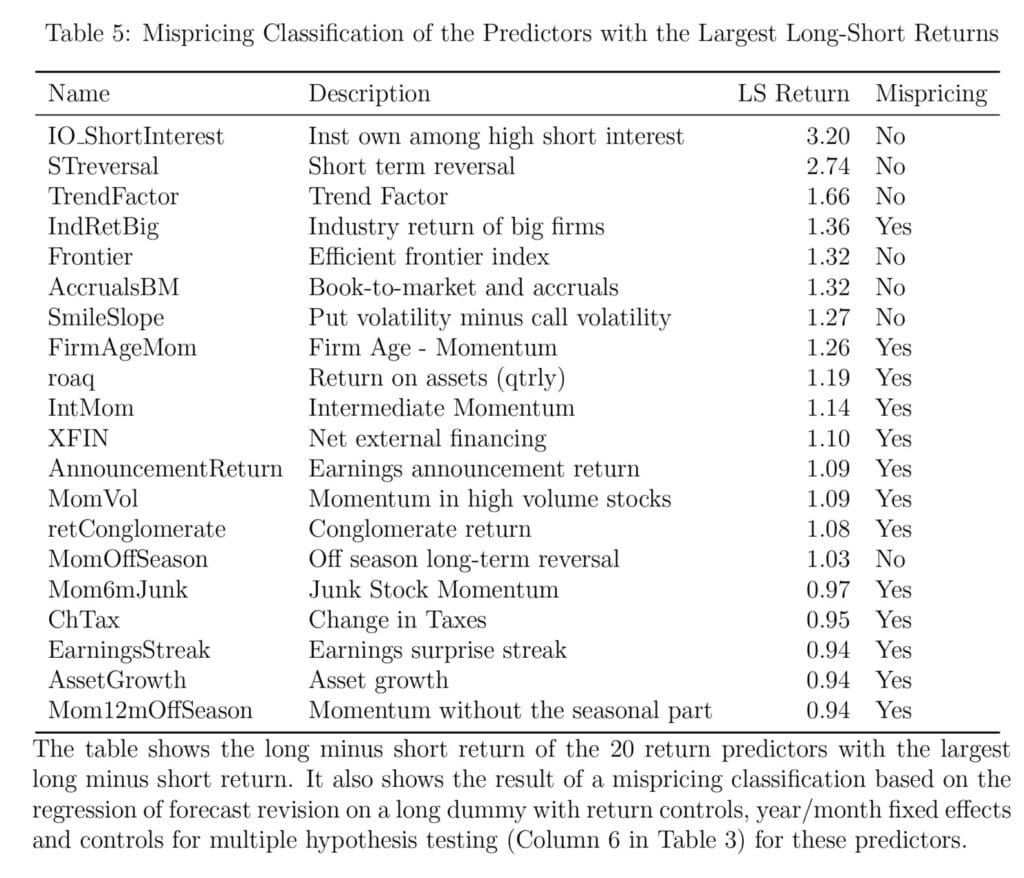
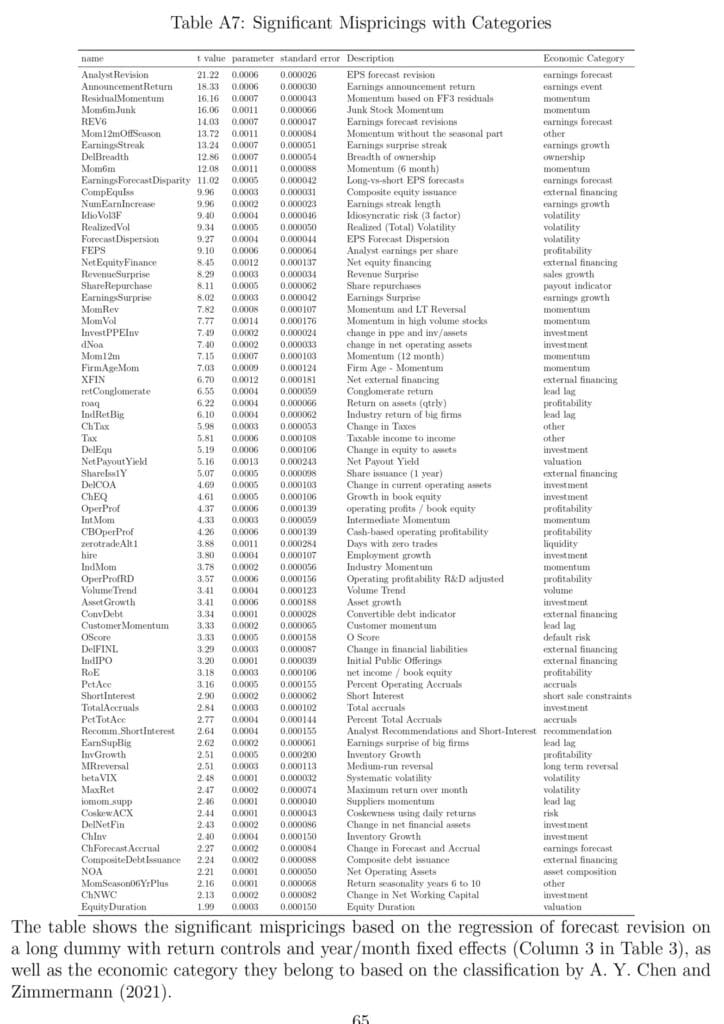
An individual-level overview of all mispricing predictors can be found in Table A7 in Appendix D. 172 out of the 212 predictors (commonly used predictors such as momentum, profitability, and investment) were found to be statically significant. Table 5 shows the mispricing classification of the 20 predictors with the largest long-minus-short returns and may even be used to build simple HML (high minus low, classic long-short spread) portfolio strategies.
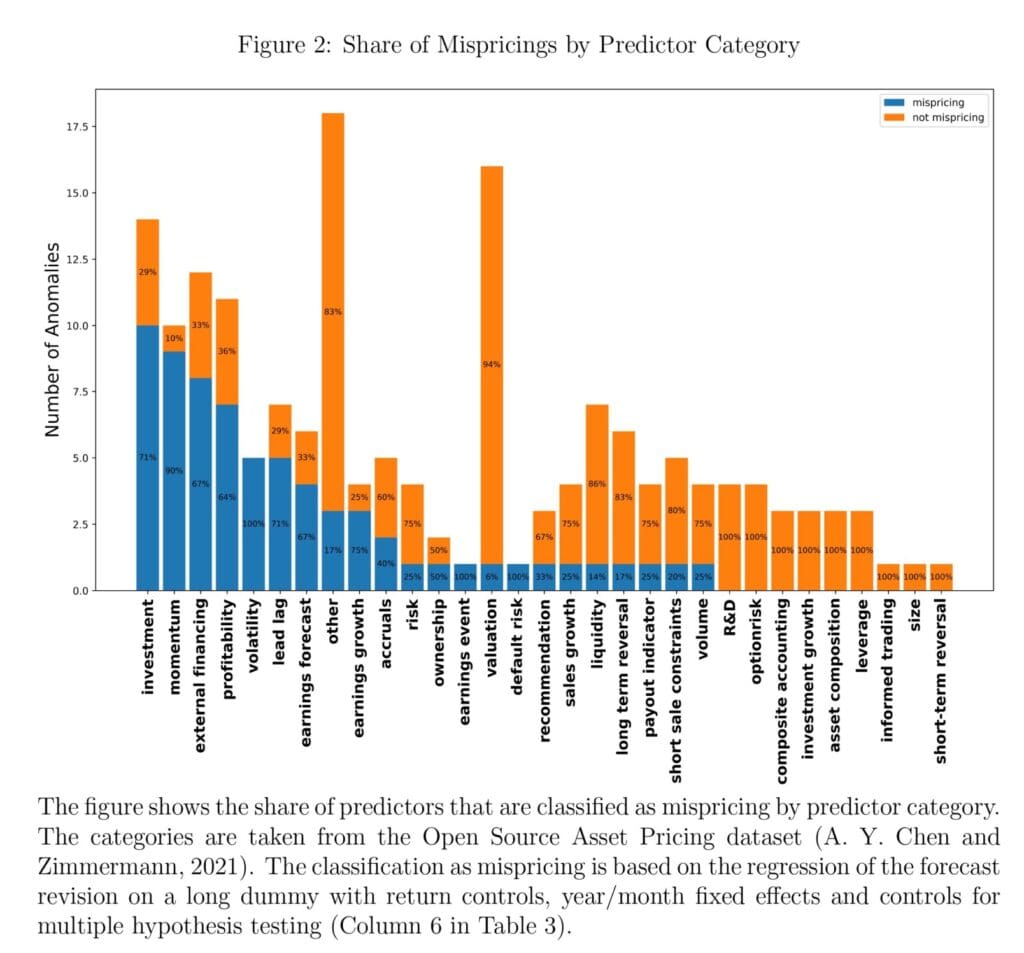
Moreover, the results suggest that the excess returns of some predictors capture the build-up rather than the resolution of mispricing, implying that traders who capitalize on these predictors worsen rather than correct mispricing. We would also love to highlight Figure 2, which shows the share of mispricing predictors in each category using the regression specification that controls for return, includes fixed effects, and controls the false discovery rate (Column 6 in Table 3). Overall, the results suggest that the ample evidence for predictability of the cross-section of returns does not just mean that existing asset pricing models have not yet incorporated all relevant risk factors but that there is widespread mispricing in the stock market.
Authors: Jonas Frey
Title: Which Stock Return Predictors Reflect Mispricing?
Link: https://papers.ssrn.com/sol3/papers.cfm?abstract_id=4584121
Abstract:
A large number of stock characteristics have been found to predict the cross-section of returns. Return predictability can be driven by risk or mispricing, and the nature of most return predictors remains an open question. I use analysts’ earnings forecasts to determine if a return predictor is linked to mispricing. I find that at least 40% of return predictors from a dataset of 172 significant predictors are related to mispricing, including the momentum predictor from the Carhart four-factor and the profitability and investment predictors from the Fama–French five-factor model. I further study whether the mispricing predictors’ abnormal returns capture the divergence of prices from the fundamental value (build-up predictors) or their convergence back to the fundamental value resolution predictors). Build-up predictors are less common than resolution predictors but they do exist, implying that trading on certain return predictors can exacerbate rather than eliminate mispricing. Momentum is related both to the build-up and the resolution of mispricing.
And, as always, we present several interesting figures and tables:
Notable quotations from the academic research paper:
“For my test, I use the earnings forecast of professional analysts as a proxy for the market’s dividend expectations1. Given the argument above, I can say that a return predictor is a mispricing predictor (henceforth also called a “mispricing”) if it also predicts more positive earnings forecast revisions for the stocks for which it predicts more positive returns. In principle, a link between a return predictor and biased expectations could stem from behavioural biases or information processing frictions. However, since the predictors use simple portfolio sorts based on widely available data, it is unlikely that frictions prevent market participants from incorporating the predictor’s information into the price.
My test provides four crucial insights by identifying the return predictors that are associated with biased expectations, which are a subset of all return predictors linked to mispricing. (. . .)
First, mispricing of any kind is evidence of market inefficiency, whereas return predictability from risk is not. Thus, my test provides a lower bound on the share of return predictability stemming from mispricing. Understanding how much mispricing exists in the market is crucial because prices determine capital allocation and can thus affect the real economy.
Second, mispricing-driven return predictors should only be used in descriptive asset pricing models and should not be used normatively, such as to calculate risk-adjusted returns.
Third, mispricing predictors whose returns are at least partially driven by biased expectations suggest profitable trading strategies, which is not the case for risk or mispricing from frictions. Therefore, the fact that my test only captures mispricing related to biased expectations and not friction-driven mispricing can be seen as an advantage.
Finally, mispricing from biased expectations can be eliminated through trading once arbitrageurs become aware of it, whereas return predictability from risk or market frictions should be persistent.
In summary, given the key differences between risk-driven and the various types of mispricing-driven return predictors, we arguably learn very little from knowing about the existence of a return predictor if we do not understand its nature. Establishing the nature of a predictor is challenging because predictor discovery is mainly driven by empirical research, and it is difficult to establish a predictor’s nature from the return distribution without an economic model (Kozak et al., 2018). Therefore, considerable disagreement about the nature of most predictors remains in the literature (see Holcblat et al., 2022, for a review) and arguably the CAPM market factor (Lintner, 1965; Sharpe, 1964) is the only predictor that is universally accepted to represent risk and not mispricing. Thus, it is crucial to develop portable empirical tests that can help understand if a given return predictor is driven by risk or mispricing.
Applying my mispricing test to these 172 predictors, I find that around 40% of them also predict earnings forecast revisions and are hence linked to mispricing. Importantly, my test cannot rule out that a predictor is also associated with risk in addition to being linked to mispricing.
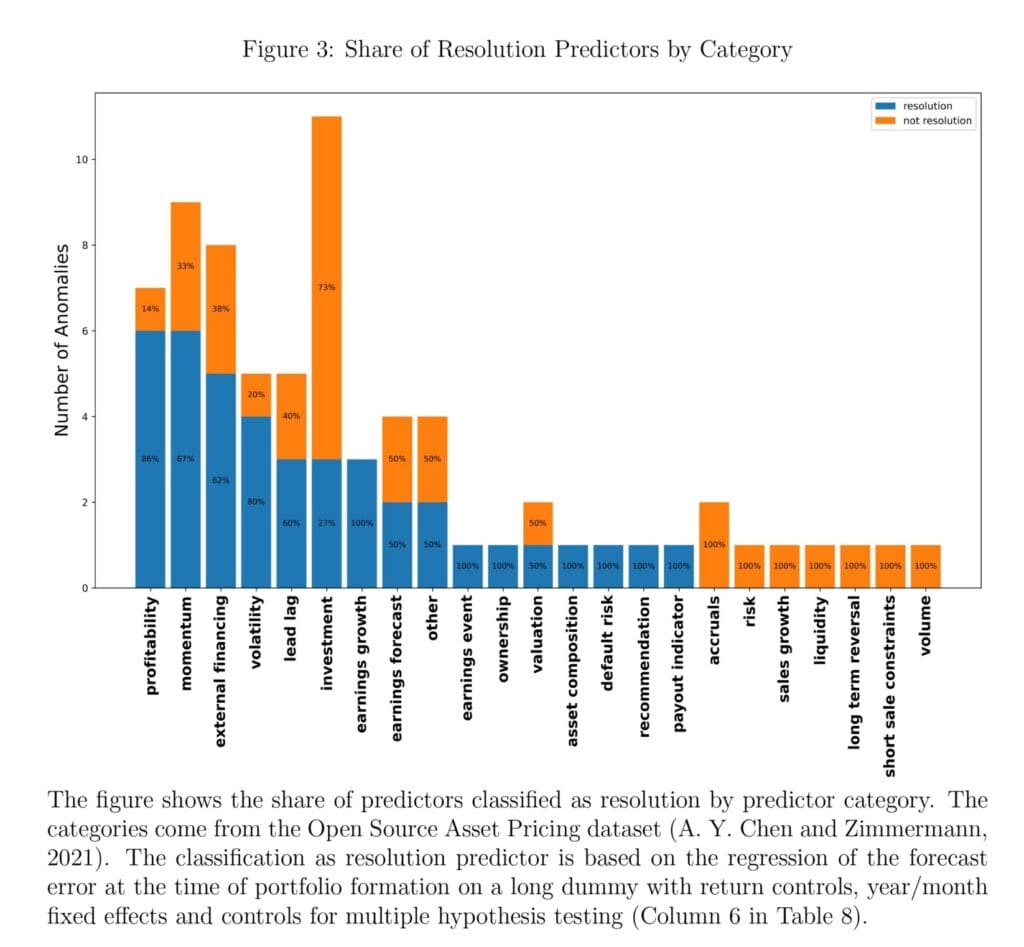
Reassuringly, a large fraction of lead-lag predictors, which are supposed to capture delayed reactions to news is classified as mispricing.
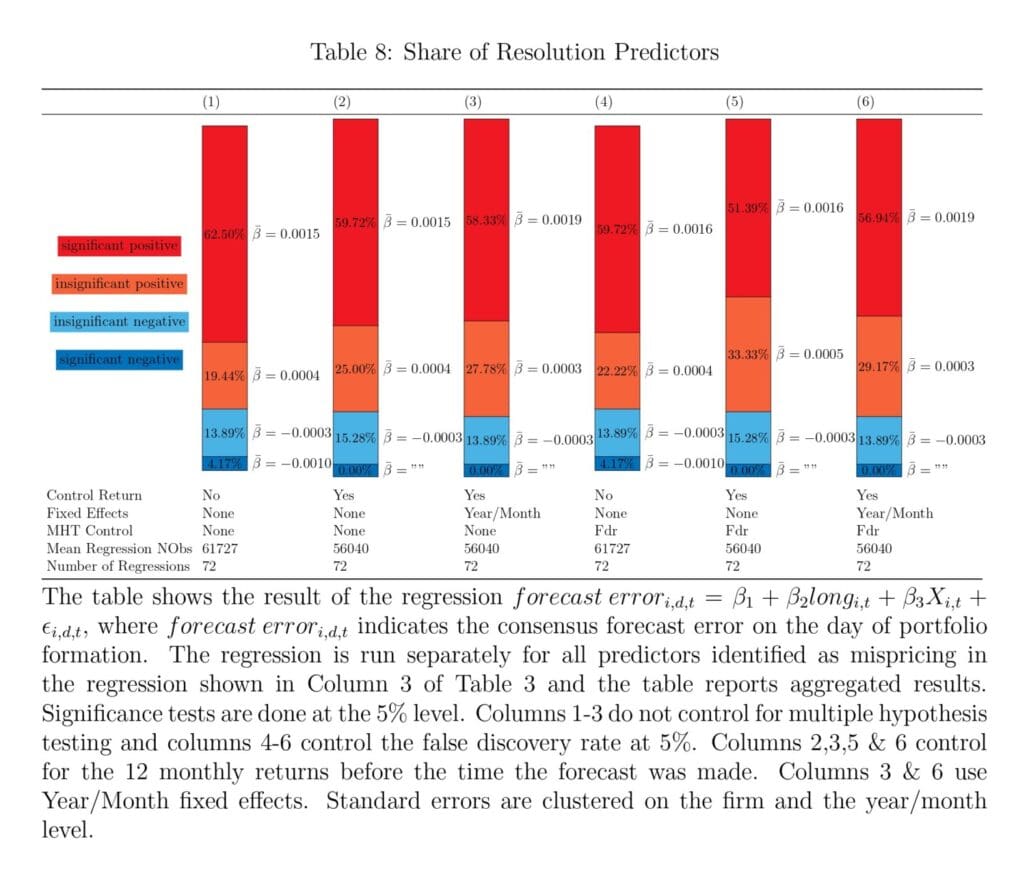
Table 8 shows the results of a regression of forecast error on the day of portfolio formation on the long dummy. A positive long dummy indicates that analysts are more pessimistic about stocks in the long portfolio, which is predicted for resolution predictors. I find that, in my preferred specification (6), in which I control for the return, include year/month fixed effects and adjust for multiple hypothesis testing, 56.94% of mispricings are classified as resolution. All other specifications have broadly similar results.”
Are you looking for more strategies to read about? Sign up for our newsletter or visit our Blog or Screener.
Do you want to learn more about Quantpedia Premium service? Check how Quantpedia works, our mission and Premium pricing offer.
Do you want to learn more about Quantpedia Pro service? Check its description, watch videos, review reporting capabilities and visit our pricing offer.
Do you want algorithmic access to the full Quantpedia database via the API? Subscribe to Quantpedia Pro, ask for an API key, and explore the in/out-of-sample statistics, source academic papers, and code snippets — ideal for quantitative research, systematic trading workflows, and AI model training.
Are you looking for historical data or backtesting platforms? Check our list of Algo Trading Discounts.
Or follow us on:
Facebook Group, Facebook Page, Telegram, Twitter, Linkedin, Medium or Youtube
Share onLinkedInTwitterFacebookRefer to a friend


