Who Is the Counterparty to the Pro-Cyclical Investors
An interesting transaction-level study we take a closer look at today asks who takes the other side of trades when the most pro-cyclical players in markets — primarily asset managers — buy in booms and sell in busts. The paper uses comprehensive transaction data across major European equity and interest-rate cash and derivatives markets to classify counterparties by sector and to measure, at horizons from 15 minutes to one month, which sectors absorb net flows from pro-cyclical investors. The analysis tests a key idea from intermediary asset pricing that dealer intermediaries supply liquidity when demand-side investors trade pro-cyclically.
Dealer banks emerge as the dominant liquidity providers across asset classes. At intraday and daily horizons, dealer banks absorb the vast majority of the net flow coming from asset managers. Other active liquidity sources, such as principal trading firms and hedge funds, play only minor roles at daily frequency, absorbing roughly ten percent and five percent, respectively, of asset managers’ net flows. Long-horizon holders categorized as long-term investors tend to trade pro-cyclically as well, amplifying rather than offsetting shocks. The empirical evidence therefore supports the view that intermediaries, not contrarian institutional investors, predominantly clear the market when pro-cyclical demand hits the market.
The paper’s leading figures (see Figures 1, 2, and 3) document these patterns across markets and frequencies and quantify the magnitude and persistence of intermediary absorption. The findings have direct implications for liquidity risk and cross-asset transmission: when dealer balance sheets tighten, the natural counterparties that usually clear pro-cyclical flows retract, increasing price impact and amplifying market moves. These results link micro-level transaction data to broader asset-pricing mechanisms, showing that the intermediation role of dealer banks is central to understanding who buys in crashes and who sells in booms.
Authors: Johannes Beutel, Maik Schmeling, and Willy Scherrieble
Title: Who clears the market when pro-cyclical investors trade?
Link: https://papers.ssrn.com/sol3/papers.cfm?abstract_id=5559119
Abstract:
Limits of arbitrage can explain why hedge funds and other investors do not take large countercyclical positions in the aggregate equity market, but they leave open the question of who buys when markets crash and who sells during booms. We address this long-standing puzzle using transaction-level data on the universe of trades across major European equity and interest rate cash and derivatives markets. We classify investors into sectors and quantify, at horizons from 15 minutes to one month, which sectors absorb the net flows of the most pro-cyclical investors (asset managers). We find dealer banks are the dominant liquidity providers across markets. At daily frequency, they absorb nearly the entire net flow of asset managers, while principal trading firms and hedge funds absorb only about 10% and 5%, respectively. Long-term investors trade pro-cyclically, amplifying rather than offsetting flows. Our results provide direct evidence for the conjecture in the intermediary asset pricing literature that dealer banks are key liquidity providers across different asset classes.
As always, we present several interesting figures and tables:


Notable quotations from the academic research paper:
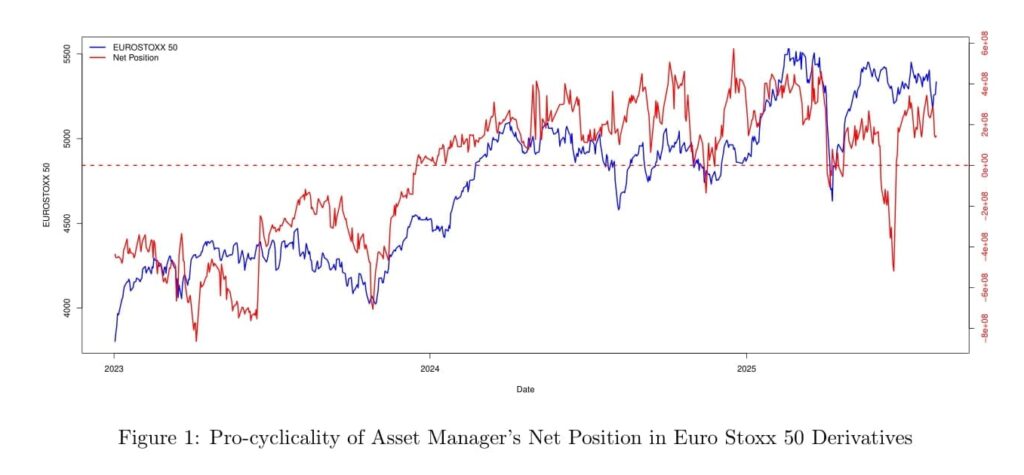
“As our baseline laboratory, we consider trading in Euro Stoxx 50 futures, a liquid instrument for institutional investors seeking to time the European equity market. We later extend our analysis to the equity cash market and to interest rate derivatives. Our novel transaction-level data allows us to observe the identity of all counterparties to all trades, which we group into sectors such as asset managers, hedge funds, dealer banks, long-term investors, principal trading firms, or households. We analyze the trading behavior of these sectors at different frequencies ranging from 15 minutes up to 1 month. In line with the existing literature, asset managers emerge as the most pro-cyclical sector. As illustrated in Figure 1 their net position co-moves closely with the price of the underlying asset. The question we want to answer is who is on the other side of these pro-cyclical trades.
Our main result is visualized in Figure 2, which shows the estimated βs coefficients for Euro Stoxx 50 futures at daily frequency. While long-term investors (pension funds, sovereign wealth funds, insurance) would have seemed a natural candidate to exploit arbitrage opportunities from price mis-alignments during periods in which asset managers are constrained by inflows or outflows, our estimates show this is not the case. Instead, their netbuy co-moves positively with asset managers’ trades, amplifying their pro-cyclical trades, by roughly 7 units, for every 100 units of asset manager netbuy. Another natural candidate for arbitrage could be hedge funds. Indeed, we do find a negative coefficient for hedge funds, but the quantitative magnitude is rather limited, implying that hedge funds absorb only roughly 5 percent of asset managers’ netbuy. The limited role for hedge funds in arbitraging the aggregate market is consistent with Brunnermeier and Nagel (2004) who show that during the dotcom period, hedge funds invested pro- cyclically (”riding the bubble”) instead of investing counter-cyclically (”performing arbitrage”) (see also Griffin, Harris, Shu, and Topaloglu 2011; Ben-David et al. 2012).
The role of dealer banks is similar across different asset classes. We observe the universe of all trades in the German stock market index DAX, which is the prime stock index for Europe’s biggest economy. Similar to the Euro Stoxx 50 futures and the DAX futures market, liquidity provision on the other side of asset manager’s trades in the equity cash market is dominated by dealer banks, whereas PTFs and hedge funds play a smaller role than in equity futures markets. By contrast, direct trades by households account for roughly 7 percent of the liquidity on the other side of asset manager’s trades in the equity cash market, while long-term investors continue to trade pro-cyclically. Dealer banks also have a dominant liquidity providing role in interest rate derivative markets, in particular we study trading in futures on German and Italian government bonds. The role of dealer banks, PTFs, and hedge funds is similar in these markets as in equity derivatives, while households’ liquidity provision is generally negligible in all of the derivatives markets we consider, likely owing to the larger complexity and potential risks of derivative as opposed to cash market positions. Our result that the role of dealer banks is similar across different asset classes, provides direct transaction-based evidence for the price-based findings by He et al. (2017)
We show dealer banks are the dominant liquidity providers across different markets. At daily frequency they absorb essentially the full net flow of asset managers, with principal trading firms (PTFs) supplying roughly 10% and hedge funds only roughly 5%. Long-term investors trades co-move with asset managers and therefore amplify pro-cyclicality rather than arbitrage it. Frequency matters: PTFs and hedge funds provide substantially more liquidity in intraday windows (e.g., 15-minute intervals), but their role fades at lower frequencies, where dealer banks become the dominant liquidity providers, also during periods of market stress and large negative returns. Cross-asset evidence reveals portfolio shifts between risky and safe-asset futures by asset managers and dealer banks. Our results provide direct evidence for the conjecture in the intermediary asset pricing literature that dealer banks are key liquidity providers across different asset classes (He et al., 2017). Conversely, the extent of arbitrage of other types of investors, such as hedge funds and long-term investors is comparably limited at the aggregate market level.”
Are you looking for more strategies to read about? Sign up for our newsletter or visit our Blog or Screener.
Do you want to learn more about Quantpedia Premium service? Check how Quantpedia works, our mission and Premium pricing offer.
Do you want to learn more about Quantpedia Pro service? Check its description, watch videos, review reporting capabilities and visit our pricing offer.
Are you looking for historical data or backtesting platforms? Check our list of Algo Trading Discounts.
Or follow us on:
Facebook Group, Facebook Page, Twitter, Linkedin, Medium or Youtube
Share onLinkedInTwitterFacebookRefer to a friend


