When Big Gets Small: Trading the Lower Tier of Large Caps and Upper Mid Caps
The growing dominance of passive investing has fundamentally altered the dynamics of equity markets. A substantial share of trading volume is now driven by index-tracking strategies, which mechanically allocate capital based on index membership rather than company-specific fundamentals. This raises an important question: can predictable flows associated with index rebalancing be systematically exploited?
In this article, we investigate the hypothesis that corporations at the lower end of the S&P 500 may be attractive candidates for short positions. Our underlying intuition is that companies facing potential exclusion from the index could experience a decline in demand for their shares, as passive investment vehicles are forced to divest upon their removal. Given the significant and growing role of passive capital, such forced selling could exert downward pressure on prices.
A key challenge, however, lies in the uncertainty surrounding index reconstitution. It is not possible to precisely identify which firms will be removed from the index or when such events will occur. As a result, any practical strategy must rely on observable characteristics that proxy for exclusion risk rather than exact predictions. In addition to this “deletion effect,” we also examine the opposite side of the process – firms that may be candidates for inclusion in the index. These companies could benefit from increased demand driven by passive inflows, potentially leading to positive price pressure. By jointly analyzing both potential deletions and additions, we aim to assess whether index membership dynamics can serve as a basis for a systematic long–short investment strategy.
Test of the original idea
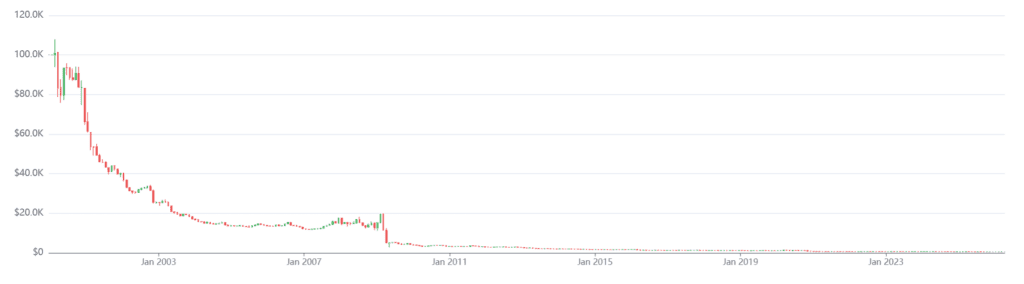
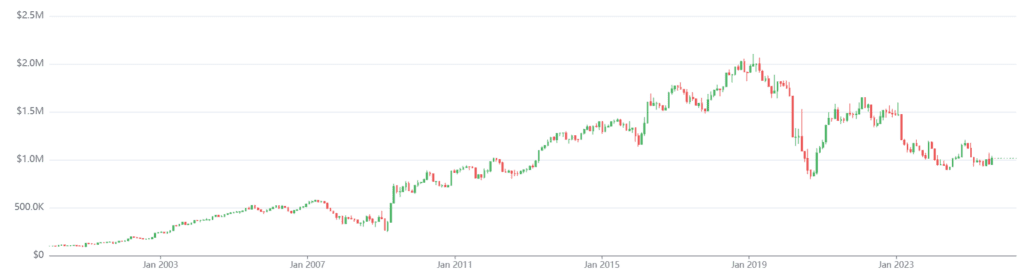
We begin by focusing on the analysis of this core idea in its simplest form. Using the QuantConnect framework, we construct a baseline strategy that systematically targets firms at the lower end of the S&P 500 by market capitalization. Specifically, at the end of each quarter, we take short positions in the 20 companies with the smallest market capitalization within the index.
The rationale behind this approach is that smaller constituents may be more vulnerable to exclusion from the index, and therefore more exposed to potential outflows from passive investment vehicles. By concentrating on this subset, we aim to capture the negative price pressure associated with anticipated deletions, even without precise knowledge of the timing or identity of such events.
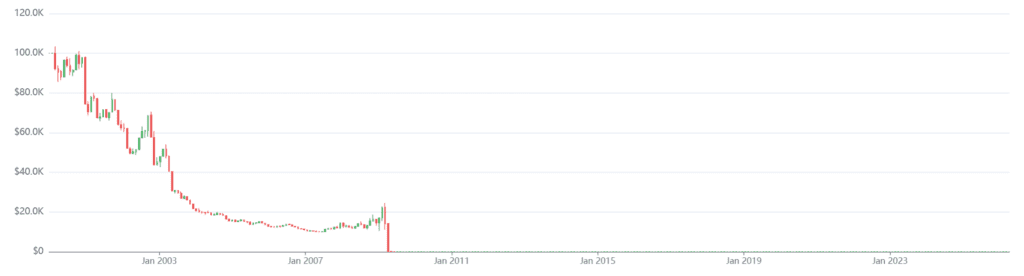
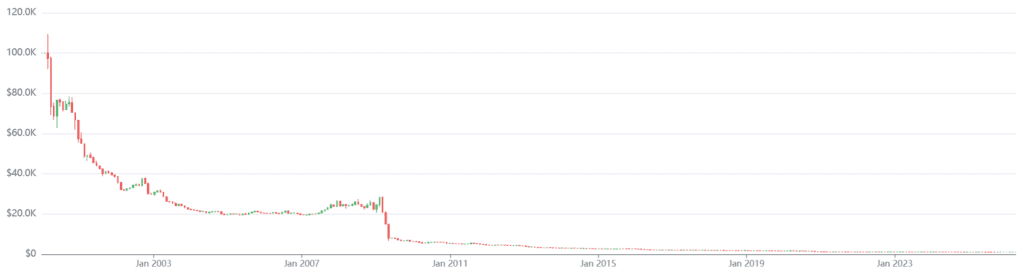
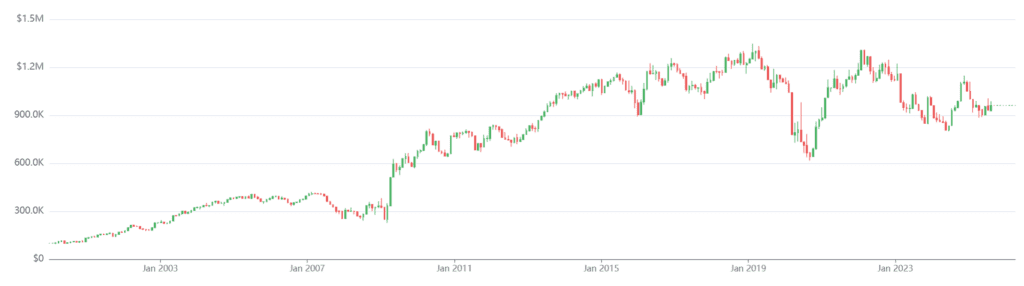
Although the initial intuition is conceptually appealing, the empirical results suggest that this straightforward implementation does not generate a robust signal. The performance of the strategy indicates that simply targeting the smallest constituents of the index is not sufficient to systematically exploit index-related flows. To further investigate whether the results are driven by an overly narrow selection, we extend the analysis to two alternative specifications that vary the number of targeted companies.
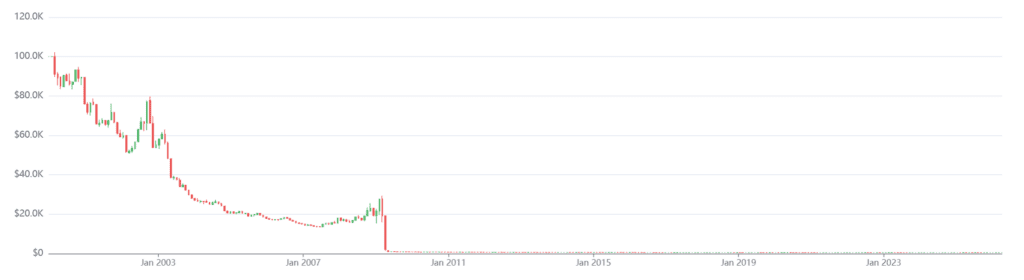
We observe that even when varying the number of shorted companies, the results do not materially improve. This naturally raises the question of why the anticipated effect does not manifest in practice.
One plausible explanation is that the presence of a company within the S&P 500 index is a substantially stronger and more persistent factor than the relatively uncertain and often gradual process of index exclusion. In other words, index membership itself may dominate any short-term pressure associated with potential removal, effectively offsetting the hypothesized downside effect.
At the same time, the key limitation of this approach remains informational: it is not possible to identify with sufficient lead time which companies will be removed from the index. As a result, this direct shorting framework is unlikely to provide a stable or exploitable edge.
However, this does not imply that the underlying idea is without value. Rather, it suggests that the strategy must include some other ingredience. Instead of attempting to predict deletions directly, the information embedded in index dynamics can potentially be exploited in a different manner, which we explore in the following section.
More assets in model
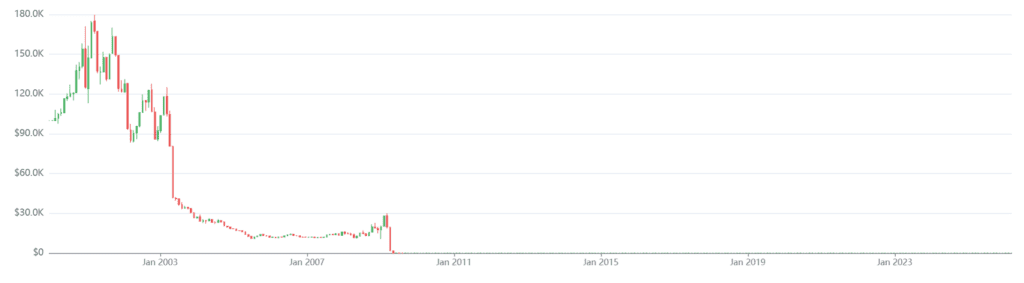
We observe that relying solely on the idea of trading the lower segment of large-cap stocks may not be sufficient on its own. However, the same underlying logic can be extended to the mid-cap universe, but in the opposite direction. If the lower end of the S&P 500 is considered overpriced and therefore expected to decline, then, by the same reasoning, the upper tier of the mid-cap segment, namely the largest companies by market capitalization outside the S&P 500, may be relatively undervalued. This creates an opportunity to combine both views into a single relative-value strategy: simultaneously opening a long position in the top segment of mid-cap stocks while taking a short position in the bottom segment of the S&P 500. Such a structure aims to capture the valuation spread between adjacent capitalization tiers rather than relying on a purely directional market bet.
However, empirical testing of this strategy showed that even the inclusion of a second asset segment did not make the strategy profitable. In other words, adding long exposure to a different capitalization tier was not sufficient to improve the return profile or generate consistent excess returns.
The other side of the coin
Given the strategy’s poor performance of going long the smallest stocks in the S&P 500 and simultaneously going long the biggest stocks not yet in the S&P 500, we decided to turn the whole hypothesis on its head. Is it really possible that the effect of indexing (being in the prestigious S&P 500 index) gives even relatively small large-cap stocks such a boost that they would systematically outperform larger companies that do not have the luck of being selected into the index?
So, by combining a long position in the lower portion of the S&P 500 with a short position in high-end mid-cap stocks, we aim to construct a relative value framework that is more aligned with index-driven capital flows, rather than attempting to isolate deletion effects in isolation.
Let’s examine how different portfolio construction choices influence the behaviour of this strategy, with particular attention to the balance between the long and short legs. As a starting point, we consider an equal-number configuration, where the long and short sides contain the same number of securities, each assigned uniform weights.
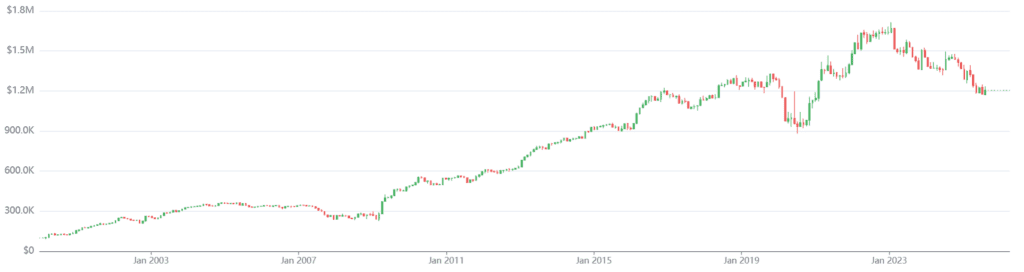
The results from the equal-sized long and short portfolios suggest pattern: a higher number of included assets may improve performance. This indicates that diversification plays a non-trivial role in stabilizing the strategy and may help in reducing idiosyncratic noise that dominates smaller portfolios.
Given this observation, we conclude the analysis by relaxing the symmetry constraint and exploring whether the structure can be improved through asymmetric allocation choices. In particular, we fix the number of long positions (stocks) and investigate whether varying the construction of the short leg has any meaningful impact on performance.
This final experiment is designed to test whether the observed improvement is driven purely by diversification effects, or whether there exists a more structural relationship between portfolio composition and index-related dynamics that can be exploited through a refined allocation scheme.
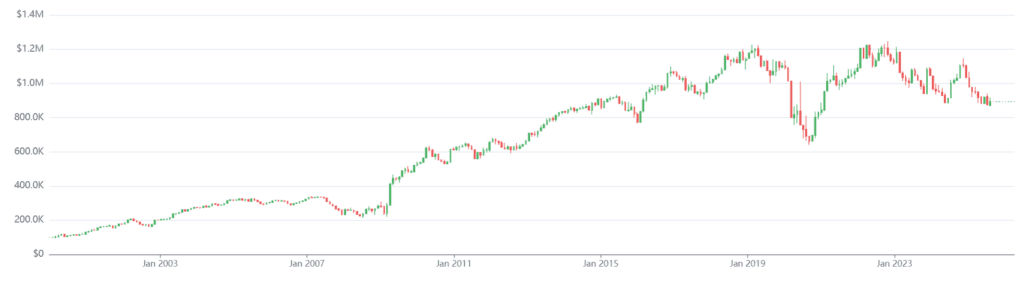
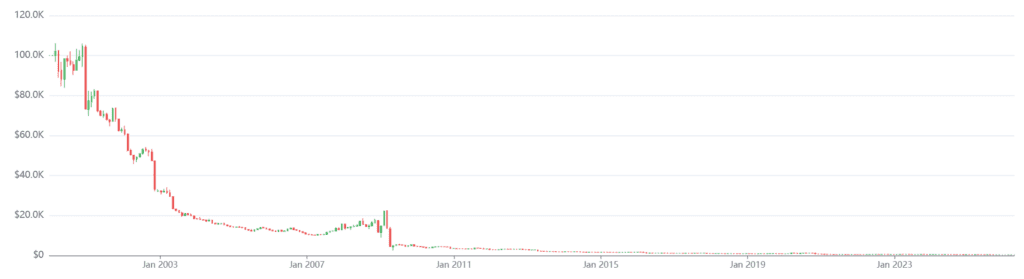
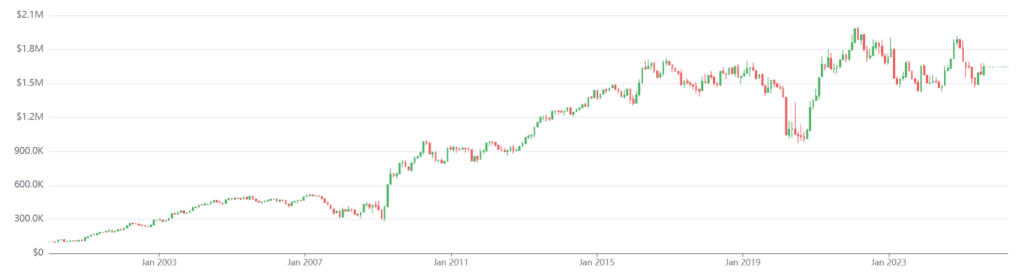
The empirical results indicate that the configuration with 20 short positions in non-index constituents and 20 long positions in the lower segment of the index performs relatively well compared to the other tested specifications. This variant achieves an annualized return of approximately 11.23%.
However, when adjusting for risk, the improvement is less pronounced. The Sharpe ratio remains in the vicinity of 0.4, which is broadly consistent with the other portfolio configurations (0.3 – 0.4). This suggests that while certain allocation choices may enhance raw returns, they do not meaningfully improve the risk-adjusted efficiency of the strategy.
At the same time, it is important to acknowledge that this stage of analysis already begins to introduce a degree of parameter tuning. The gradual adjustment of portfolio composition in search of improved performance can lead to overfitting, where results are increasingly tailored to historical data rather than driven by a stable underlying effect. For this reason, the results should be interpreted with caution, as they likely reflect a combination of genuine structural effects and model-specific calibration.
As part of robustness checks, we also tested nearby values for the number of long positions to assess the sensitivity of the results to this parameter choice. The findings suggest that there exists a relatively stable range in which the strategy exhibits similar behaviour, indicating that the observed performance is not driven by a single, isolated configuration. Within this interval, both returns and risk characteristics remain broadly consistent, which provides some reassurance that the effect is not the result of an overfitted parameter selection.
Conclusion
The empirical analysis does not support the original hypothesis that stocks at the lower end of the S&P 500 systematically underperform due to anticipated index deletions. Across multiple specifications, the simple shorting of the smallest index constituents failed to deliver consistent or robust excess returns. Even when extended into a relative-value framework by pairing these shorts with long positions in large non-index stocks, the results remained unconvincing.
However, a meaningful insight emerged when we inverted the original idea.
By going long the smallest constituents of the S&P 500 and shorting the largest companies just outside the index, we uncovered a persistent, albeit moderate, effect: lower-tier S&P 500 stocks tend to outperform their larger, non-index counterparts. This finding is somewhat counterintuitive. One might expect larger firms outside the index to exhibit stronger fundamentals or greater growth potential, yet the data suggests otherwise.
A plausible explanation lies in the structural impact of passive investing. Inclusion in the S&P 500 is not merely a classification, it effectively grants a stock access to a substantial and mechanically driven pool of capital. Index funds and ETFs continuously allocate capital to index constituents, creating a persistent demand that may support prices beyond what fundamentals alone would justify. In this context, even smaller companies within the index can benefit from a “membership premium”, while larger firms outside the index remain excluded from these flows.
This interpretation aligns with the broader narrative of modern equity markets, where flows increasingly matter alongside fundamentals. The “index effect” appears to be less about discrete events such as additions or deletions, and more about the ongoing structural demand generated by passive investment vehicles.
In summary, the key takeaway is not the success of a specific trading rule, but the identification of a structural market phenomenon. The advantage associated with index membership, particularly in an era dominated by passive investing, appears to outweigh the risks tied to potential exclusion. This suggests that future research should focus less on predicting index changes and more on quantifying and exploiting the persistent demand imbalances created by index inclusion itself.
Author: David Belobrad, Junior Quant Analyst, Quantpedia
Are you looking for more strategies to read about? Sign up for our newsletter or visit our Blog or Screener.
Do you want to learn more about Quantpedia Premium service? Check how Quantpedia works, our mission and Premium pricing offer.
Do you want to learn more about Quantpedia Pro service? Check its description, watch videos, review reporting capabilities and visit our pricing offer.
Do you want algorithmic access to the full Quantpedia database via the API? Subscribe to Quantpedia Pro, ask for an API key, and explore the in/out-of-sample statistics, source academic papers, and code snippets — ideal for quantitative research, systematic trading workflows, and AI model training.
Are you looking for historical data or backtesting platforms? Check our list of Algo Trading Discounts.
Or follow us on:
Facebook Group, Facebook Page, Twitter, Linkedin, Medium or Youtube
Share onLinkedInTwitterFacebookRefer to a friend


