Combining Calendar Strategies into the Trading Portfolio
Introduction
Calendar strategies are often viewed as weak when assessed individually. Their annualized returns tend to be low, market exposure is limited, and trading activity is sparse. Compared to trend following or swing strategies, which can remain invested for extended periods, calendar strategies may appear inefficient at first glance. This impression, however, largely stems from evaluating these strategies outside of their intended context. Calendar strategies are not designed to operate as standalone trading systems. Their primary role is within a portfolio, where their structural properties become relevant rather than their individual performance metrics.
Structural Characteristics of Calendar Strategies
Calendar strategies enter and exit positions based on predefined time conditions rather than price dynamics. These conditions are linked to recurring events such as month boundaries, tax deadlines, election cycles, central bank meetings, holidays, or culturally driven demand patterns.
By construction, these strategies are highly selective. They are active only during narrow time windows and remain out of the market for most of the year. This naturally results in low average exposure, a small number of trades, and muted standalone performance.
These characteristics are intentional. They are a direct consequence of the strategy design rather than an implementation flaw.
Standalone Performance
Looking at the standalone performance of individual calendar strategies highlights this selectivity. Annual returns are generally low and uneven across years, reflecting the limited number of active trading days.
Turn of the Month in Equity Indexes stands out as one of the examples and a top performer among the strategies considered. In some years, returns reach double-digit levels. However, this performance is concentrated in very short monthly windows and does not imply sustained exposure to equity markets.
The Tax Day Trade is among the most selective strategies, activating only once per year. Its annual contribution is therefore small and frequently close to zero.
Payday Anomaly exhibits stable but low returns, consistent with its short activation windows around salary payment periods.
Pre Election Drift in the Stock Market is active only during specific political cycles. As a result, its standalone performance is minimal and irregular.
The Pre Holiday Effect in Commodities delivers modest positive returns, constrained by short pre holiday windows and limited time in the market.
Pre ECB Drift Strategy produces very low or near zero annual returns, which is consistent with its event driven and infrequent nature.
Cultural Calendars and the Gold Drift generates low but relatively stable returns driven by culturally motivated demand for gold. Again, the limited performance reflects high selectivity rather than weak signal quality.
Taken individually, none of these strategies is expected to produce attractive standalone results. However, the true value of calendar strategies lies in their low temporal correlation — they tend to activate at different points in time, rarely overlapping in exposure. Because of this structural independence, they can be combined or “stacked” into a composite portfolio where return streams complement rather than crowd each other. The result is a smoother equity curve, improved diversification, and stronger risk-adjusted performance than any single effect could deliver on its own. This combinability — their ability to coexist without interference — is precisely what makes calendar strategies both elegant and powerful in systematic portfolio construction.
Portfolio Construction
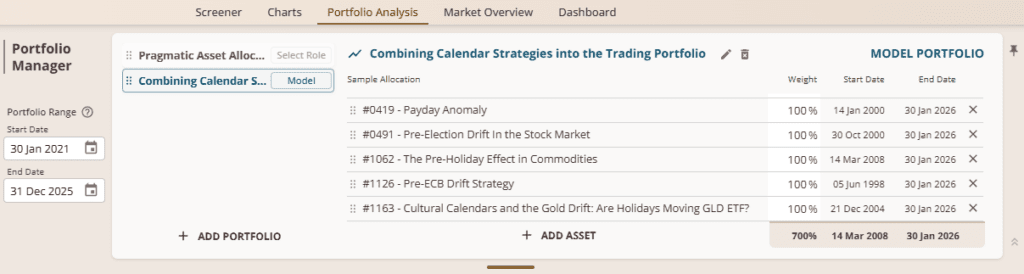
To evaluate their combined effect, all strategies are aggregated into a single model portfolio using Quantpedia Portfolio Analysis. The portfolio is equally weighted, rebalanced daily, with no additional filters applied. This setup preserves the selective nature of each strategy while allowing returns to accumulate across different calendar windows.
Component Level Perspective
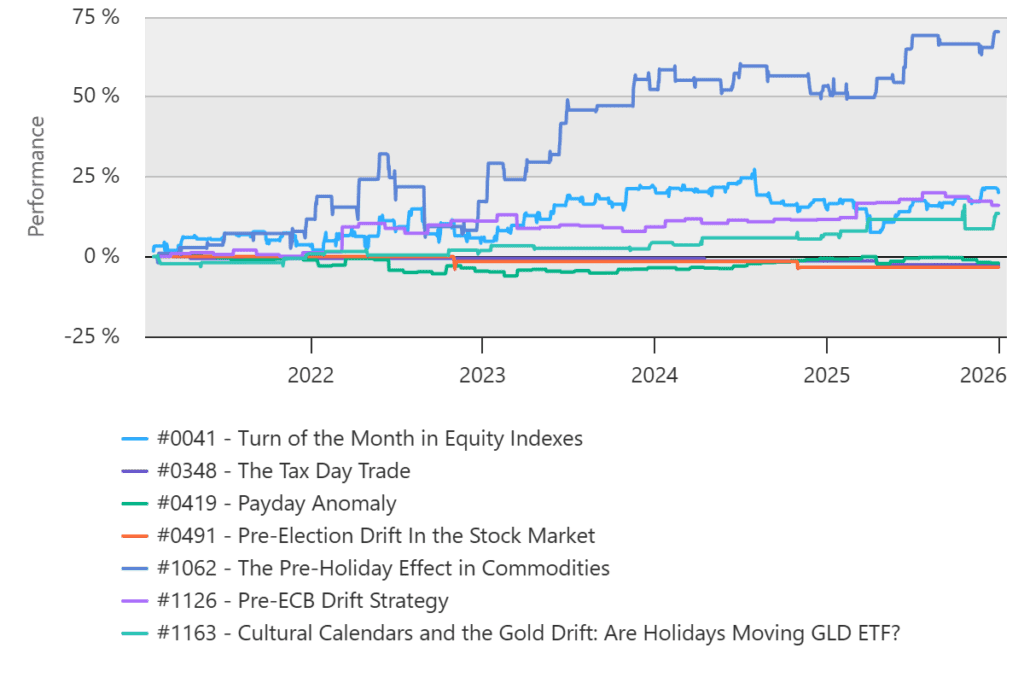
The component performance chart illustrates how individual strategies behave within the composite portfolio. Equity curves are characterized by long flat periods interrupted by short bursts of returns corresponding to active calendar windows. No single strategy dominates the portfolio. Each contributes incrementally and at different points in time. This is consistent with the intended role of calendar strategies.
Component Performance Summary
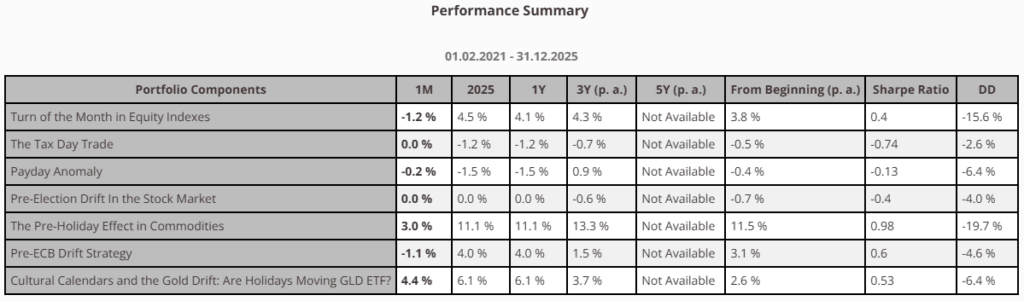
The performance summary confirms the visual impression from the component equity curves. Annualized returns are low, Sharpe ratios are modest, and drawdowns remain contained at the component level.
There is no clear winner among the strategies. Portfolio performance is therefore not driven by selection, but by aggregation.
Correlation Between Calendar Strategies
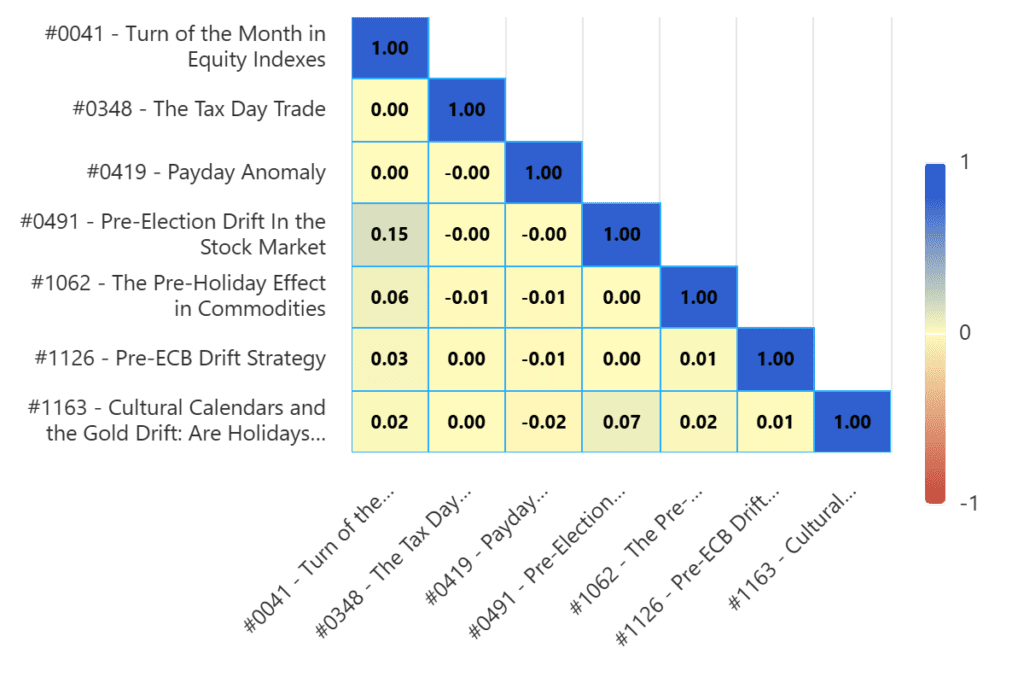
The correlation matrix shows that correlations between individual calendar strategies are close to zero. This is primarily a result of non overlapping activation periods rather than differences in asset classes.
Diversification in the calendar portfolio is therefore time based.
Portfolio Level Performance
The effect of combining calendar strategies becomes visible only at the portfolio level.
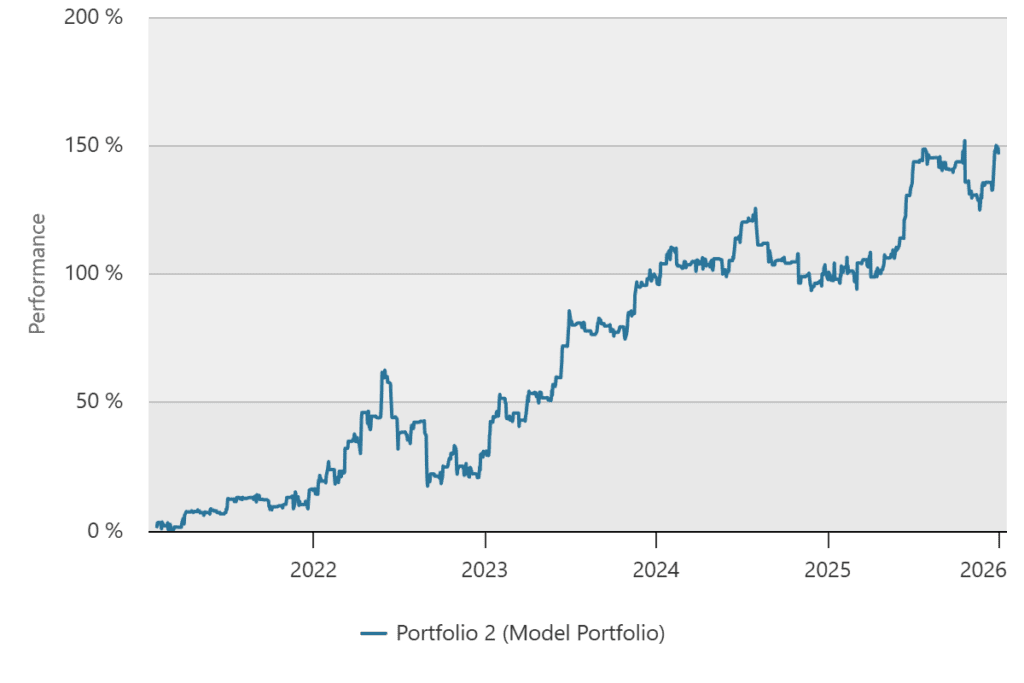
The cumulative performance chart shows a steadily rising equity curve. Returns accumulate gradually over time, reflecting the episodic nature of calendar signals rather than continuous market participation.
Performance is generated across different market environments without reliance on prolonged trends.
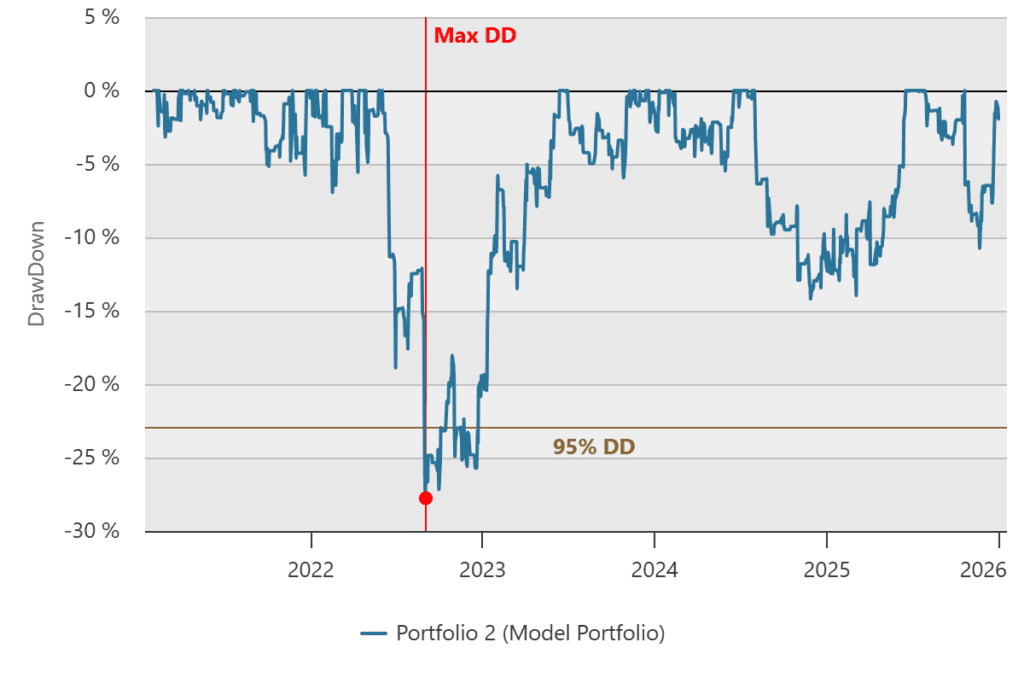
The drawdown profile indicates that drawdowns are contained relative to achieved returns. Periods of underperformance are followed by recoveries as new calendar effects become active.
Limited directional exposure contributes to this behavior.
Performance Statistics
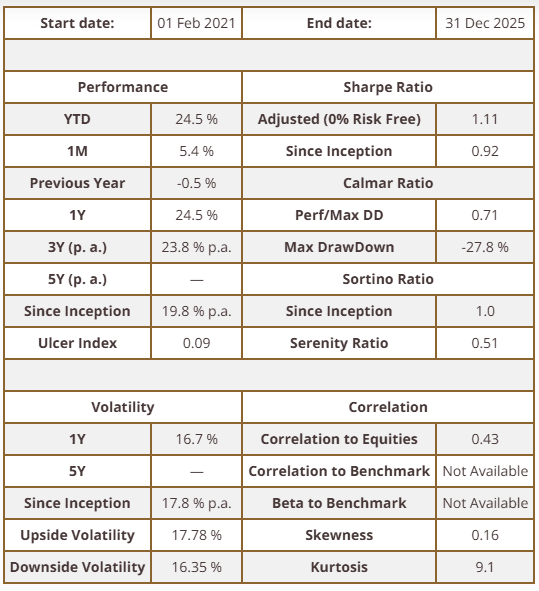
The performance statistics confirm that the portfolio achieves attractive long term returns with moderate volatility. Risk adjusted metrics such as Sharpe and Calmar ratios are consistent with a systematic strategy operating with limited exposure.
Monthly Performance
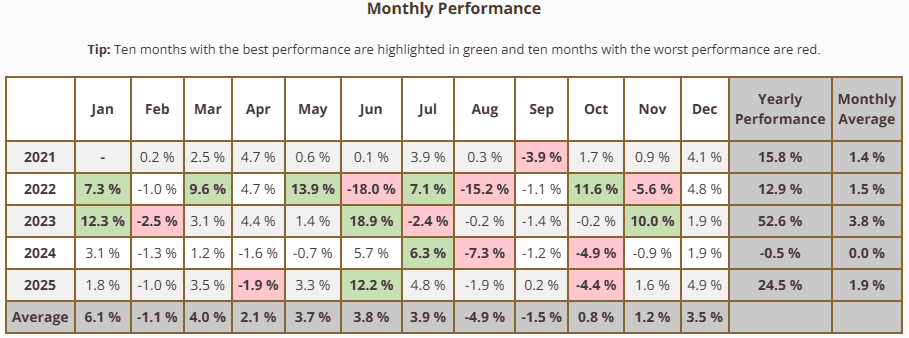
Year by year results show that returns are distributed across multiple years. Performance is not dependent on a single favorable regime, which supports the robustness of the portfolio structure. Monthly results display a balanced mix of positive and negative months. Losses tend to be limited, while gains are realized during specific calendar driven opportunities.
Rolling Market Exposure
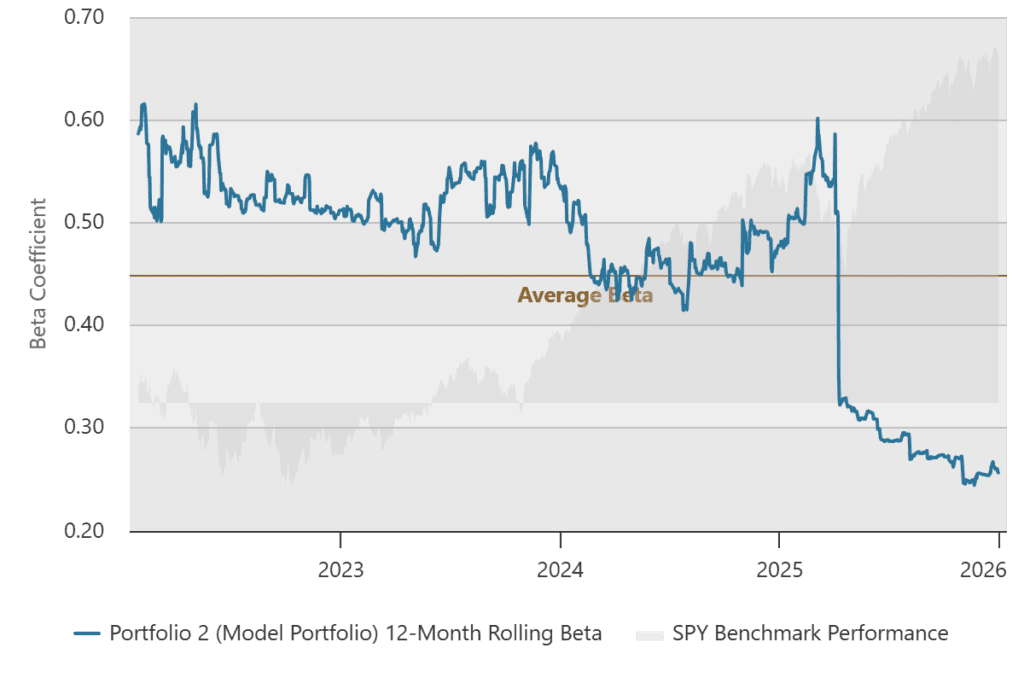
Rolling beta remains well below one for most of the observed period. Exposure fluctuates depending on which calendar strategies are active, but overall market sensitivity stays limited.
Rolling Correlation
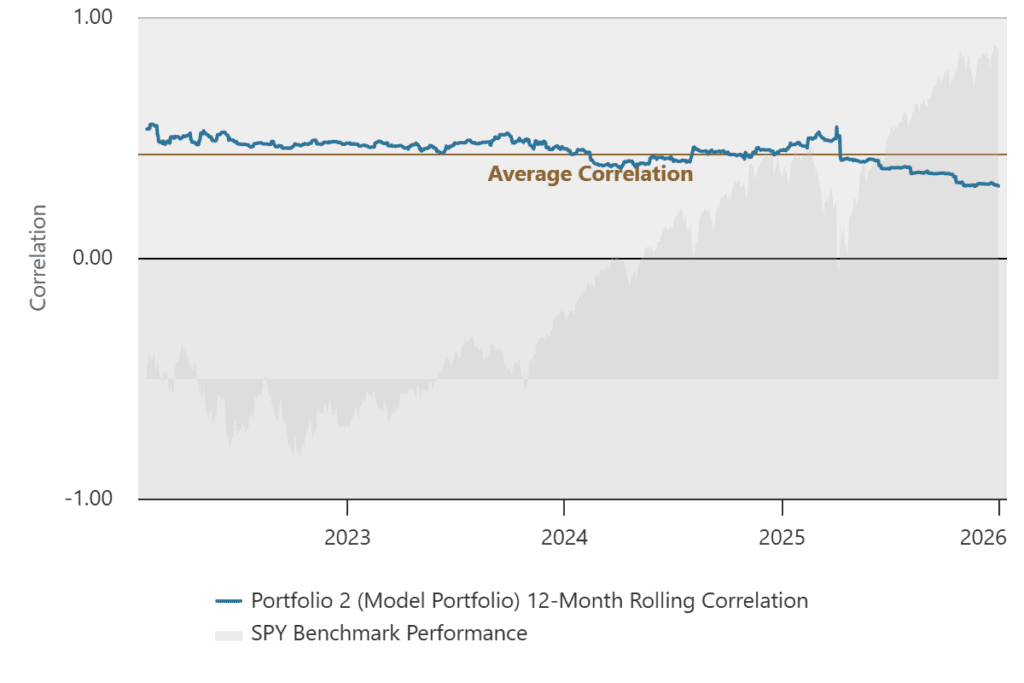
Rolling correlation varies over time and remains moderate. This reflects time based diversification rather than continuous equity exposure.
Conclusion
Calendar strategies are often misunderstood when evaluated in isolation. Their low exposure and selective activation naturally lead to weak standalone metrics. When combined into a portfolio, these same characteristics become advantageous. Independent calendar effects accumulate returns over time without increasing exposure or leverage. That’s the reason why the calendar strategies are best viewed not as standalone trading systems, but as components within diversified systematic portfolios.
Author: David Mesíček, Junior Quant Analyst, Quantpedia
Are you looking for more strategies to read about? Sign up for our newsletter or visit our Blog or Screener.
Do you want to learn more about Quantpedia Premium service? Check how Quantpedia works, our mission and Premium pricing offer.
Do you want to learn more about Quantpedia Pro service? Check its description, watch videos, review reporting capabilities and visit our pricing offer.
Are you looking for historical data or backtesting platforms? Check our list of Algo Trading Discounts.
Would you like free access to our services? Then, open an account with Lightspeed and enjoy one year of Quantpedia Premium at no cost.
Or follow us on:
Facebook Group, Facebook Page, Twitter, Linkedin, Medium or Youtube
Share onLinkedInTwitterFacebookRefer to a friend


