Systematic Tactical Allocation in Emerging Markets vs. U.S.: A Momentum-Based Approach
Introduction
The global investment environment is going through a period of meaningful structural change. The dominance of the U.S. dollar is increasingly being questioned, geopolitical tensions are rising, and macroeconomic uncertainty remains elevated. Together, these forces challenge the post-Global Financial Crisis environment in which U.S. equities consistently outperformed most international markets. As a result, investors may be approaching a turning point where relative returns between U.S. equities and international markets—especially Emerging Markets (EM)—begin to shift.
This research focuses on a practical portfolio allocation question: when should investors increase or reduce exposure to Emerging Market equities relative to U.S. equities? Building on our earlier work analyzing the EAFE-USA spread, we extend the framework to Emerging Markets. Our hypothesis is that the relative performance between U.S. and EM equities is not random. Instead, it shows patterns driven by momentum and broader market trends. These patterns likely reflect persistent capital flows and the gradual spread of macroeconomic information across global markets.
Rather than relying on static asset allocation approaches, we develop a dynamic allocation model that uses momentum and trend signals to generate practical timing signals between U.S. and EM equities. Emerging Markets are particularly interesting in this context because they tend to experience stronger regime shifts and larger performance cycles than developed international markets.
Background: International Equity Regimes and Momentum Effects
The theoretical foundation for systematic international equity allocation rests upon several interrelated strands of financial economics. First, the international asset pricing literature (Stulz, 1981; Solnik, 1974) has long established that global market integration affects cross-border return correlations and diversification benefits. Second, the momentum anomaly, first documented by Jegadeesh and Titman (1993) in U.S. equities, has been shown to persist across international markets (Rouwenhorst, 1999; Asness et al., 2013), suggesting that momentum effects may provide a robust signal for tactical allocation. Third, the work of Bekaert et al. (2017) on international asset pricing highlights the critical role of regime shifts and time-varying risk premiums in explaining cross-market return differentials. Fourth, the literature on currency regimes (Bansal and Yaron, 2004) demonstrates how exchange rate dynamics interact with equity returns to create complex, regime-dependent investment opportunities. Finally, the recent work on market regimes by Ang and Bekaert (2002) provides a theoretical framework for understanding how macroeconomic conditions affect asset return predictability.
Empirically, the literature has established that international equity returns exhibit significant regime dependence. The seminal work of Harvey (1991) demonstrated that international return correlations are not constant but vary with economic conditions. More recently, the analysis of Gürkaynak and Wright (2012) has shown how monetary policy regimes impact international asset pricing. Ilmanen’s (2011) work on expected returns across asset classes further emphasizes the importance of regime-aware investment strategies. The research by Fama and French (1998) on international factors has provided a foundation for understanding the drivers of cross-market returns. Finally, the analysis of Campbell et al. (2021) on global asset allocation has demonstrated the value of dynamic strategies in capturing regime-dependent return predictability.
The current research builds upon this foundation by specifically examining the EM-USA spread through the lens of momentum-based tactical allocation. Unlike prior studies that have focused primarily on developed markets, this analysis examines the unique characteristics of EM equities, which exhibit higher volatility, distinct correlation structures, and distinct regime behavior. By extending the data universe to incorporate EM markets, we capture additional structural breaks and regime transitions that may provide enhanced tactical allocation opportunities. The following section details our methodology and empirical approach.
Methodology, Data, and Empirical Framework
Data Specification and Hypothesis Formulation
The empirical analysis employs monthly equity return data for Emerging Markets (EM) and U.S. markets. Data samples span from February 1997 up until February 2026. The EM return series is proxied by the MSCI Emerging Markets Index (see https://app2.msci.com/products/index-data-search/), while U.S. equity performance is measured by the S&P 500 Index (SPY). We construct a dollar-neutral spread position S at time t as the difference between the total returns of the EM index and SPY over a specified period. The spread is defined as:
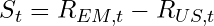
where REM,t and RUS,t represent the total returns of the EM and U.S. equity markets, respectively.
We formulate the following hypothesis for generating alpha from the dynamic EM-USA relationship:
H1: The relative performance spread S exhibits persistent intermediate-term trends that can be captured with time-series momentum signals.
This hypothesis is predicated on the notion that EM markets exhibit distinct regime characteristics that create predictable patterns in the spread dynamics. Our analysis tests this hypothesis by implementing momentum-based strategies that seek to capture these regime transitions.
Methodological Approach
We engineer two systematic trading rule variants to test our hypothesis: (1) Rate of Change (ROC) momentum signals and (2) Simple Moving Average (SMA) trend-following signals. For each variant, we implement three strategy configurations: (a) long spread (betting on EM outperformance), (b) short spread (betting on U.S. outperformance), and (c) long-short spread (combining both directions based on signal strength).
For the ROC variant, we define the momentum signal as:
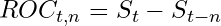
where n represents the lookback window (in months). The strategy goes long when ROCt,n > 0 and short when ROCt,n < 0.
For the SMA variant, we define the trend signal as:
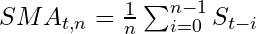
The strategy goes long when St > SMAt,n, and short when St < SMAt,n.
We test multiple lookback windows ranging from 1 to 24 months to identify the optimal signal parameters. Additionally, we construct a composite strategy by averaging across multiple lookback windows (excluding the longest) to enhance robustness and reduce sensitivity to parameters.
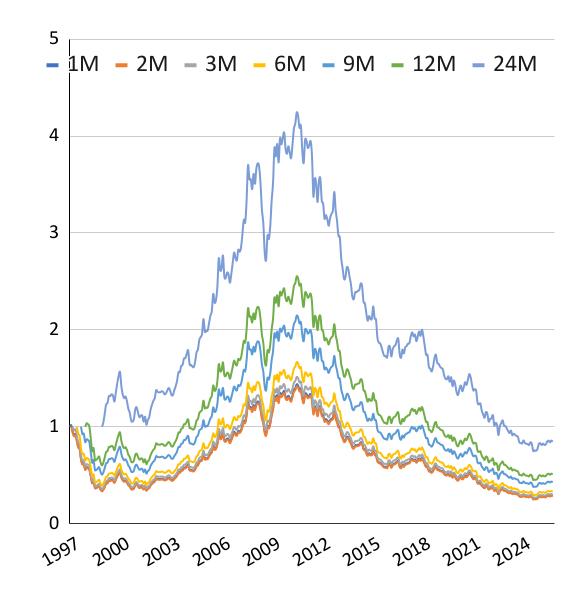
Benchmark Performance Metrics for EM-USA Spread
The following table presents the performance metrics for the baseline EM-USA spread benchmarks, which serve as the foundation for our momentum-based tactical allocation analysis. These benchmarks represent the raw performance of the Emerging Markets index relative to the U.S. equity index (SPY), with no systematic trading rules applied, just with the different lag from the starting point (to accommodate the different starting points of trend-following strategies we aim to build, which require some initial data sample for the calculation).
|
Metric
|
1M
|
2M
|
3M
|
6M
|
9M
|
12M
|
24M
|
|---|---|---|---|---|---|---|---|
|
CAR p.a.
|
-4.22%
|
-4.28%
|
-4.08%
|
-3.79%
|
-2.96%
|
-2.38%
|
-0.62%
|
|
Volatility p.a.
|
15.18%
|
15.18%
|
15.18%
|
15.19%
|
15.14%
|
14.91%
|
14.28%
|
|
Sharpe Ratio
|
-0.278
|
-0.282
|
-0.268
|
-0.249
|
-0.195
|
-0.160
|
-0.044
|
|
Max DD
|
-82.31%
|
-82.31%
|
-82.31%
|
-82.31%
|
-82.31%
|
-82.31%
|
-82.31%
|
|
CAR / max DD
|
-0.05
|
-0.05
|
-0.05
|
-0.05
|
-0.04
|
-0.03
|
-0.01
|
These benchmark performances demonstrate the persistent underperformance of Emerging Markets relative to U.S. equities over the sample period, with consistently negative compound annual returns (CAR) across all lookback windows. The Sharpe ratios are uniformly negative, indicating poor risk-adjusted performance, while the maximum drawdown remains constant at -82.31% across all time horizons, reflecting the severe drawdowns experienced by EM markets relative to the U.S. during the sample period. This baseline performance provides the critical reference point against which our momentum-based tactical allocation strategies are evaluated.
Strategy Results
Strategy A: Rate of Change (ROC)
Table 1: Performance metrics for Rate of Change (ROC) momentum strategy variants
|
Strategy A
|
ROC(1)
|
ROC(2)
|
ROC(3)
|
ROC(6)
|
ROC(9)
|
ROC(12)
|
ROC(24)
|
comp.
|
|---|---|---|---|---|---|---|---|---|
|
Long
|
|
|
|
|
|
|
|
|
|
CAR p.a.
|
1.10%
|
0.53%
|
1.47%
|
0.32%
|
2.33%
|
2.66%
|
2.49%
|
1.49%
|
|
Volatility p.a.
|
10.74%
|
10.44%
|
9.97%
|
9.88%
|
8.95%
|
8.77%
|
9.39%
|
8.54%
|
|
Sharpe Ratio
|
0.103
|
0.050
|
0.147
|
0.032
|
0.261
|
0.304
|
0.266
|
0.174
|
|
Max DD
|
-47.90%
|
-64.95%
|
-53.81%
|
-63.53%
|
-34.80%
|
-39.44%
|
-28.23%
|
-48.95%
|
|
CAR / max DD
|
0.023
|
0.008
|
0.027
|
0.005
|
0.067
|
0.068
|
0.088
|
0.030
|
|
Short
|
|
|
|
|
|
|
|
|
|
CAR p.a.
|
4.35%
|
3.75%
|
4.40%
|
2.89%
|
3.95%
|
3.68%
|
1.98%
|
3.91%
|
|
Volatility p.a.
|
10.67%
|
11.01%
|
11.38%
|
11.51%
|
11.89%
|
11.90%
|
10.59%
|
10.16%
|
|
Sharpe Ratio
|
0.407
|
0.340
|
0.387
|
0.251
|
0.332
|
0.309
|
0.187
|
0.385
|
|
Max DD
|
-33.30%
|
-32.26%
|
-39.06%
|
-47.01%
|
-43.84%
|
-39.93%
|
-44.62%
|
-34.77%
|
|
CAR / max DD
|
0.130
|
0.116
|
0.113
|
0.061
|
0.090
|
0.092
|
0.044
|
0.112
|
|
Long-Short
|
|
|
|
|
|
|
|
|
|
CAR p.a.
|
5.50%
|
4.29%
|
5.93%
|
3.21%
|
6.38%
|
6.44%
|
4.52%
|
5.69%
|
|
Volatility p.a.
|
15.10%
|
15.15%
|
15.07%
|
15.15%
|
14.82%
|
14.71%
|
14.11%
|
11.44%
|
|
Sharpe Ratio
|
0.364
|
0.283
|
0.393
|
0.212
|
0.431
|
0.438
|
0.321
|
0.497
|
|
Max DD
|
-29.34%
|
-48.81%
|
-33.19%
|
-47.23%
|
-34.14%
|
-44.13%
|
-49.92%
|
-19.73%
|
|
CAR / max DD
|
0.187
|
0.088
|
0.179
|
0.068
|
0.187
|
0.146
|
0.091
|
0.288
|
Our analysis of the ROC momentum strategy reveals several important patterns. As shown in Table 1, the long ROC strategy demonstrates modest positive returns across most lookback windows, with the 12-month window yielding the highest CAR (2.66%) and the highest Sharpe ratio (0.304). However, the long strategy exhibits significant drawdowns, with a 12-month maximum drawdown of -39.44%.
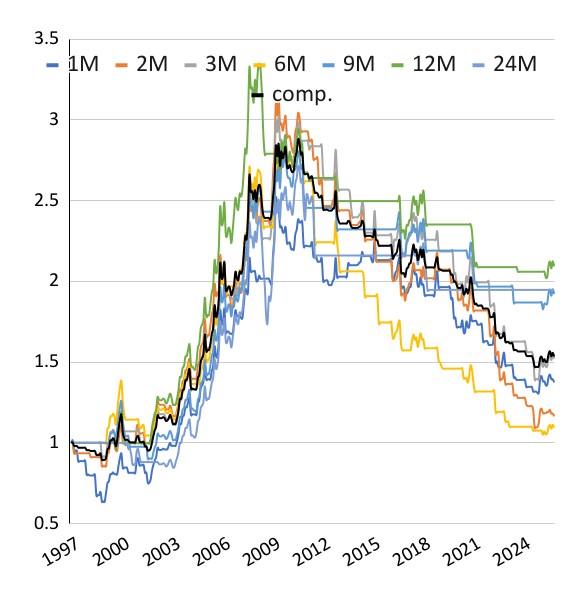
The short ROC strategy demonstrates substantially stronger performance, with the 12-month window yielding a CAR of 3.68% and a Sharpe ratio of 0.309. The 9-month window shows the best risk-adjusted performance with a Sharpe ratio of 0.332. The short strategy consistently outperforms the long strategy across all metrics, suggesting that betting on U.S. outperformance has been more profitable than betting on EM outperformance during the sample period.
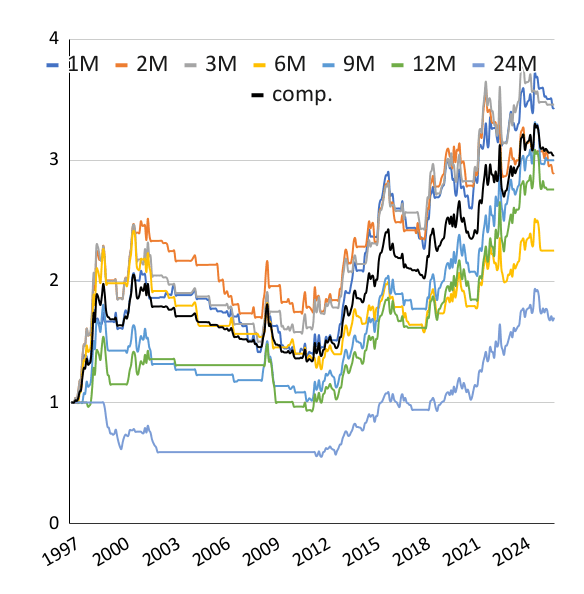
The long-short ROC strategy delivers the strongest performance, with the 12-month window yielding a CAR of 6.44% and a Sharpe ratio of 0.438. The composite strategy achieves a CAR of 5.69% with a Sharpe ratio of 0.497, significantly outperforming both the long and short standalone strategies. The composite strategy also demonstrates superior risk management, with a maximum drawdown of -19.73%, compared with the benchmark spread’s -82.31%.
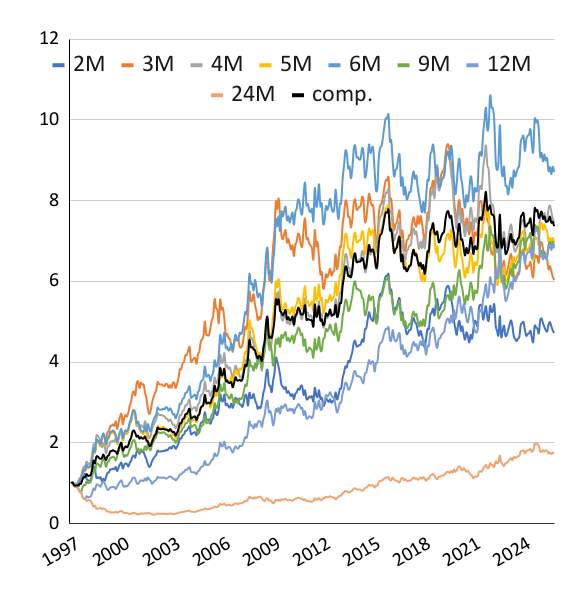
Strategy B: Sample Moving Average (SMA)
Table 2: Performance metrics for Sample Moving Average (SMA) trend-following strategy variants
|
Strategy B
|
MA(2)
|
MA(3)
|
MA(4)
|
MA(5)
|
MA(6)
|
MA(9)
|
MA(12)
|
MA(24)
|
comp.
|
|---|---|---|---|---|---|---|---|---|---|
|
Long
|
|
|
|
|
|
|
|
|
|
|
CAR p.a.
|
1.10%
|
1.58%
|
1.98%
|
1.90%
|
2.32%
|
1.91%
|
1.92%
|
-0.66%
|
1.88%
|
|
Volatility p.a.
|
10.74%
|
10.30%
|
10.13%
|
9.83%
|
9.61%
|
9.69%
|
9.54%
|
10.70%
|
9.12%
|
|
Sharpe Ratio
|
0.103
|
0.153
|
0.195
|
0.193
|
0.241
|
0.197
|
0.202
|
-0.062
|
0.206
|
|
Max DD
|
-47.90%
|
-56.84%
|
-46.32%
|
-48.30%
|
-49.30%
|
-43.84%
|
-39.04%
|
-69.15%
|
-45.01%
|
|
CAR / max DD
|
0.023
|
0.028
|
0.043
|
0.039
|
0.047
|
0.044
|
0.049
|
-0.010
|
0.042
|
|
Short
|
|
|
|
|
|
|
|
|
|
|
CAR p.a.
|
4.35%
|
4.75%
|
5.14%
|
5.00%
|
5.40%
|
5.02%
|
5.03%
|
2.73%
|
4.98%
|
|
Volatility p.a.
|
10.67%
|
11.09%
|
11.24%
|
11.53%
|
11.70%
|
11.71%
|
11.89%
|
11.13%
|
10.59%
|
|
Sharpe Ratio
|
0.407
|
0.429
|
0.457
|
0.433
|
0.461
|
0.428
|
0.423
|
0.245
|
0.471
|
|
Max DD
|
-33.30%
|
-34.94%
|
-36.57%
|
-35.06%
|
-25.55%
|
-28.80%
|
-25.41%
|
-42.49%
|
-30.45%
|
|
CAR / max DD
|
0.130
|
0.136
|
0.140
|
0.143
|
0.211
|
0.174
|
0.198
|
0.064
|
0.164
|
|
Long-Short
|
|
|
|
|
|
|
|
|
|
|
CAR p.a.
|
5.50%
|
6.41%
|
7.22%
|
6.99%
|
7.84%
|
7.02%
|
7.05%
|
2.05%
|
7.13%
|
|
Volatility p.a.
|
15.10%
|
15.06%
|
15.03%
|
15.04%
|
15.01%
|
15.04%
|
15.04%
|
15.19%
|
12.64%
|
|
Sharpe Ratio
|
0.364
|
0.426
|
0.480
|
0.465
|
0.523
|
0.467
|
0.469
|
0.135
|
0.564
|
|
Max DD
|
-29.34%
|
-35.76%
|
-28.27%
|
-30.13%
|
-23.86%
|
-23.26%
|
-39.04%
|
-78.33%
|
-20.31%
|
|
CAR / max DD
|
0.187
|
0.179
|
0.255
|
0.232
|
0.329
|
0.302
|
0.181
|
0.026
|
0.351
|
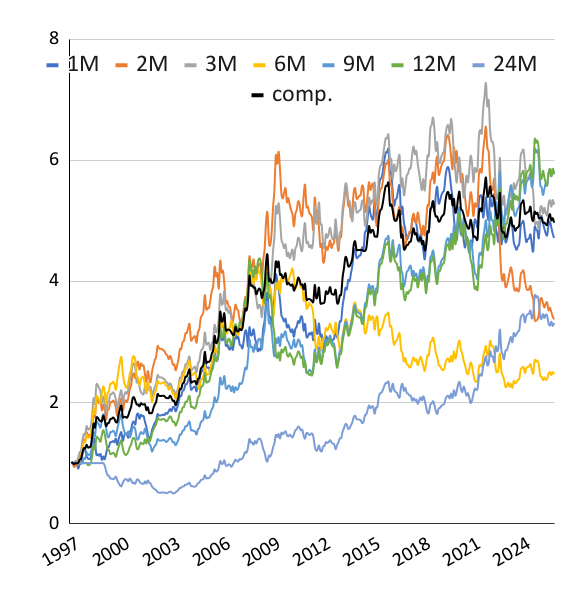
The SMA trend-following strategy exhibits patterns similar to those of the ROC strategy, but with notable differences. As shown in Table 2, the long SMA strategy yields modest positive returns across most lookback windows, with the 6-month window delivering the highest CAR (2.32%) and the highest Sharpe ratio (0.241). The 6-month window also demonstrates the best risk-adjusted performance among the long strategies.

The short SMA strategy exhibits strong performance across all lookback windows, with the 6-month window yielding the highest CAR (5.40%) and the highest Sharpe ratio (0.461). The short strategy consistently outperforms the long strategy, with the 6-month window showing a Sharpe ratio almost twice that of the corresponding long strategy.
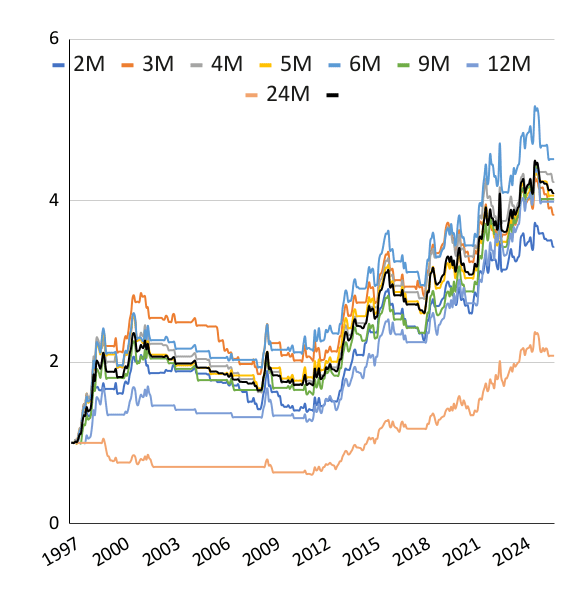
The long-short SMA strategy delivers exceptional performance, with the 6-month window yielding a CAR of 7.84% and a Sharpe ratio of 0.523. The composite strategy achieves a CAR of 7.13% and a Sharpe ratio of 0.564, representing the strongest risk-adjusted performance among all tested strategies. The composite strategy also demonstrates excellent risk management, with a maximum drawdown of -20.31%, significantly outperforming the static benchmark spread’s drawdowns.
Discussion & Conclusion
Our analysis of both ROC and SMA momentum strategies reveals several critical insights regarding systematic tactical allocation in EM-USA equity regimes. First, the consistent underperformance of the EM-USA spread benchmark (-4.22% CAR) aligns with the post-1990s era of U.S. equity dominance, confirming the structural shift in relative market performance that has characterized recent decades. However, the momentum-based strategies demonstrate the ability to reverse this underperformance, with both ROC and SMA approaches generating positive alpha across multiple configurations.
Second, the short spread strategy (betting on U.S. outperformance) consistently outperforms the long spread strategy across all metrics, suggesting that the structural regime favoring U.S. equities has been persistent but not constant. This finding aligns with the literature on regime-dependent asset pricing (Bekaert et al., 2017) and suggests that momentum signals can effectively identify periods when the U.S. outperformance regime weakens.
Third, the long-short strategy consistently delivers the strongest performance across both ROC and SMA variants, with the SMA-based composite strategy achieving a remarkable CAR of 7.13% and a Sharpe ratio of 0.564. This outperformance relative to the standalone strategies demonstrates the value of dynamic regime-switching in tactical allocation. The SMA strategy generally outperforms the ROC strategy, particularly in the long-short configuration, suggesting that trend-following based on moving averages provides more robust signals for capturing regime transitions in EM-USA spread dynamics.
Fourth, the composite strategy (averaging across multiple lookback windows) demonstrates superior robustness and risk-adjusted performance compared to single-parameter strategies. This finding supports the theoretical argument that regime transitions occur across multiple time scales and that averaging across these scales enhances strategy resilience. The composite SMA strategy achieves a maximum drawdown of -20.31%, a significant improvement over the non-switching benchmark spread’s -82.31%.
Finally, the performance patterns across lookback windows reveal that intermediate-term momentum (6-12 months) provides the strongest signal for regime identification, consistent with the literature on momentum effects in international markets (Rouwenhorst, 1999). This finding has important implications for practitioners seeking to implement tactical allocation strategies, as it suggests that a focus on intermediate-term momentum signals may provide the optimal balance between signal strength and noise reduction.
Author: Cyril Dujava, Quant Analyst, Quantpedia
Are you looking for more strategies to read about? Sign up for our newsletter or visit our Blog or Screener.
Do you want to learn more about Quantpedia Premium service? Check how Quantpedia works, our mission and Premium pricing offer.
Do you want to learn more about Quantpedia Pro service? Check its description, watch videos, review reporting capabilities and visit our pricing offer.
Are you looking for historical data or backtesting platforms? Check our list of Algo Trading Discounts.
Or follow us on:
Facebook Group, Facebook Page, Twitter, Linkedin, Medium or Youtube
Share onLinkedInTwitterFacebookRefer to a friend


