Exploiting Mean-Reversion in Decentralized Prediction Markets: Evidence from Polymarket Binary Contracts
This study examines the profitability of mean-reversion trading strategies applied to binary outcome contracts on Polymarket, the world’s largest decentralized prediction market platform. We analyze three distinct contracts representing varying risk profiles: a quasi-risk-free instrument (No to “Will Jesus Christ return in 2025?”) and two high-yield speculative contracts (No to “Will China invade Taiwan in 2025?” and “Will the US confirm that aliens exist in 2025?”). Using high-frequency price data sampled at 10-minute intervals over approximately one year, we implement a parameterized mean-reversion framework across twelve strategy variants, testing robustness under varying liquidity constraints and transaction cost assumptions. Our findings reveal that while mean-reversion signals generate substantial alpha under passive limit-order execution (zero-spread scenario), strategy performance degrades significantly when more aggressive market orders are accounted for.
1. Introduction
Prediction markets have evolved from academic curiosities into sophisticated financial instruments capable of aggregating dispersed information across global participant pools. Polymarket, operating on blockchain infrastructure with cryptocurrency settlement, has emerged as the dominant platform in this space, processing over $2.4 billion in transaction volume during the 2024 U.S. presidential election cycle alone (Clinton & Huang, 2025). Unlike traditional securities markets, prediction market contracts settle at binary outcomes (typically $0 or $1, or equivalently 0¢ or 100¢), creating unique microstructural dynamics that warrant systematic investigation.
The central research question of this study is not to determine the true probability of a contract resolving to “Yes” or “No” (i.e., contract identification), but rather to evaluate whether systematic mean-reversion strategies can extract risk-adjusted returns once a directional mispricing thesis is already established. Specifically, conditional on identifying a contract that appears undervalued—such that the implied probability deviates from our prior belief about its terminal outcome—we investigate whether transient deviations from equilibrium prices, driven by sentiment shocks, liquidity imbalances, or information asymmetry, can be systematically exploited via an averaging-down (reversal) approach. This framework focuses on the dynamic trading of mispriced contracts during their price discovery phase, aligning with the broader statistical arbitrage literature while accounting for the distinctive characteristics of binary outcome instruments.
We structure our analysis around three contracts exhibiting fundamentally different risk-return profiles. The “Jesus” contract functions effectively as a risk-free asset, displaying minimal volatility and a high probability of par settlement. In contrast, the “China” and “Alien” contracts resemble high-yield corporate bonds (or “junk bonds” in fixed-income parlance), characterized by elevated volatility, wider bid-ask spreads, and greater settlement uncertainty. This tripartite framework allows us to examine how strategy performance varies across the risk spectrum while controlling for market microstructure effects.
2. Literature Review
2.1 Prediction Market Efficiency and Accuracy
The efficiency of prediction markets has been a subject of academic inquiry since the establishment of the Iowa Electronic Markets in the 1980s. Recent scholarship has focused extensively on Polymarket’s performance during high-profile events, particularly the 2024 U.S. presidential election. Clinton and Huang (2025) analyzed over 2,500 political prediction markets across four platforms, finding that while 93% of PredictIt markets correctly predicted outcomes better than chance, accuracy fell to 78% on Kalshi and 67% on Polymarket. Critically, they documented limited evidence of informational efficiency: prices for identical contracts diverged across exchanges, daily price changes exhibited weak or negative autocorrelation, and arbitrage opportunities peaked in the final two weeks before event resolution.
Complementary research by Cordoba Otalora and Themistocleous (2025) developed the Decentralized Prediction Market Voter Framework (DPMVF) to quantify lead-lag relationships between Polymarket prices and traditional polling data. Their analysis revealed that Polymarket served as a leading indicator in certain swing states, with price trends preceding polling shifts by up to 14 days and cross-correlations reaching 0.988. However, predictive power varied significantly across jurisdictions, suggesting that market efficiency is context-dependent rather than universal.
McCullough’s independent analysis, widely cited in industry publications, reported that Polymarket achieved approximately 90% accuracy in predicting outcomes one month before event resolution, rising to 94% in the immediate pre-settlement period (CoinMarketCap, 2025). This temporal improvement in forecasting accuracy has important implications for trading strategy design, as it suggests that late-stage positions may offer superior risk-adjusted returns compared to early entry.
2.2 Mean-Reversion Trading Strategies
Mean-reversion strategies occupy a prominent position in the quantitative finance literature, with applications spanning equities, fixed income, commodities, and foreign exchange. The fundamental premise—that prices tend to revert to some equilibrium level following transient deviations—has been validated across numerous asset classes and time horizons. In the context of prediction markets, mean-reversion takes on distinctive characteristics. Binary contracts with fixed settlement values create natural anchors for reversion targets, while finite time-to-resolution introduces path dependence that is absent in perpetual securities.
3. Data and Methodology
3.1 Data Collection
Price data were obtained via Polymarket’s internal APIs by our development team, exported in flat CSV format with date and price columns sampled at 10-minute intervals. The observation period spans approximately one year, with slight variations across contracts due to launch dates and settlement timing.
Abovementioned and further-to-be-used shortened names (“Jesus”, “China”, “Alien”) correspond to the following contracts with firmly defined bet question:
- Will Jesus Christ return in 2025?
- Will China invade Taiwan in 2025?
- Will the US confirm that aliens exist in 2025?
Table 1 summarizes the temporal coverage for each instrument.
Table 1: Data Coverage by Contract
| Contract | Start Date | End Date | Duration (years) | Observations |
|---|---|---|---|---|
| Jesus | 2025-03-20 | 2026-01-01 | 0.78 | 41,218 |
| China | 2025-01-29 | 2026-01-01 | 0.92 | 48,554 |
| Alien | 2024-12-31 | 2026-01-01 | 1.00 | 52,597 |
3.2 Data Preprocessing
Visual inspection of the raw data revealed outliers skewing the visualization, particularly significant anomalies toward the end of 2025 (November period). These faulty data points were interpolated using Python’s ffill() (forward-fill) method from the pandas library, which propagates the last valid observation forward to fill gaps. This approach preserves the temporal structure of the data while mitigating the impact of spurious price ticks that likely resulted from API transmission errors or temporary liquidity dislocations.
3.3 Strategy Framework
We implement a parameterized mean-reversion strategy defined by two hyperparameters:
- X(d): Lookback window (days) for computing the rolling minimum price threshold
- Y(d): Holding period (days) before mandatory position exit
The strategy operates as follows:
- Compute the X-day rolling minimum of contract prices
- Generate long signals when the current price falls at or below the X-day rolling minimum
- Hold position for exactly Y days before automatic exit
- Reinvest full capital upon each signal generation (no position overlap)
Twelve strategy variants were tested, representing all combinations of X ∈ {5, 10, 20} and Y ∈ {1, 2, 3, 5}. This grid search approach allows us to identify optimal parameter configurations while assessing robustness across the parameter space.
3.4 Transaction Cost Modeling
We evaluate strategy performance under two friction scenarios:
- Zero-Spread Model: Assumes passive limit-order execution with no transaction costs. This represents an upper bound on achievable performance and approximates the theoretical maximum alpha available from the signal.
- 10-Basis-Point Spread Model: Assumes 0.1% per-trade friction, representing a realistic estimate of combined fees and slippage costs. This scenario approximates aggressive market-order execution, limit order of the position with significant size or passive execution during periods of elevated volatility.
Spread estimation methodology employed 4-hour rolling windows, computing (high - low) / low for each window. This approach captures intraday volatility more accurately than daily measures while avoiding the noise inherent in minute-level estimates. Percentile distributions of estimated spreads are presented in Section 5.
3.5 Performance Metrics
Strategy performance is evaluated using standard quantitative finance metrics:
- CAR (CAGR): Compound Annual Return, annualized for cross-strategy comparability
- Annualized Volatility: Standard deviation of daily returns, scaled to annual frequency
- Sharpe Ratio: Risk-adjusted return metric (assuming 0% risk-free rate)
- Maximum Drawdown: Peak-to-trough decline in portfolio value
- Calmar Ratio: CAR divided by Maximum Drawdown, measuring return per unit of tail risk
Note: Total Return was annualized to yearly CAR (CAGR) for all strategies to facilitate comparison across varying observation periods.
4. Benchmark Analysis
4.1 Buy-and-Hold Performance
Before evaluating active strategy performance, we establish benchmark returns for passive buy-and-hold (B&H) positions in each contract. Table 2 presents benchmark metrics across all three instruments.
Table 2: Benchmark (Buy-and-Hold) Performance
| Contract | CAR | Ann. Vol. | Sharpe | Max DD | Calmar |
|---|---|---|---|---|---|
| Jesus | +5.98% | 5.86% | +1.02 | -2.37% | +2.52 |
| China | +12.69% | 49.19% | +0.26 | -24.29% | +0.52 |
| Alien | +8.63% | 44.18% | +0.20 | -21.94% | +0.39 |
The Jesus contract exhibits characteristics consistent with a low-risk instrument: modest returns, low volatility, and favorable risk-adjusted metrics. The China and Alien contracts, by contrast, display high-yield characteristics with substantially elevated volatility and drawdown profiles. Notably, the Sharpe ratios for both high-yield contracts fall below 0.30.
5. Results
5.1 Jesus Contract: Zero-Spread Scenario
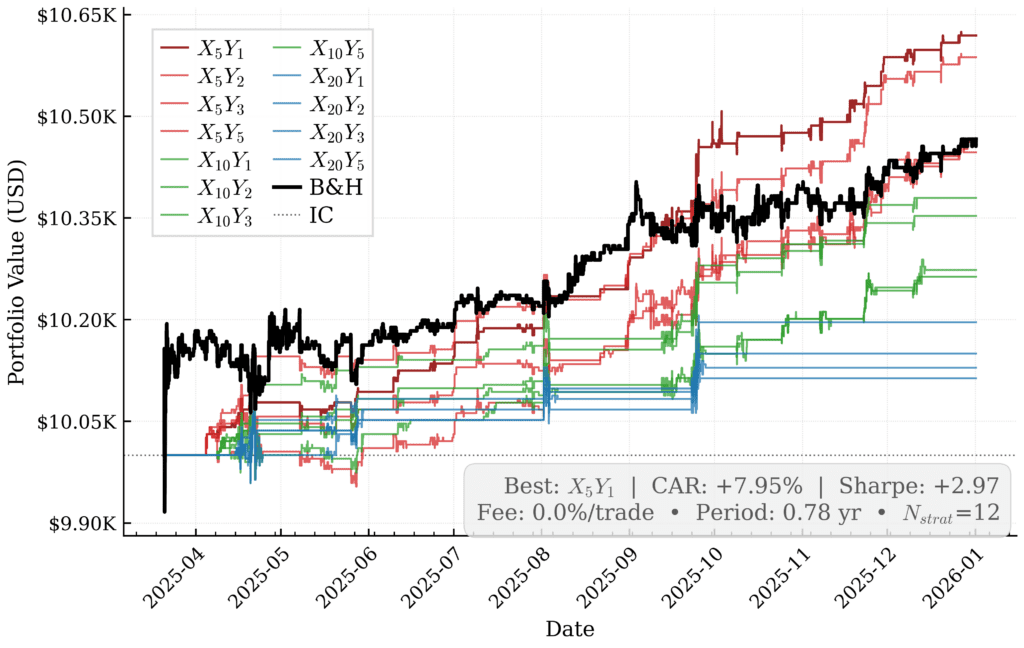
Table 3 presents performance metrics for all twelve strategy variants applied to the Jesus contract under the zero-spread assumption.
Table 3: Jesus Strategy Performance (0% Friction)
| X(d) | Y(d) | CAR | Ann. Vol. | Sharpe | Max DD | Calmar |
|---|---|---|---|---|---|---|
| 5 | 1 | +7.95% | 2.68% | +2.97 | -0.61% | +13.14 |
| 5 | 2 | +7.54% | 2.86% | +2.63 | -0.51% | +14.77 |
| 5 | 5 | +5.92% | 3.55% | +1.67 | -1.08% | +5.49 |
| 5 | 3 | +5.73% | 3.35% | +1.71 | -0.93% | +6.18 |
| 10 | 2 | +4.86% | 2.35% | +2.07 | -0.61% | +8.03 |
| 10 | 1 | +4.52% | 2.14% | +2.11 | -0.61% | +7.46 |
| 10 | 5 | +3.49% | 3.01% | +1.16 | -0.93% | +3.77 |
| 10 | 3 | +3.37% | 2.81% | +1.20 | -0.93% | +3.63 |
| 20 | 1 | +2.50% | 1.70% | +1.48 | -0.61% | +4.13 |
| 20 | 2 | +1.91% | 1.83% | +1.04 | -0.67% | +2.85 |
| 20 | 5 | +1.65% | 2.44% | +0.68 | -0.93% | +1.77 |
| 20 | 3 | +1.45% | 2.23% | +0.65 | -0.93% | +1.56 |
| B&H | — | +5.98% | 5.86% | +1.02 | -2.37% | +2.52 |
Notes: CAR = Compound Annual Return (annualized). Sharpe Ratio assumes 0% risk-free rate. Calmar Ratio = CAR / Max DD.
The shortest lookback windows (X=5) consistently outperform longer horizons, with X5_Y1 achieving the highest Sharpe ratio (+2.97) and X5_Y2 delivering the optimal Calmar ratio (+14.77). All twelve variants exceed the benchmark Sharpe ratio, indicating that mean-reversion signals add value even in this low-volatility environment.
5.2 Jesus Contract: 10 Basis Point Spread Scenario
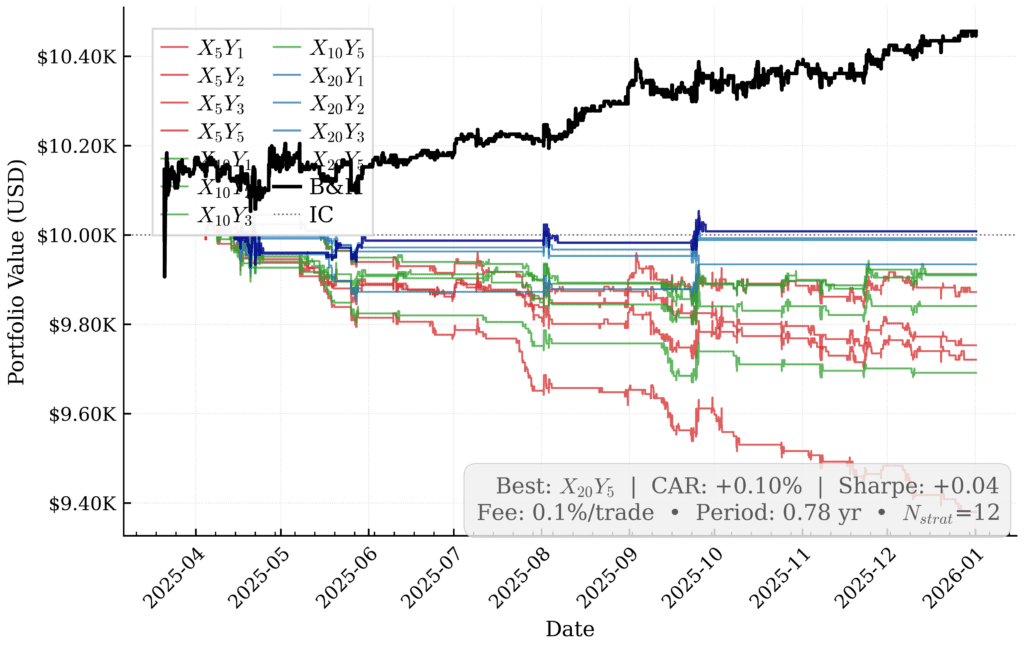
Table 4 presents the same strategy variants under the 10 bps per-trade friction assumption.
Table 4: Jesus Strategy Performance (0.1% Per-Trade Fee)
| X(d) | Y(d) | CAR | Ann. Vol. | Sharpe | Max DD | Calmar |
|---|---|---|---|---|---|---|
| 20 | 5 | +0.10% | 2.47% | +0.04 | -0.93% | +0.11 |
| 20 | 3 | -0.09% | 2.26% | -0.04 | -1.07% | -0.09 |
| 20 | 2 | -0.15% | 1.90% | -0.08 | -0.87% | -0.17 |
| 20 | 1 | -0.84% | 1.82% | -0.46 | -1.49% | -0.56 |
| 10 | 2 | -1.11% | 2.48% | -0.45 | -2.02% | -0.55 |
| 10 | 5 | -1.15% | 3.09% | -0.37 | -1.72% | -0.67 |
| 5 | 5 | -1.63% | 3.65% | -0.45 | -2.03% | -0.80 |
| 10 | 3 | -2.02% | 2.91% | -0.70 | -2.15% | -0.94 |
| 5 | 2 | -3.14% | 3.06% | -1.03 | -3.25% | -0.96 |
| 5 | 3 | -3.55% | 3.50% | -1.01 | -3.30% | -1.08 |
| 10 | 1 | -3.92% | 2.36% | -1.66 | -3.30% | -1.19 |
| 5 | 1 | -7.83% | 3.01% | -2.60 | -6.40% | -1.22 |
| B&H | — | +5.84% | 5.86% | +1.00 | -2.37% | +2.46 |
Notes: The fee structure is 0.1% per trade (0.2% round-trip).
The performance degradation is stark. Only one variant (X20_Y5) generates positive returns, and the previously optimal X5_Y1 strategy becomes the worst performer with a -7.83% CAR. This reversal highlights the critical importance of transaction cost modeling: strategies with high turnover (short X, low Y) suffer disproportionately from friction costs, whereas longer-horizon variants remain marginally viable.
5.3 China Contract: Zero-Spread Scenario
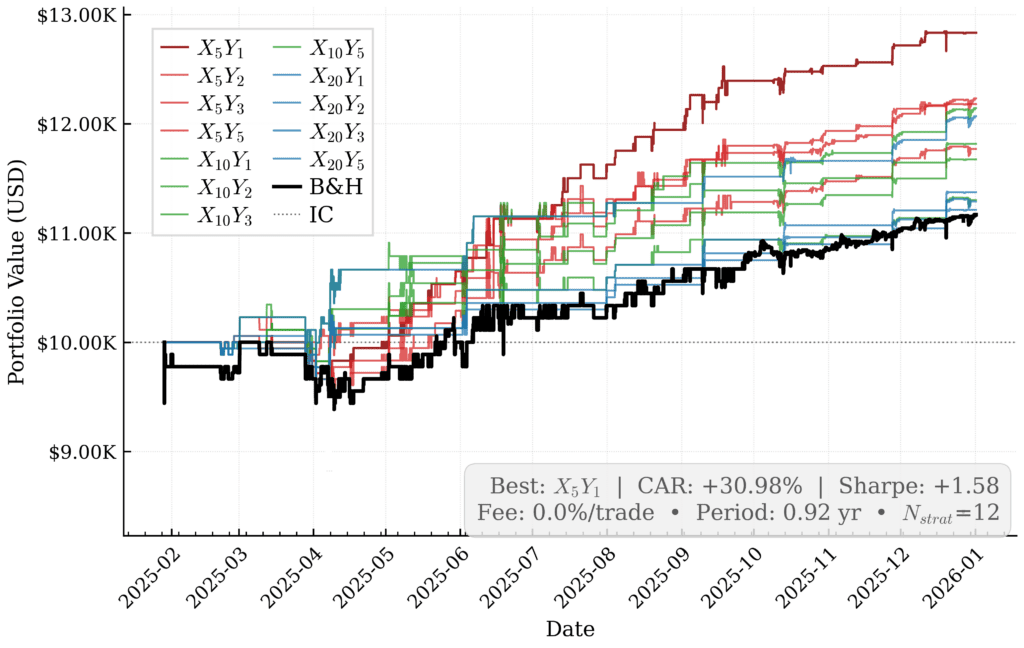
Table 5: China Strategy Performance (0% Friction)
| X(d) | Y(d) | CAR | Ann. Vol. | Sharpe | Max DD | Calmar |
|---|---|---|---|---|---|---|
| 5 | 1 | +30.98% | 19.64% | +1.58 | -13.55% | +2.29 |
| 5 | 5 | +24.36% | 21.75% | +1.12 | -12.02% | +2.03 |
| 5 | 2 | +23.79% | 19.99% | +1.19 | -13.55% | +1.76 |
| 10 | 5 | +23.39% | 14.02% | +1.67 | -4.50% | +5.20 |
| 20 | 5 | +22.57% | 9.65% | +2.34 | -3.42% | +6.61 |
| 10 | 1 | +19.79% | 11.53% | +1.72 | -4.51% | +4.39 |
| 5 | 3 | +19.27% | 20.70% | +0.93 | -14.03% | +1.37 |
| 10 | 2 | +18.23% | 11.95% | +1.53 | -4.51% | +4.04 |
| 20 | 1 | +14.93% | 6.79% | +2.20 | -4.52% | +3.30 |
| 10 | 3 | +14.15% | 12.48% | +1.13 | -5.06% | +2.80 |
| 20 | 3 | +14.01% | 8.07% | +1.74 | -3.97% | +3.53 |
| 20 | 2 | +13.17% | 7.44% | +1.77 | -3.42% | +3.86 |
| B&H | — | +12.69% | 49.19% | +0.26 | -24.29% | +0.52 |
The China contract exhibits substantially higher return potential than Jesus, with the optimal strategy (X5_Y1) generating +30.98% CAR versus +12.69% for buy-and-hold. Notably, longer lookback windows (X=20) paired with higher thresholds (Y=5) achieve superior risk-adjusted returns (X20_Y5: Sharpe +2.34, Calmar +6.61), suggesting that patient capital is rewarded in this higher-volatility environment.
5.4 China Contract: 10 Basis Point Spread Scenario

Table 6: China Strategy Performance (0.1% Per-Trade Fee)
| X(d) | Y(d) | CAR | Ann. Vol. | Sharpe | Max DD | Calmar |
|---|---|---|---|---|---|---|
| 20 | 5 | +18.91% | 9.67% | +1.96 | -3.99% | +4.73 |
| 10 | 5 | +16.63% | 14.04% | +1.18 | -5.26% | +3.16 |
| 5 | 5 | +13.55% | 21.78% | +0.62 | -13.24% | +1.02 |
| 20 | 3 | +9.89% | 8.10% | +1.22 | -4.74% | +2.09 |
| 20 | 2 | +8.14% | 7.50% | +1.09 | -5.23% | +1.56 |
| 10 | 2 | +7.95% | 12.02% | +0.66 | -6.41% | +1.24 |
| 20 | 1 | +6.78% | 6.88% | +0.99 | -7.99% | +0.85 |
| 10 | 3 | +6.28% | 12.52% | +0.50 | -6.00% | +1.05 |
| 5 | 2 | +5.92% | 20.05% | +0.30 | -17.22% | +0.34 |
| 5 | 3 | +5.65% | 20.75% | +0.27 | -16.52% | +0.34 |
| 10 | 1 | +2.95% | 11.64% | +0.25 | -9.73% | +0.30 |
| 5 | 1 | -0.08% | 19.76% | -0.00 | -20.95% | -0.00 |
| B&H | — | +12.57% | 49.19% | +0.26 | -24.29% | +0.52 |
Even under friction, the China contract retains substantial alpha potential. The X20_Y5 variant achieves a +18.91% CAR with a +1.96 Sharpe ratio, significantly outperforming the buy-and-hold benchmark (+12.57% CAR, +0.26 Sharpe). However, the high-turnover X5_Y1 strategy that dominated in the zero-spread scenario becomes unprofitable, reinforcing the turnover-friction tradeoff.
5.5 Alien Contract: Zero-Spread Scenario

Table 7: Alien Strategy Performance (0% Friction)
| X(d) | Y(d) | CAR | Ann. Vol. | Sharpe | Max DD | Calmar |
|---|---|---|---|---|---|---|
| 5 | 2 | +33.33% | 19.41% | +1.72 | -11.54% | +2.89 |
| 5 | 3 | +32.77% | 20.04% | +1.64 | -11.54% | +2.84 |
| 5 | 1 | +30.00% | 18.45% | +1.63 | -11.54% | +2.60 |
| 10 | 5 | +28.34% | 17.95% | +1.58 | -11.05% | +2.57 |
| 10 | 3 | +23.10% | 16.80% | +1.37 | -11.05% | +2.09 |
| 10 | 2 | +20.79% | 17.07% | +1.22 | -11.05% | +1.88 |
| 5 | 5 | +20.05% | 20.58% | +0.97 | -12.97% | +1.55 |
| 20 | 5 | +19.61% | 7.97% | +2.46 | -3.19% | +6.15 |
| 10 | 1 | +16.60% | 16.09% | +1.03 | -11.05% | +1.50 |
| 20 | 3 | +16.43% | 7.49% | +2.19 | -3.34% | +4.91 |
| 20 | 2 | +15.68% | 7.13% | +2.20 | -2.73% | +5.75 |
| 20 | 1 | +14.70% | 6.63% | +2.22 | -2.88% | +5.10 |
| B&H | — | +8.63% | 44.18% | +0.20 | -21.94% | +0.39 |
The Alien contract delivers the highest absolute returns among the three instruments, with X5_Y2 achieving a +33.33% CAR. Risk-adjusted metrics favor longer lookback windows (X20_Y5: Sharpe +2.46, Calmar +6.15), consistent with the pattern observed in the China contract.
5.6 Alien Contract: 10 Basis Point Spread Scenario
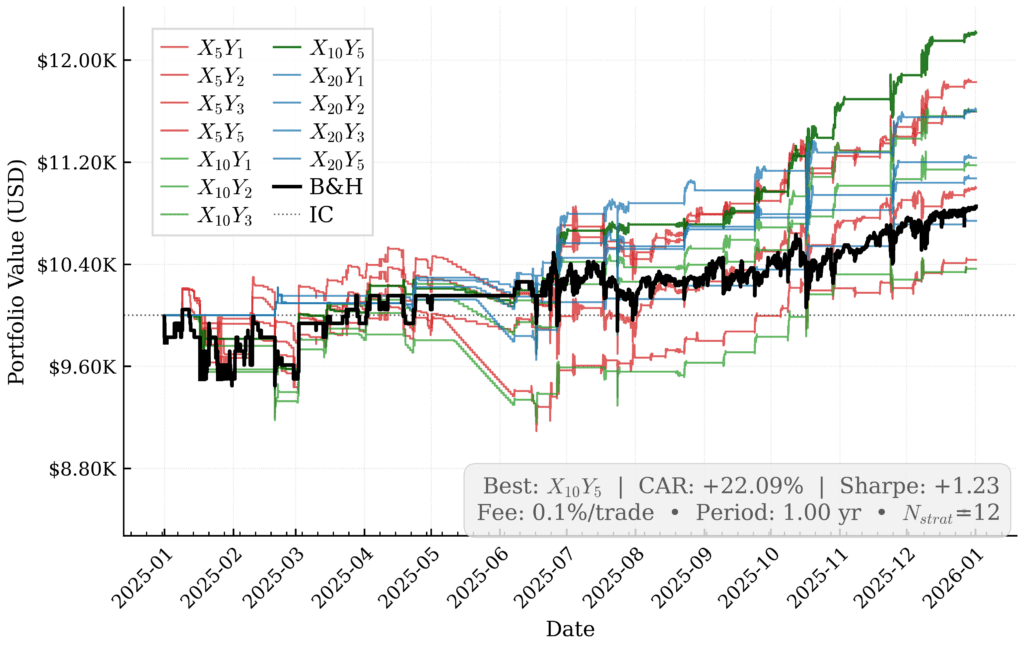
Table 8: Alien Strategy Performance (0.1% Per-Trade Fee)
| X(d) | Y(d) | CAR | Ann. Vol. | Sharpe | Max DD | Calmar |
|---|---|---|---|---|---|---|
| 10 | 5 | +22.09% | 17.97% | +1.23 | -11.14% | +1.98 |
| 5 | 3 | +18.24% | 20.08% | +0.91 | -11.89% | +1.53 |
| 20 | 5 | +16.07% | 7.99% | +2.01 | -3.38% | +4.75 |
| 10 | 3 | +15.94% | 16.82% | +0.95 | -11.14% | +1.43 |
| 5 | 2 | +15.92% | 19.46% | +0.82 | -11.89% | +1.34 |
| 20 | 3 | +12.32% | 7.54% | +1.63 | -3.54% | +3.48 |
| 10 | 2 | +11.74% | 17.10% | +0.69 | -11.32% | +1.04 |
| 20 | 2 | +10.70% | 7.16% | +1.49 | -3.25% | +3.30 |
| 5 | 5 | +9.94% | 20.61% | +0.48 | -13.15% | +0.76 |
| 20 | 1 | +7.38% | 6.71% | +1.10 | -4.77% | +1.55 |
| 5 | 1 | +4.34% | 18.53% | +0.23 | -12.24% | +0.35 |
| 10 | 1 | +3.63% | 16.14% | +0.23 | -11.49% | +0.32 |
| B&H | — | +8.52% | 44.18% | +0.19 | -21.94% | +0.39 |
Under friction, the Alien contract maintains robust profitability across most variants. The optimal strategy (X10_Y5) achieves +22.09% CAR with a +1.23 Sharpe ratio, representing a 2.6x improvement over buy-and-hold on a risk-adjusted basis.
5.7 Estimated Spread Distributions
Table 9 presents percentile distributions of estimated 4-hour spreads for each contract, derived from the (high - low) / low methodology described in Section 3.4, further exhibited on time-dependent spread distribution plot figures.
Table 9: Estimated Spread Percentiles by Contract
| Percentile | Jesus | China | Alien |
|---|---|---|---|
| 10% | 0.00% | 0.00% | 0.00% |
| 25% | 0.00% | 0.00% | 0.00% |
| 50% | 0.00% | 0.00% | 0.05% |
| 75% | 0.05% | 0.15% | 0.26% |
| 90% | 0.15% | 0.56% | 0.63% |
| 95% | 0.21% | 1.09% | 1.13% |
| 99% | 0.36% | 1.18% | 1.65% |
| 99.9% | 0.63% | 2.21% | 12.42% |

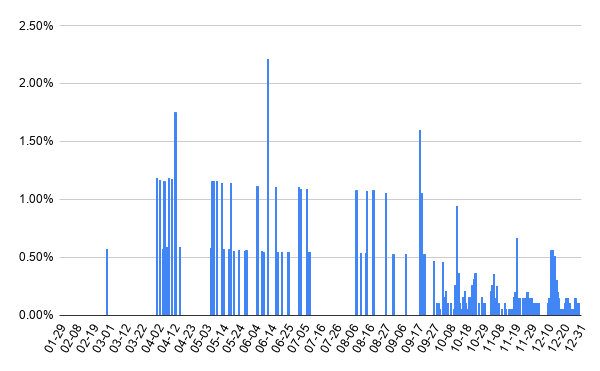
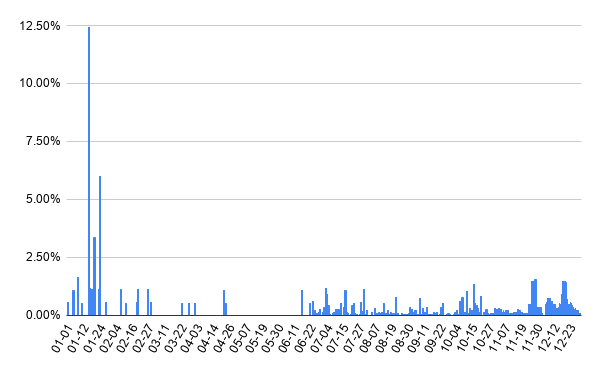
The Jesus contract exhibits the tightest spreads (median 0.00%, 99th percentile 0.36%), consistent with its characterization as a quasi-risk-free instrument. China and Alien contracts display progressively wider distributions, with Alien exhibiting extreme tail risk (99.9th percentile: 12.42%). These distributions validate our 10 bps friction assumption as conservative for Jesus, but potentially optimistic for China and Alien during periods of stress.
6. Discussion & Conclusion
6.1 Transaction Cost Sensitivity
The most salient finding from this analysis is the extreme sensitivity of mean-reversion strategy performance to transaction cost assumptions. In the Jesus contract, the optimal zero-spread strategy (X5_Y1: Sharpe +2.97) becomes the worst performer under 10 bps friction (Sharpe -2.60). This 5.57-point degradation in risk-adjusted returns underscores that high-turnover strategies, while theoretically attractive, may be economically unviable in practice.
The China and Alien contracts demonstrate greater resilience to friction costs, likely because their higher intrinsic volatility yields larger signal-to-noise ratios. However, even in these instruments, the turnover-friction trade-off is evident: strategies with shorter lookback windows and lower holding periods consistently underperform their longer-horizon counterparts when transaction costs are accounted for.
6.2 Optimal Parameter Selection
Across all three contracts and both friction scenarios, strategies with X=20 and Y=5 consistently rank among the top performers on risk-adjusted metrics. This pattern suggests that patient capital—waiting for larger deviations before entering positions and extending holding periods—is rewarded in prediction markets. The economic intuition is straightforward: larger deviations are more likely to represent genuine mispricing rather than noise, and lower turnover reduces friction cost drag.
6.3 Practical Implementation Considerations
Practitioners considering deployment of mean-reversion strategies in prediction markets should attend to several implementation details:
- Execution Venue: Passive limit-order placement is essential for profitability. Market-order execution at prevailing spreads would likely eliminate alpha entirely for high-turnover variants.
- Position Sizing: Maximum drawdowns ranging from 3% to 21% across strategy variants warrant careful capital allocation. The Calmar ratio provides a useful metric for comparing return per unit of tail risk.
- Monitoring Requirements: Spread distributions exhibit fat tails, particularly for high-yield contracts. Real-time monitoring of liquidity conditions is advisable to avoid execution during periods of dislocation.
- Settlement Risk: Binary contracts carry a non-zero probability of unexpected settlement outcomes. Diversification across multiple (ideally up to 100) contracts and events is must.
Author: Cyril Dujava, Quant Analyst, Quantpedia
Are you looking for more strategies to read about? Sign up for our newsletter or visit our Blog or Screener.
Do you want to learn more about Quantpedia Premium service? Check how Quantpedia works, our mission and Premium pricing offer.
Do you want to learn more about Quantpedia Pro service? Check its description, watch videos, review reporting capabilities and visit our pricing offer.
Are you looking for historical data or backtesting platforms? Check our list of Algo Trading Discounts.
Or follow us on:
Facebook Group, Facebook Page, Twitter, Linkedin, Medium or Youtube
References
Clinton, J. D., & Huang, T. (2025). Prediction markets? The accuracy and efficiency of $2.4 billion in the 2024 presidential election. SocArXiv. https://doi.org/10.31219/osf.io/d5yx2_v1
CoinMarketCap. (2025, March 24). Polymarket achieves 94% accuracy in predicting events, new research finds. CoinMarketCap Academy. https://coinmarketcap.com/academy/article/polymarket-achieves-94percent-accuracy-in-predicting-events-new-research-finds
Cordoba Otalora, F., & Themistocleous, M. (2025). Beyond the polls: Quantifying early signals in decentralized prediction markets with cross-correlation and dynamic time warping. Future Internet, 17(11), 487. https://doi.org/10.3390/fi17110487
Share onLinkedInTwitterFacebookRefer to a friend


