Quantpedia Update – 2nd March 2018

2.March 2018

Four new strategies have been added:

#378 – Momentum Factor in Cryptocurrencies
#379 – Carry Factor in Cryptocurrencies
#380 – Value Factor in Cryptocurrencies
#381 – Blended Factors in Cryptocurrencies

One new related research paper has been included into existing strategy reviews. And two additional related research papers have been included into existing free strategy reviews during last 2 weeks.

Continue reading

Systematic Interventions of Central Banks and Major Currency Risk Factors

1.March 2018

Related to all major currency risk premiums:

#5 – FX Carry Trade
#8 – FX Momentum
#9 –
FX Value – PPP Strategy

Authors: Fratzcher, Menkhoff, Sarno, Schmeling, Stoehr

Title: Systematic Intervention and Currency Risk Premia

Link: https://papers.ssrn.com/sol3/papers.cfm?abstract_id=3119907

Abstract:

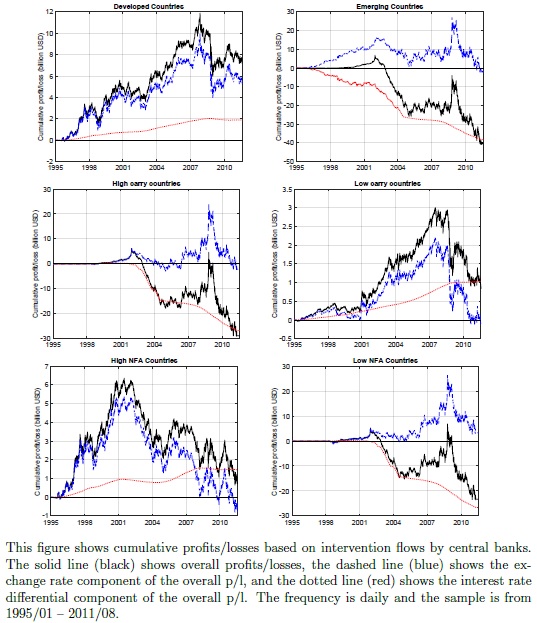
Using data for the trades of 19 central banks intervening in currency markets, we show that leaning against the wind by individual central banks leads to "systematic intervention" in the aggregate central banking sector. This systematic intervention is driven by and impacts on the same factors that drive currency excess returns: carry, momentum, value, and a dollar factor. The sensitivity of an individual central bank's intervention to these factors differs markedly across countries, with developed countries making a profit from intervention and emerging markets incurring large losses.

Notable quotations from the academic research paper:

"A large literature has documented that the cross-section of currency excess returns is predictable, and that currency risk premia can be captured through straightforward investment strategies. These includes, inter alia, carry trades that buy high interest rate currencies and sell low interest rate currencies, dollar strategies that short the US dollar (USD) and buy a diversi fied portfolio of foreign currencies, momentum strategies that buy currencies that appreciated in the recent past and short those that depreciated in the recent past, and value strategies that buy undervalued currencies and sell overvalued currencies.

However, the FX market is populated by a large and diverse set of players, some of which are not necessarily motivated by getting exposure to these risk factors or by profi ting through FX trading, most notably central banks.

From a nance perspective, a number of interesting questions arise in this market setting in relation to whether and how central bank intervention across countries is related to the factors that drive the cross-section of currency excess returns: Are aggregate central bank interventions driven by the same set of factors that drive exchange rates? Do the trading actions of central banks, i.e., their FX intervention flows, aff ect currency risk premia and, if so, do they increase or decrease excess returns from popular currency strategies? Do central banks profi t or lose money from their intervention operations? These are the questions that we address in this paper.

We tackle these questions empirically using the data on daily sterilized interventions in the FX market. Speci cally, we use a subset of their data since we study interventions against the US dollar (USD) only, and we limit the sample of currencies to countries with (relatively) flexible exchange rate regimes and few or no capital controls. We study a cross-section of interventions in 19 exchange rates (all against the USD) by aggregating the interventions of the 19 associated central banks over the sample from 1995 to 2011.

We find that:

(i) there is a strong factor structure in interventions, which we call "systematic intervention", that is closely related to the factor structure in exchange rates;

(ii) central banks tend to intervene in support of a factor (carry, momentum, value, and/or dollar) when returns to that factor are low and vice versa;

(iii) as a corollary, central bank interventions are signi ficantly di fferent across di fferent market states;

(iv) there are signi ficant di fferences across country subgroups (developed versus emerging markets, high versus low interest rate countries, high versus low net foreign asset positions);

(v) emerging countries lose money on their intervention activity and the bulk of these losses is driven by the hefty interest rate di fferential they face when they sell their currencies to buy the USD;

(vi) a simple price impact analysis suggests that global, systematic interventions by the aggregate central banking sector are large enough to move exchange rates by a signi ficant amount and, for example, interventions to support carry in the aftermath of the global fi nancial crisis lifted carry returns by about 5 percent.

pic1

Conditional analysis reveals that in normal times, which are typically characterized by normal or relatively low volatility and positive carry trade returns, central banks trade against carry, whereas in bad times when carry returns typically fall sharply, there is systematic intervention in support of carry (high interest currencies). These e ffects are particularly strong for emerging markets, countries with high interest rates, and countries with low net foreign asset positions. In essence, the "leaning against the wind" nature of intervention activities curbs carry profi ts for the investment community during good times, but helps reducing the carry losses in bad times, e ffectively smoothing carry returns. A similar mechanism applies to the other factors. Speci fically, systematic intervention is almost always against momentum and the dollar factor (i.e., the central banking sector is a net buyer of the US dollar), but this e ffect is much stronger in terms of intervention amounts at times of market turmoil. Hence, from the viewpoint of these factors, central banks don't just lean against momentum but also against the carry and dollar factor. Finally, systematic intervention is almost always in the direction of value (i.e., the central banking sector tends to act to curb exchange rate misalignments), but this e ffect is much more pronounced at times of market turmoil."


Are you looking for more strategies to read about? Check http://quantpedia.com/Screener

Do you want to see performance of trading systems we described? Check http://quantpedia.com/Chart/Performance

Do you want to know more about us? Check http://quantpedia.com/Home/About

Continue reading

Mixed Copula Pairs Trading Strategy

21.February 2018

A new financial research paper related to:

#12 – Pairs Trading with Stocks

Authors: da Silva, Ziegelman, Caldeira

Title: Pairs Trading: Optimizing via Mixed Copula versus Distance Method for S&P 500 Assets

Link: https://papers.ssrn.com/sol3/papers.cfm?abstract_id=3070950

Abstract:

We carry out a study to evaluate and compare the relative performance of the distance and mixed copula pairs trading strategies. Using data from the S&P 500 stocks from 1990 to 2015, we find that the mixed copula strategy is able to generate a higher mean excess return than the traditional distance method under different weighting structures when the number of tradeable signals is equiparable. Particularly, the mixed copula and distance methods show a mean annualized value-weighted excess returns after costs on committed and fully invested capital as high as 3.98% and 3.14% and 12.73% and 6.07%, respectively, with annual Sharpe ratios up to 0.88. The mixed copula strategy shows positive and significant alphas during the sample period after accounting for various risk-factors. We also provide some evidence on the performance of the strategies over different market states.

Notable quotations from the academic research paper:

"Currently, there are three main approaches for pairs trading: distance, cointegration and copula. The traditional distance method has been widely researched and tested throughout the pairs trading literature. However, this approach only captures dependencies well in the case of elliptically distributed random variables. This assumption is generally not met in practice, motivating the utilization of copula-based models to address the univariate and multivariate stylized facts for multivariate financial return stocks. Nevertheless, the use of copulas in this context is still recent and needs more comprehensive and profound studies.

In this paper, we will conduct an empirical investigation to offer some evidence of the behavior of the distance and mixed copula strategies. We propose, differently from Rad, Low, and Faff (2016) and Xie, Liew, Wu, and Zou (2016), a mixed copula-based strategy to capture linear and nonlinear associations and at the same time cover a wider range of possible dependence structures. We aim to assess whether building a more sophisticated model can take advantage of any market frictions or anomalies uncovering relationships and patterns. We find that the mixture copula strategy is able to generate a higher mean excess return than the distance method when the number of trading signals is equiparable. We also want to investigate the sensitivity of the copula method to different opening thresholds and how trading costs affect the profitability of these strategies.

Our strategy consists in fitting, initially, the daily returns of the formation period using an ARMA(p,q)- GARCH(1,1) to model the marginals. For each pair, we test the following elliptical and Archimedean copula functions: Gaussian, t, Clayton, Frank, Gumbel, one Archimedean mixture copula consisting of the optimal linear combination of Clayton, Frank and Gumbel copulas and one mixture copula consisting of the optimal linear combination of Clayton, t and Gumbel copulas.

We compare the performance out-of-sample of the strategies using a variety of criteria, all of which are computed using a rolling period procedure similar to that used by Gatev, Goetzmann, and Rouwenhorst (2006) with the exception that the time horizon of formation and trading periods are rolled forward by six months. The main criteria we focus on are: (1) mean and cumulative excess return, (2) risk-adjusted metrics as Sharpe and Sortino ratios, (3) percentage of negative trades, (4) t-values for various risk factors, and (5) maximum drawdown between two consecutive days and between two days within a maximum period of six months.

Figure 3 shows cumulative excess returns through the full dataset for both strategies for Top 5 (top), Top 20 (center) and Top 35 (bottom) pairs. The left panels display cumulative returns on committed capital, whereas the right panels on fully invested capital.

The main findings when the number of trading signals is equiparable are summarized below.

1. The mixed copula strategy is able to generate a higher mean excess return and a Sharpe ratio over twice as much as what we get from investing in the traditional distance method after trading costs.

2. The mixed copula approach delivers economically larger alphas than the distance method for both weighting schemes (10 and 58 bps per month on committed and fully invested capital, respectively) after transaction costs, suggesting the importance of the proposed method. It should also be noted that the alphas provided by mixed copula and distance strategies are significant at 1% and 10%, respectively, after accounting for several asset pricing factors such as momentum, liquidity, profitability and investment. Thus, the results show that the profits are not fully explained by the other factors.

3. As it can be observed, the right-hand-side tail (of positive outcomes) of the density of the five-year Sharpe ratio is longer for the mixed copula strategy, implying that the copula-based strategy has a better risk adjusted performance than the distance approach.

4. The share of days with negative excess returns is smaller for the mixed copula approach (41.79%) than for the distance strategy (46.98%) and the market performance (47.45%).

5. Neither strategy consistently shows superiority over all subperiods, at least on committed capital. Overall, the mixed copula strategy shows a superior out-of-sample performance relative to the distance approach in the second and third subperiods (1996-2000 and 2001-2005) and after the subprime mortgage crisis (2011-2015), while the distance method delivers a significant better performance in the first (1991-1995) and fourth subperiods (2006-2010) on committed capital."


Are you looking for more strategies to read about? Check http://quantpedia.com/Screener

Do you want to see performance of trading systems we described? Check http://quantpedia.com/Chart/Performance

Do you want to know more about us? Check http://quantpedia.com/Home/About

Continue reading

Quantpedia Update – 15th February 2018

14.February 2018

Two new strategies have been added:

#376 – Combining Fundamental FSCORE and Equity Short-Term Reversals
#377 – Trading Futures Using Basis Indicator

One new related research paper has been included into existing strategy reviews. And three additional related research papers have been included into existing free strategy reviews during last 2 weeks.

Continue reading

Price Overreactions in the Cryptocurrency Market

Once again, is cryptocurrency market efficient? Or can we find simple trading strategies based on price overreactions? :

Authors: Caporale, Plastun

Title: Price Overreactions in the Cryptocurrency Market

Link: https://papers.ssrn.com/sol3/papers.cfm?abstract_id=3088472

Abstract:

This paper examines price overreactions in the case of the following cryptocurrencies: BitCoin, LiteCoin, Ripple and Dash. A number of parametric (t-test, ANOVA, regression analysis with dummy variables) and non-parametric (Mann–Whitney U test) tests confirm the presence of price patterns after overreactions: the next-day price changes in both directions are bigger  than after “normal” days. A trading robot approach is then used to establish whether these statistical anomalies can be exploited to generate profits. The results suggest that a strategy based on counter-movements after overreactions is not profitable, whilst one based on inertia appears to be profitable but produces outcomes not statistically different from the random ones. Therefore the overreactions detected in the cryptocurrency market do not give rise to exploitable profit opportunities (possibly because of transaction costs) and cannot be seen as evidence against the Efficient Market Hypothesis (EMH).

Notable quotations from the academic research paper:

"Despite a significant number of studies on market overreactions none of them has focused on the cryptocurrency market, which is the most volatile among financial markets: the average daily price amplitude in this market is more than 10 times higher than in FOREX, 7 times higher than in stock market and more than 5 times higher than in the commodity markets. This feature (combined with the fact that it is a very young market) makes it particularly interesting to examine for possible overreactions.

This paper provides new evidence on the overreaction anomaly in the cryptocurrency market by testing the following two hypotheses: after one-day abnormal price movements (overreactions), on the next day abnormal price (i) counter-movements or (ii) momentum movements are observed. For this purpose, a number of statistical tests (both parametric and non-parametric) are carried out. A trading robot approach is then used to investigate whether any detected anomalies generate exploitable profit opportunities. The analysis is carried out for four different cryptocurrencies (BitCoin, LiteCoin, Ripple and Dash).

Empirical Results: analysis confirms the presence of a statistical anomaly in price dynamics in the cryptocurrency market after overreaction days price changes in both directions (in the direction of overreaction and counter movement) are bigger than after normal days.

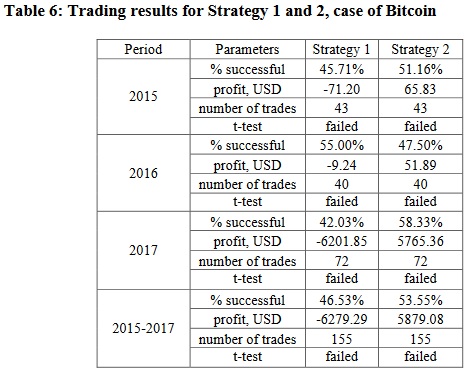
Next we test whether these anomalies can be exploited to make abnormal profits by using a trading robot approach and considering 2 trading strategies. Strategy 1 is based on the standard overreaction anomaly: there are abnormal counter-reactions after the overreaction day. The trading algorithm in this case is specified as follows: the cryptocurrency is sold (bought) on the open price of the day after the overreaction if an abnormal price increase
(decrease) has occurred. The open position is closed at the end of the day when it was opened. Strategy 2 is based on the momentum effect, the so-called “inertia anomaly”: there are abnormal price movements in the direction of the overreaction on the following  day. The trading algorithm is specified as follows: after the overreaction day the cryptocurrency is sold (bought) on the open price of the day after the overreaction if an abnormal price decrease (increase) has occurred. Again, an open position is closed at the end of the day when it was opened.

BitCoin prices are used for the analysis (data availability motivated this choice) for the years 2015, 2016, 2017 in turn and then for the whole period 2015-2017.

As can be seen, the results of Strategy 1 are rather stable and in general imply a lack of exploitable profit opportunities from trading based on counter-movements after overreactions in the cryptocurrency market. This applies to all periods. The t-test statistics indicate that the   results are not significantly different from the random ones (see Appendix F for details); indirect evidence for this is also provided by the number of profitable trades, which is close to 50%. By contrast, Strategy 2 generates profits in each individual year as well as the full sample, but the results are not significantly different from the random ones (as implied by the t-test statistics). The number of profitable trades is close to 50%. Overall, trading based on the “inertia” anomaly cannot be considered profitable."


Are you looking for more strategies to read about? Check http://quantpedia.com/Screener

Do you want to see performance of trading systems we described? Check http://quantpedia.com/Chart/Performance

Do you want to know more about us? Check http://quantpedia.com/Home/About

Continue reading

Low Risk Anomaly in Banking Industry and Its Implications

9.February 2018

Related mainly to #7 – Volatility Effect in Stocks – Long-Only Version:

Authors: Baker, Wurgler

Title: Do Strict Capital Requirements Raise the Cost of Capital? Bank Regulation and the Low Risk Anomaly

Link: https://papers.ssrn.com/sol3/papers.cfm?abstract_id=2967265

Abstract:

Traditional capital structure theory in frictionless and efficient markets predicts that reducing banks’ leverage reduces the risk and cost of equity but does not change the overall weighted average cost of capital (and thus the rates for borrowers). We test these two predictions. We confirm that the equity of better-capitalized banks has lower beta and idiosyncratic risk. However, over the last 40 years, lower risk banks have higher stock returns on a risk-adjusted or even a raw basis, consistent with a stock market anomaly previously documented in other samples. The size of the low risk anomaly within banks suggests that the cost of capital effects of capital requirements is large enough to be relevant to policy discussions. A calibration assuming competitive lending markets suggests that a binding ten percentage-point increase in Tier 1 capital to risk-weighted assets more than doubles banks’ average risk premium over Treasury yields, from 40 to between 100 and 130 basis points per year, and presumably raises rates for borrowers to a similar extent.

Notable quotations from the academic research paper:

"The instability of banks in the financial crisis has reignited debates about capital requirements. One of the ongoing concerns has been that capital requirements might affect banks’ overall cost of capital, and therefore lending rates and economic activity. Many bankers appear to prefer lower capital requirements. They argue that because equity is more expensive than debt, more of it clearly raises the overall cost of capital.

Economists, on the other hand, often view this argument as a fallacy. The textbook Modigliani-Miller logic is articulated by, for example, Admati, DeMarzo, Hellwig, and Pfleiderer (2011): “[B]ecause the increase in capital provides downside protection that reduces shareholders’ risk, shareholders will require a lower expected return to invest in a better capitalized bank”.

Real capital markets contain frictions and inefficiencies that challenge the Modigliani-Miller assumptions, however, so the relevance of the frictionless-irrelevance argument is not so clear. Many of these frictions have been studied, but there has been surprisingly little direct evidence on the basic proposition that reduced leverage reduces the cost of equity. In this paper, we study empirically how leverage has related to the risk and cost of bank equity and, in turn, to the overall cost of capital.

We are especially motivated by the possible interaction of capital requirements and the “low risk anomaly” within the stock market. That is, while stocks have on average earned higher returns than less risky asset classes like corporate bonds, which in turn have earned more than Treasury bonds, recent research emphasizes that the basic risk-return relationship within the stock market has historically been flat, if not inverted.

We use a large sample of historical U.S. data and proceed to test the two steps in the traditional argument. First, we relate bank equity betas estimated from CRSP to leverage ratios from quarterly reports. Second, we relate realized returns on equity to bank equity betas. We also replace beta with idiosyncratic risk. The two steps together then allow us to calibrate the effect of increased capital requirements on the cost of equity and, under certain assumptions, the overall cost of capital. We reach similar conclusions when we relate capital to returns directly over the sample with good data on risk-adjusted capital ratios.

We confirm that bank equity risk is sharply increasing in leverage. This is not surprising, and our work here extends that of Kashyap, Stein, and Hanson (2010). When capital is measured by the Tier 1 capital to risk-weighted assets ratio, the portfolio beta of the least-capitalized banks is 0.93 while the portfolio beta of the most-capitalized banks is 0.50. Higher capital ratios also predict lower idiosyncratic risk. Even this relatively large difference in beta is attenuated by two factors. Banks with riskier assets may choose to have larger capital cushions. This endogenous selection reduces the slope between beta and observed capital ratios.

Does a reduction in beta translate to a reduction in the cost of equity? The answer from 40 years of U.S. stock returns is no. The low risk anomaly is actually a bit stronger within banks than other firms. High-beta banks returned less than low-beta banks, even on a raw basis, and even in a period of mostly rising equity markets. Value-weighted returns are, on average, 16 basis points per month higher for a portfolio of the lowest three beta deciles than for a portfolio of the highest three beta deciles. The spread between low and high idiosyncratic risk portfolios is 6 basis points per month. These effects are not mediated by capitalization. Controlling for a size factor increases the risk-adjusted differences, especially for idiosyncratic risk portfolios. More simply, beta is positively correlated with capitalization while idiosyncratic risk is negatively correlated, yet both risk types are negatively related to average returns.

Putting the pieces together, the data suggest that more conservative capital structures reduce the risk of equity but may increase its cost, and the overall cost of capital, by bringing the low risk anomaly into play. To assess magnitudes, we focus on the beta anomaly and estimate how the overall cost of capital for a bank would have changed over this period given the hypothetical ten percentage-point increase in Tier 1 capital to risk-weighted assets experiment in Kashyap et al. (2010). A benchmark estimate of the pretax weighted average cost of capital for a typical bank implied by the Capital Asset Pricing Model over our sample period is 40 basis points per year above the risk-free rate. By reducing equity betas, banks with a full ten percentage point increase in Tier 1 capital would have added between 60 and 90 basis points to this spread, which would more than double the weighted average cost of capital over the risk-free rate to between 100 and 130 basis points. In a competitive lending market this would have translated to a similar increase in rates faced by borrowers."


Are you looking for more strategies to read about? Check http://quantpedia.com/Screener

Do you want to see performance of trading systems we described? Check http://quantpedia.com/Chart/Performance

Do you want to know more about us? Check http://quantpedia.com/Home/About

Continue reading
Subscription Form

Subscribe for Newsletter

 Be first to know, when we publish new content
logo
The Encyclopedia of Quantitative Trading Strategies

Log in

QuantPedia
Privacy Overview

This website uses cookies so that we can provide you with the best user experience possible. Cookie information is stored in your browser and performs functions such as recognising you when you return to our website and helping our team to understand which sections of the website you find most interesting and useful.