FX Carry Risk Mitigation Papers

9.March 2017

Two new research papers related to a favorite anomaly of financial academics – forward premium puzzle aka. currency carry. Academic papers offer a way to increase performance (and decrease a risk) a little by employing a risk mitigation strategies:

A related papers to:

#5 – FX Carry Trade

Authors: Melvin, Shand

Title: When Carry Goes Bad: The Magnitude, Causes, and Duration of Currency Carry Unwinds

Link: https://papers.ssrn.com/sol3/papers.cfm?abstract_id=2897482

Abstract:

We analyze the worst currency carry loss episodes in recent decades, including causes, attribution by currency, timing, and the duration of carry drawdowns. To explore the determinants of the length of carry losses, a model of carry drawdown duration is estimated. We find evidence that drawdown duration varies systematically with expected return from the carry trade at the onset of the drawdown, financial stress indicators and the magnitude of deviations from a fundamental value portfolio of the carry-related portfolio holdings. In an out-of-sample test, we show that these determinants can be used to control carry-related losses and improve investment performance.

And

Authors: Lee, Wang

Title: The Impact of Jumps on Carry Trade Returns

Link: https://papers.ssrn.com/sol3/papers.cfm?abstract_id=2917694

Abstract:

This paper investigates how jump risks are priced in currency markets. We find that currencies whose changes are more sensitive to negative market jumps provide significantly higher expected returns. The positive risk premium constitutes compensation for the extreme losses during periods of market turmoil. Using the empirical findings, we propose a jump modified carry trade strategy, which has approximately 2-percentage-point (per annum) higher returns than the regular carry trade strategy. These findings result from the fact that negative jump betas are significantly related to the riskiness of currencies and business conditions.


Are you looking for more strategies to read about? Check http://quantpedia.com/Screener

Do you want to see performance of trading systems we described? Check http://quantpedia.com/Chart/Performance

Do you want to know more about us? Check http://quantpedia.com/Home/About

Continue reading

The No-Short Return Premium

5.March 2017

Nice academic paper. What's the return premium of short-sale restrictions:

Authors: Jiang, Li

Title: The No-Short Return Premium

Link: https://papers.ssrn.com/sol3/papers.cfm?abstract_id=2903517

Abstract:

Theory predicts that securities with greater limits to arbitrage are more subject to mispricing and thus should command a higher return premium. We test this prediction using the unique regulatory setting from the Hong Kong stock market, in which some stocks can be sold short and others cannot. We show that no-short stocks on average earn significantly higher returns than shortable stocks and the two groups of stocks tend to comove negatively. Moreover, stocks that comove more with the portfolio of no-short stocks on average earn higher subsequent abnormal returns while those comoving more with the shortable stocks earn lower subsequent abnormal returns. New additions to and deletions from the shorting list only partially contribute to the no-short return premium.

Notable quotations from the academic research paper:

"We test the existence of a mispricing return premium associated with a specific form of limits to arbitrage, short-sale restrictions, using a unique regulatory setting from the Hong Kong stock market. In the Stock Exchange of Hong Kong, short-sale restrictions apply to a subset of stocks but not the others. Stocks can be added to or deleted from the shorting list over time among the pool of stocks satisfying the criteria based on market capitalization, liquidity and so on. Thus, we can test whether the no-short stocks, presumably more subject to mispricing, earn a return premium relative to the shortable stocks. We do so by controlling for factor exposures and firm characteristics potentially correlated with the shorting list selections or expected stock returns.

Over the sample period 1997-2014, we find that no-short stocks on average earn a higher monthly return of 2%, or a higher abnormal monthly return of 1.32%, than shortable stocks. We term the return spread between the no-short and shortable stocks the no-short (NMS; no-short minus shortable) factor. The no-short factor premium estimate is consistently positive and statistically significant, robust to the adjustment for firm size, liquidity, and exposures to common factors such as the Fama and French (2015) five factors and the Hou, Xue, and Zhang (2015) four factors.

The strong predictive power of the NMS factor loadings extends to the full cross-section of individual stock returns, even in the presence of controls for firm size and book-to-market equity as well as a host of other firm characteristic variables. In other words, stocks that comove more with no-short stocks are expected to earn higher returns. Our interpretation is that these stocks embed higher risk of mispricing, and therefore command higher expected returns.

Lastly, we consider an alternative, although non-mutually exclusive, explanation for our finding of the positive no-short return premium. Shortable stocks may underperform no-short stocks simply because newly established short positions exert a downward price pressure on these stocks when they become shortable. As shortable stocks may be added to and deleted from the shorting list constantly, newly shortable stocks earn average lower returns when short positions are being introduced and newly no-short stocks earn higher returns when short position are being unwinded. To test this alternative hypothesis, we exclude stock-months within a 12-month window from when stocks are added to or deleted from the shorting list. We find that these exclusions do not alter our baseline finding of the positive no-short return premium. Thus, shortable stocks underperform no-short stocks not solely during periods of introduction or removal of the shortable status."


Are you looking for more strategies to read about? Check http://quantpedia.com/Screener

Do you want to see performance of trading systems we described? Check http://quantpedia.com/Chart/Performance

Do you want to know more about us? Check http://quantpedia.com/Home/About

Continue reading

How Short Positions Affect Factor Investing?

23.February 2017

Once again, an interesting academic paper related to multiple equity factors:

Authors: Briere, Szafarz

Title: Factor Investing: The Rocky Road from Long Only to Long Short

Link: https://papers.ssrn.com/sol3/papers2.cfm?abstract_id=2908491

Abstract:

The performances of factor investing rely heavily on short sales, not only for building the initial long-short strategy, but also for regularly rebalancing the positions. Since short selling is subject to both legal restrictions and substantial costs, this paper examines how severely restrictions on short positions affect the financial attractiveness of factor investing. To fill the gap between unconstrained long-short allocations and restricted long-only portfolios, we consider two in-between strategies: the first imposes that only the market can be shorted, and the second is the so-called “130/30” scenario that caps total short exposure at 30%. The takeaways are twofold. First, any infringement to the long-short strategy can harm significantly the mean-variance performances of efficient factor-based portfolios. This is linked to the fact that the total short exposure of optimal long-short portfolios can reach figures around 400% and above. Second, the factor portfolios built originally by Fama and French (1992) with the purpose of developing asset pricing are impressively clear-sighted when it comes to portfolio management. Indeed, combining these portfolios generates mean-variance performances similar to those of optimized long-short portfolios, except for low levels of volatility.

Notable quotations from the academic research paper:

"A sizeable literature on portfolio management suggests that making short sales on a regular basis to rebalance portfolios is difficult. The aim of this paper is to assess the actual dependence of the mean-variance performances of factor investing on short selling restrictions.

In order to relax the necessity of short selling in factor investing, we proceed in two steps. First, we disentangle the long and short legs of the five historical factors. The ten resulting long-only factors provide additional flexibility in portfolio management. Second, short-selling restrictions, if any, are imposed separately on each of these ten factors. Last, we consider short-selling restrictions on the market index separately to reflect that shorting the market is much easier to implement (through derivative markets, for instance) than shorting any other factor.

Using as a benchmark the efficient frontier built from the Fama-French portfolios, we will examine the consequences on mean-variance performances of imposing five sets of short-selling-based restrictions.

Portfolios in group 1 (global long-only) exclude any short position whatsoever. Group 2 (longshort market + long-only factors) puts no restriction on exposure to market but excludes short positions in factors. The rationale is that easy access to index trading makes shorting the market easier and less costly than shorting factors, which are hardly tradable. Group 3 includes the typical 130/30 portfolios defined by the combination of a 130% long position and a 30% short one. Finally, in group 4, no position is constrained.

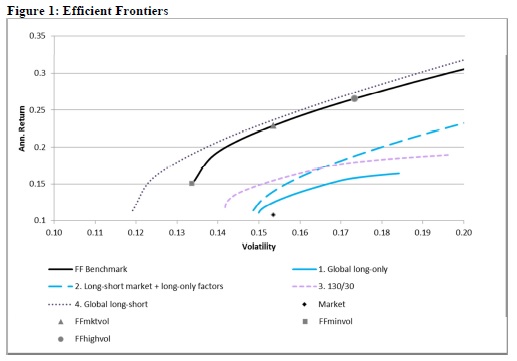
Figure 1 shows our five efficient frontiers. It reveals that the expected dominances are logically represented graphically. From definitions, we expect that the frontier corresponding to the global long-short case (group 4) dominates all the others, including the benchmark, since it allows running fully unconstrained optimization. Likewise, the global long-only case (group 1) is evidently more restrictive than both the cases of the long-short market + long-only factors (group 2) and 130/30 (group 3), which implies that the frontier associated with group 1 must be dominated by the two others. There is no clear dominance to be expected between the frontiers corresponding to groups 2 and 3, since on the one hand the exposure to market is unconstrained in group 2 but constrained by the 130/30 restriction in group 3, and the other factors can be shorted (to a certain extent) in group 3 but not at all in group 2. Hence, comparing the frontiers obtained for groups 2 and 3 can bring insights on the trade-off arising from shorting the market only versus shorting single-legged factors. 

The market portfolio is located below all our frontiers of interest; even the most restricted one (corresponding to group 1), which bans any short sale."


Are you looking for more strategies to read about? Check http://quantpedia.com/Screener

Do you want to see performance of trading systems we described? Check http://quantpedia.com/Chart/Performance

Do you want to know more about us? Check http://quantpedia.com/Home/About

Continue reading

Are Factor Strategies Overcrowded by ETF Investors ?

17.February 2017

An interesting academic paper related to multiple equity factors:

Authors: Blitz

Title: Are Exchange-Traded Funds Harvesting Factor Premiums?

Link: https://papers.ssrn.com/sol3/papers2.cfm?abstract_id=2912287

Abstract:

Some exchange-traded funds (ETFs) are specifically designed for harvesting factor premiums, such as the size, value, momentum and low-volatility premiums. Other ETFs, however, may implicitly go against these factors. This paper analyzes the factor exposures of US equity ETFs and finds that, indeed, for each factor there are not only funds which offer a large positive exposure, but also funds which offer a large negative exposure towards that factor. On aggregate, all factor exposures turn out to be close to zero, and plain market exposure is all that remains. This finding argues against the notion that factor premiums are rapidly being arbitraged away by ETF investors, and also against the related concern that factor strategies are becoming ‘overcrowded trades’.

Notable quotations from the academic research paper:

"This paper investigates if factor premiums, such as the size, value, momentum and low-volatility premiums, are systematically being harvested by investors in exchange-traded funds (ETFs).

Using a comprehensive sample of US equity ETFs, this paper finds that there are many funds which offer a large positive exposure to target factors such as size, value, momentum and low-volatility. At the same time, however, there are also many funds which offer a large negative exposure towards these factors. On aggregate, the exposures towards the size, value, momentum and low-volatility factors turn out to be very close to zero.

The take-away from these results is that despite a large variation in factor exposures across funds, the only thing that remains when everything is added up is plain market beta exposure. This finding argues against the notion that factor premiums are rapidly being arbitraged away by ETF investors.

It also argues against the related concern that factor strategies may have become ‘overcrowded trades’. Many investors are concerned about overcrowding of factor strategies, although the concept is not clearly defined. The general idea behind factor overcrowding is that so many investors are chasing the same factors that the long-term premiums associated with these factors disappear, that valuations of the stocks in factor portfolios increase, and that correlations among the stocks in factor portfolios increase as well, which might result in elevated crash risk. As, from a factor investing perspective, there seems to be just as much ETF money chasing stocks with the wrong factor characteristics as ETF money chasing stocks with the right factor characteristics, the ETF market does not seem to justify factor overcrowding concerns."


Are you looking for more strategies to read about? Check http://quantpedia.com/Screener

Do you want to see performance of trading systems we described? Check http://quantpedia.com/Chart/Performance

Do you want to know more about us? Check http://quantpedia.com/Home/About

Continue reading

Are Hedge Funds Betting Against Low-Volatility Stocks?

10.February 2017

A related paper to:

#7 – Volatility Effect in Stocks – Long-Only Version

Authors: Blitz

Title: Are Hedge Funds on the Other Side of the Low-Volatility Trade?

Link: https://papers.ssrn.com/sol3/papers2.cfm?abstract_id=2898034

Abstract:

The low-volatility anomaly is often attributed to limits to arbitrage, such as leverage, short-selling and benchmark constraints. One would therefore expect hedge funds, which are typically not hindered by these constraints, to be the smart money that is able to benefit from the anomaly. This paper finds that the return difference between low- and high-volatility stocks is indeed a highly significant explanatory factor for aggregate hedge fund returns, but with the opposite sign, i.e. hedge funds tend to bet not on, but against the low-volatility anomaly. This finding has several important implications. First, it implies that limits to arbitrage are not the key driver of the low-volatility anomaly. Second, it argues against the notion that the anomaly may be disappearing or may have turned into an ‘overcrowded’ trade. A final implication is that the return difference between low- and high-volatility stocks should be recognized as a key explanatory factor for hedge fund returns.

Notable quotations from the academic research paper:

"There is a vast amount of evidence that low-volatility and low-beta stocks earn higher returns than predicted by the Capital Asset Pricing Model (CAPM). Blitz, Falkenstein, and van Vliet (2014) provide an extensive overview of the various explanations for this phenomenon that have been proposed in various streams of literature. One of the most popular explanations is that the anomaly results from limits to arbitrage, such as leverage, short-selling and benchmark constraints.

Leverage, short-selling and benchmark constraints may indeed prevent a lot of investors from exploiting the low-volatility anomaly, but such limits to arbitrage are much less of a concern for hedge funds, as these funds tend to be characterized by an absolute return objective and ample flexibility to apply leverage and shorting. Based on the limits to arbitrage explanation one would therefore expect hedge funds to be the smart money that actively takes advantage of the opportunity provided by low-volatility stocks. This paper empirically tests this hypothesis by regressing aggregate hedge fund returns on the return difference between low- and high-volatility stocks.

The main finding is that the return difference between low- and high-volatility stocks is indeed a highly significant explanatory factor for aggregate hedge fund returns, but with the opposite sign, i.e. hedge funds do not bet on, but against the low-volatility anomaly. This argues against limits to arbitrage such as leverage, short-selling and benchmark constraints being the main explanation for the low-volatility anomaly. The finding that the multi-trillion hedge fund industry is not arbitraging but contributing to the low-volatility anomaly also argues against the popular notion that the anomaly is disappearing or becoming an ‘overcrowded’ trade. The findings in this paper also have implications for the hedge fund performance evaluation literature, as the return difference between low- and high-volatility stocks turns out to be a stronger explanatory factor for hedge fund returns than many previously documented factors."


Are you looking for more strategies to read about? Check http://quantpedia.com/Screener

Do you want to see performance of trading systems we described? Check http://quantpedia.com/Chart/Performance

Do you want to know more about us? Check http://quantpedia.com/Home/About

Continue reading

Value and Growth Stock Behavior During Market Declines

3.February 2017

A related paper to:

#26 – Value (Book-to-Market) Anomaly

Authors: Folkinshteyn, Meric, Meric

Title: Value and Growth Stock Price Behavior During Stock Market Declines

Link: https://papers.ssrn.com/sol3/papers.cfm?abstract_id=2814956

Abstract:

Using data for five major stock market declines during the 1987-2008 period, this paper provides evidence that value stocks are generally less sensitive to major stock market declines than growth stocks, controlling for beta, firm size, and industry group. Further analysis using several hundred different significant market move events between 1980 and 2015 confirms the observation that value stocks tend to outperform both the market average and growth stocks during market declines. The implication for investment practitioners is that following a value strategy does not lead one to assume greater sensitivity to unfavorable market conditions.

Notable quotations from the academic research paper:

"We conduct our study using data for five major stock market declines during the 1987-2008 period and several hundred stock market declines during the 1980-2015 period. For our core analysis, we selected a representative sample of five of the largest consecutive days of market decline in the S&P 500 index.

We use a combination of three ratios: dividend to price (dividend yield), market to book, and earnings to price (earnings yield). We classify a stock as a 'growth stock' if it pays no dividends, has an above-median market to book ratio, and a below-median earnings yield. We classify a stock as a 'value stock' if it pays dividends, has a below-median market to book ratio, and an above-median earnings yield.

Our research makes several important contributions to the literature. We document a consistent pattern of lower than average sensitivity of value stocks to most stock market declines, in excess of that predicted by beta. We also document that growth stocks have a greater sensitivity to most major stock market declines. We find that the decline of 2008 was distinct from the other major stock market declines in our study, wherein equities across the value-growth continuum were evenly affected. Further analysis using several hundred different significant market move events between 1980 and 2015 confirms the observation that value stocks tend to outperform both the market average and growth stocks during stock market declines."


Are you looking for more strategies to read about? Check http://quantpedia.com/Screener

Do you want to see performance of trading systems we described? Check http://quantpedia.com/Chart/Performance

Do you want to know more about us? Check http://quantpedia.com/Home/About

Continue reading

Subscribe for Newsletter

Be first to know, when we publish new content


    logo
    The Encyclopedia of Quantitative Trading Strategies

    Log in

    MORE INFO
    We boasts a total prize pool of $15,000
    Gain a Share of a Total Prize Pool of $15.000
    MORE INFO
    $15.000
    Gain a Share of a Total Prize Pool