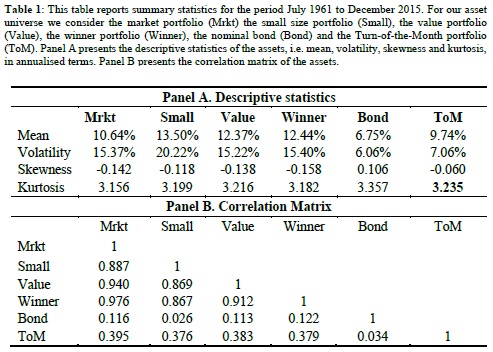
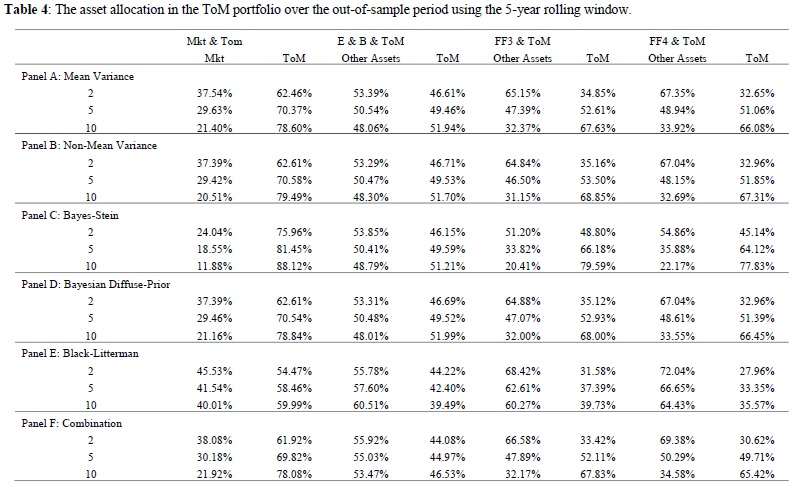
A Turn of the Month Strategy in Asset Allocation

26.November 2018

A new research paper related mainly to:

#41 – Turn of the Month in Equity Indexes

Authors: McGroarty, Platanakis, Sakkas, Urquhart

Title: A Seasonality Factor in Asset Allocation

Link: https://papers.ssrn.com/sol3/papers.cfm?abstract_id=3266285

Abstract:

Motivated by the seasonality found in equity returns, we create a Turn-of-the-Month (ToM) allocation strategy in the U.S. equity market and investigate its value in asset allocation. By using a wide variety of portfolio construction techniques in an attempt to address the impact of estimation risk in the input parameters, we show significant out-of-sample benefits from investing in the ToM factor along with a traditional stock-bond portfolio. The out-of-sample benefits remain significant after taking into account transaction costs and by using different rolling estimation windows indicating that a market timing strategy based on the ToM offers substantial benefits to investors when determining the allocation of assets.

Notable quotations from the academic research paper:

"Seasonality is a well-known characteristic of financial markets with much empirical literature noting various types of seasonality in stock returns. Simple seasonality-driven investment strategies have attracted significant interest from academics and investors over the last forty years.

Amongst the calendar effects, the turn-of-the-month (ToM hereafter) has been acknowledged as one of the strongest and persistent seasonality found in stock returns. The ToM effect is the tendency of the stock market returns to display particularly high returns on the last trading day of the month and the first three trading days of the next month.

This study contributes to the literature on calendar anomalies in several dimensions. We examine the out-of-sample portfolio benefits resulting from adding the ToM portfolio to (i) a traditional equity-bond mix, (ii) a market portfolio, (iii) a portfolio which consists of the market portfolio, the small size portfolio and the value portfolio, and (iv) a portfolio, which consists of the market, the small size, the value portfolio and the winner portfolio.

performance of selected strategies

We employ a wide variety of sophisticated and popular asset allocation techniques to provide robustness to our results. Specifically, we employ the mean-variance (Markowitz) portfolio optimization, portfolio optimization with higher moments, Bayes-Stein shrinkage, Bayesian diffuse-prior portfolio, Black-Litterman and another portfolio construction method that combines individual portfolio techniques, to ensure that our results are not just a peculiar artefact on one particular asset allocation technique. Finally, we assess the ToM for low, medium and high-risk averse investors, as its effectiveness in the portfolio might depend on the investor’s level of risk aversion.

Our empirical evidence suggests that the ToM portfolio adds value when included in different portfolios. Our results hold for different levels of risk aversion, portfolio techniques and estimation windows. Finally, our results are not eliminated by the including realistic transaction cost estimates, indicating that the creation and implementation of a ToM factor should be of great interest and potential value to investors.

allocation to turn of the month strategy"


Are you looking for more strategies to read about? Check /Screener

Do you want to see an overview of our database of trading strategies? Check /Chart

Do you want to know how we are searching new strategies? Check /Home/How

Do you want to know more about us? Check /Home/About


Follow us on:

Facebook: https://www.facebook.com/quantpedia/

Twitter: https://twitter.com/quantpedia

Continue reading

Does High Market Liquidity Cause Vanishing Equity Anomaly Returns ?

21.November 2018

Short answer? – Probably no … A new academic research paper concludes that "the recent worldwide regime of increased liquidity, apart from some exceptions, is not accompanied by robustly significant decreases of anomalous returns in the US and the majority of other markets." Research paper related mainly to:

#14 – Momentum Effect in Stocks
#25 – Size Premium
#26 – Value (Book-to-Market) Anomaly
#77 – Beta Factor in Stocks

Authors: Auer, Rottmann

Title: Have Capital Market Anomalies Worldwide Attenuated in the Recent Era of High Liquidity and Trading Activity?

Link: https://papers.ssrn.com/sol3/papers.cfm?abstract_id=3275377

Abstract:

We revisit and extend the study by Chordia et al. (2014) which documents that, in recent years, increased liquidity has significantly decreased exploitable returns of capital market anomalies in the US. Using a novel international dataset of arbitrage portfolio returns for four well-known anomalies (size, value, momentum and beta) in 21 developed stock markets and more advanced statistical methodology (quantile regressions, Markov regime-switching models, panel estimation procedures), we arrive at two important findings. First, the US evidence in the above study is not fully robust. Second, while markets worldwide are characterised by positive trends in liquidity, there is no persuasive time-series and cross-sectional evidence for a negative link between anomalies in market returns and liquidity. Thus, this proxy of arbitrage activity does not appear to be a key factor in explaining the dynamics of anomalous returns.

Notable quotations from the academic research paper:

"Recent years have been characterised by unprecedented changes in trading technology and transaction costs. A lot of authors document signi ficant advances in algorithmic trading and increased utilisation of online brokerage accounts and observe drastic declines in, for example, standardised aggregate costs of trading for NYSE, NASDAQ and AMEX stocks of on average 97% from 146 basis points in 1980 to 11 basis points in 2006. Standard measures of liquidity have increased substantially because this new market environment of reduced trading frictions stimulates trading activity. For example, they present evidence that:

(i) the average monthly share turnover on the NYSE rose from about 5% in 1993 to about 26% in 2008 (and the average daily number of transactions increased about ninetyfold in the same period), whereas it was almost unchanged in the decades before,

(ii) mainly institutional trading volume accounts for this increase and

(iii) increased volume is associated with higher market quality (i.e., closer conformity to random walk behaviour).

Motivated by these observations, several studies have analysed whether increased liquidity has triggered greater anomaly-based arbitrage and thus attenuated capital market anomalies. In their conclusion, Chordia et al. (2014, p. 57) argue that  "return predictability would diminish to a greater extent in countries that have experienced greater enhancements in trading technologies and larger increases in trading activity and liquidity" and that this "hypothesis awaits rigorous testing in an international context". This is where we step into the picture. We extend the hedge portfolio evidence of Chordia et al. (2014) to an international setting.

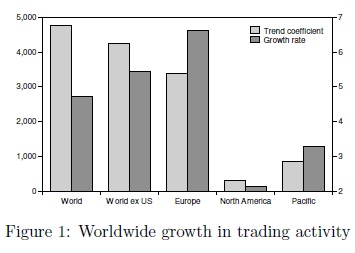
Figure 1, reporting trends and growth rates for the number of traded shares in di fferent regions of the world, shows positive tendencies worldwide and that there are indeed di fferences in the timely development of trading activity. For example, trading activity appears to have increased more significantly in European markets than in the US. Thus, we would not only expect to find evidence on vanishing anomaly returns in other markets as well but also that the magnitudes of the changes in anomaly returns are quite di fferent across individual markets.

Using a novel dataset containing arbitrage portfolio returns for the four well-known anomalies of size, value, momentum and beta for a wide range of developed stock markets, we start our analysis by testing whether these anomalies still exist and whether the corresponding arbitrage portfolio returns exhibit trending behaviour. We also investigate trends in market liquidity in a more detailed fashion than in our previous illustration.

Using a novel dataset covering three decades, we find that the recent worldwide regime of increased liquidity, apart from some exceptions, is not accompanied by robustly signifi cant decreases of anomalous returns in the US and the majority of other markets. We cannot establish a persistent negative link between arbitrage portfolio returns and share turnover in both the time-series and the cross-sectional dimension. These results suggest that aggregate liquidity may be a measure too coarse for our purposes or that liquidity in general may not be the key driver of the dynamics of international anomaly portfolios."


Are you looking for more strategies to read about? Check /Screener

Do you want to see an overview of our database of trading strategies? Check /Chart

Do you want to know how we are searching new strategies? Check /Home/How

Do you want to know more about us? Check /Home/About


Follow us on:

Facebook: https://www.facebook.com/quantpedia/

Twitter: https://twitter.com/quantpedia

Continue reading

Capital Allocation Across a Range of Cross-Asset Alternative Risk Premia

14.November 2018

A new financial research paper gives an ideas of how to allocate capital across several well known factor strategies:

Authors: Blin, Ielpo, Lee, Teiletche

Title: Factor Timing Revisited: Alternative Risk Premia Allocation Based on Nowcasting and Valuation Signals

Link: https://papers.ssrn.com/sol3/papers.cfm?abstract_id=3247010

Abstract:

Alternative risk premia are encountering growing interest from investors. The vast majority of the academic literature has been focusing on describing the alternative risk premia (typically, momentum, carry and value strategies) individually. In this article, we investigate the question of allocation across a diversified range of cross-asset alternative risk premia over the period 1990-2018. For this, we design an active (macro risk-based) allocation framework that notably aims to exploit alternative risk premia’s varying behavior in different macro regimes and their valuations over time. We perform backtests of the allocation strategy in an out-of-sample setting, shedding light on the significance of both sources of information.

Notable quotations from the academic research paper:

"Alternative risk premia investing has grown rapidly in popularity in the investment community in recent years. They provide systematic exposures to risk factors and market anomalies that have frequently been widely analyzed in academic research. The vast majority of the academic literature solely focuses on the identification and the analysis of individual alternative risk premia strategies. On the contrary, this article addresses the question of allocation among alternative risk premia.

The standard approach in the industry is to apply a risk-based allocation mechanism, particularly equal risk contribution (ERC) in which one allocates the same risk budget to all components in the portfolio. One of the perceived key benefits of this approach is that it does not require expected returns as input but solely risk measures, hence the name “risk-based”. This no-views/agnostic feature alleviates the pitfalls of forecasting, which is already a challenge for traditional assets but even more so for alternative risk premia that are newer or are perceived as more complex strategies.

Despite this, recent research lends more support to the idea of some predictability of factor returns. In this article, we extend those results by focusing on the relationship between alternative risk premia and macro regimes that we define through nowcaster indicators. We consider that three major macroeconomic risks that affect risk premia: growth, inflation and market stress/volatility.

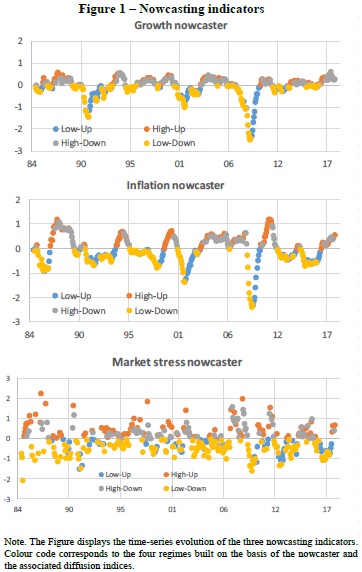
To model the influence of these macro risks, a regime approach has proven effective. To characterize macro regimes for growth, inflation and market stress, we build our own nowcasting (contraction of “now” and “forecasting”) indicators since 1990. Seeking for simplicity, our nowcasters are simple averages of z-scores of a large cross section of indicators across a large set of countries. For instance, the “growth” nowcaster contains close to 500 economic times-series across major developed and emerging countries accounting for 85% of world GDP. In Appendix A, we provide more details on the construction of the nowcasters.

To characterize economic regimes in a more precise way, we use both the average of all properly scaled economic indicators (the “nowcaster” per se) but also take advantage of the information in the cross-section by accounting for the proportion of indicators that are improving or deteriorating for every period (called “diffusion” index below). In practice, the diffusion index gives some further indication about whether the economy is improving (when diffusion index rises) or deteriorating (when diffusion index declines). On the basis of the nowcaster and diffusion indices, we define four regimes:

– Low-Up: negative nowcaster (Low) and diffusion index above 50% (Up)
– Low-Down: negative nowcaster (Low) and diffusion index below 50% (Down)
– High-Up: positive nowcaster (High) and diffusion index above 50% (Up)
– High-Down: positive nowcaster (High) and diffusion index below 50% (Down)

For the growth factor, this is similar to the usual Recession (Low-Down) / Recovery (Low-Up) / Expansion (High-Up) / Slowdown (High-Down) classification.

In Figure 1, we represent the different macro factor nowcasters and highlight different regimes by using a distinctive color scheme.

Nowcasters

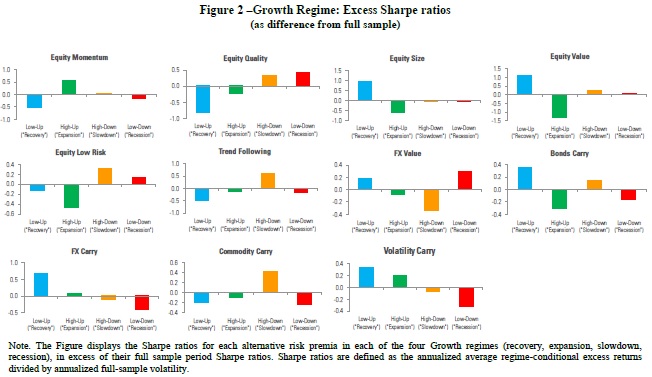
To give a first sense of the sensitivity of alternative risk premia to macroeconomic regimes, we represent in Figure 2 growth regime-conditional excess Sharpe ratios, i.e. the difference between Sharpe ratios in each growth regime and the long-term (unconditional) Sharpe ratio. Some strategies can be seen as being “defensive”, as they tend to do relatively well in either slowdowns (High-Down regime) or recessions (Low-Down regime), such as equity quality, equity low-risk, trend-following, or bonds carry. Conversely, some strategies benefits from better economic conditions such as equity size, FX carry or volatility carry.

Factors in different regimes

In next section, we define and implement a process to allocate among alternative risk premia which incorporates, along other dimensions, each risk premium’s sensitivities to the macro regimes. The approach is based on the active risk-based methodology derived in Jurczenko and Teiletche (2018) which adapts Black and Litterman (1992) framework to the risk-based world. In practice, the model ends up combining a risk-based strategic portfolio with a set of dynamic allocation active views.

As our focus is on dynamic signals, we do not seek to improve the strategic portfolio. We adopt a simple ERC portfolio, which consists of equal contributions to portfolio volatility across all alternative risk premia. The strategic portfolio is then modified to incorporate dynamic deviations in two steps.

In a first step, we compute z-score reflecting dynamic allocation based on an equal-weight of two z-scores, for macro factors and valuation respectively. Regarding macro factors (growth, inflation, market stress), z-scores are computed as the excess return in the current (“nowcasted”) regime vs full sample return scaled by historical volatility.

In the second step, these dynamic z-scores are transformed into active portfolio deviations calibrated to deliver 1% tracking-error relative to the strategic portfolio. The sum of active deviations is set to zero, so that the portfolio is fully invested, similar to the strategic allocation.

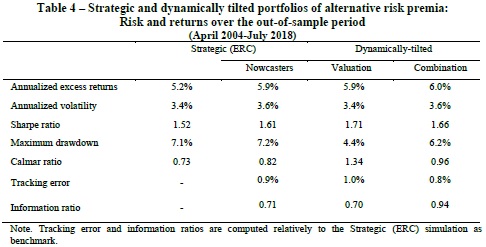
Table 4 summarizes the performance statistics of the portfolio. The first column shows the strategic ERC portfolio. The second to fourth columns show the “dynamic” portfolios that incorporate active tilts, based on nowcasters and valuation signals individually and in combination.


Result of allocaton

"


Are you looking for more strategies to read about? Check /Screener

Do you want to see an overview of our database of trading strategies? Check /Chart

Do you want to know how we are searching new strategies? Check /Home/How

Do you want to know more about us? Check /Home/About


Follow us on:

Facebook: https://www.facebook.com/quantpedia/

Twitter: https://twitter.com/quantpedia

Continue reading

Too Much Arbitrage Contributes to Overreaction in Post Earnings Announcement Drift

7.November 2018

A new financial research paper has been published and is related to all equity long short strategies but mainly to:

#33 – Post-Earnings Announcement Effect

Authors: Li

Title: Does Too Much Arbitrage Destablize Stock Price? Evidence from Short Selling and Post Earnings Announcement Drift.

Link: https://papers.ssrn.com/sol3/papers.cfm?abstract_id=3249254

Abstract:

Stein (2009) suggests that too much arbitrage capital exploiting underreaction can lead to overreaction, pushing price further away from fundamental value. I test this hypothesis by investigating the relation between changes in short interest ratio around earning announcement and the subsequent drift return. There are two main findings in this paper. First, my results suggest that too much arbitrage capital does contribute to overreaction (with a t-statistics around 4 on average). These findings are robust to alternative sample periods or length of the window for drift calculation. Second, contrary to the findings in prior literature that show that short sellers mitigate the magnitude of drift, my results show that almost all of this effect are actually contributed by the observations that are more likely to represent overreaction.

Notable quotations from the academic research paper:

"Conventional wisdom believes that as more arbitrage capital starts to trade a given anomaly, any abnormal returns will be eventually eliminated (up to risk and limits to arbitrage) and stock prices will be pushed closer to fundamental values. In other words, the more arbitrage capital, the more efficient the market is likely to become. However, Stein (2009, Presidential Address: Sophisticated Investors and Market Efficiency) questions this simple intuition and shows that when the anomaly does not have a fundamental anchor and when arbitrageurs are not aware about how many other arbitrageurs are trading the same anomaly, arbitrage activity may lead to price overshoot, pushing price further away from fundamental value. Prior literature has very little empirical evidence regarding this implication. Therefore, in this study I try to test whether too much arbitrage capital destabilizes stock price.

The anomaly utilized in this paper is post earnings announcement drift (henceforth, PEAD). Three major advantages associated with PEAD makes it an ideal setting for testing the above implication.

First, it does not have a fundamental anchor so that arbitrageurs do not have a benchmark to gauge the level of under or over valuation. Second, it is one of the most persistent anomalies that are often followed by actively managed hedge funds. Third, it allows me to pin down the time at which arbitrageurs are most likely to take actions – that is, if an arbitrageur was to maximize his profit, he would be more likely to take action in a tight window around the earnings announcement date.

The proxy for arbitrage capital is the change of short interest ratio around earnings announcement date. It is widely documented that short sellers tend to be informed traders who incorporate information and move prices closer to fundamental values. Also note that, in this study, I only focus on announcements with negative earnings surprise since these are the stocks that short sellers are more likely to target.

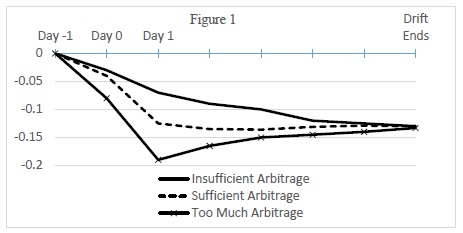
The relation between PEAD and change of short interest ratio is illustrated in figure 1.

arbitrage & PEAD

Day 0 is the date when the earning announcement is released. Day -1 is one day before and Day 1 is one day after the announcement date. Together, the 3-day window forms the initial response period in which arbitrageurs will trade most intensively. The solid line illustrates the return pattern for negative earnings surprise announcement with insufficient arbitrage capital. In this case, a minor negative return is realized in the initial response period which is followed by a further negative drift. The dashed line illustrates the case when there is sufficient arbitrage capital. In this case, more arbitrage capital adjusts the price to fundamental value faster and therefore a moderate negative return (more negative than the solid line) is realized and no obvious further drift follows. The crossed line illustrates the case when there is too much arbitrage capital. In this case, due to too much arbitraging, a large negative initial response (potential overshoot) is followed by a positive drift (correction).

My findings suggest that too much arbitrage does seem to destabilize stock price. First, holding all else equal, announcements with larger increase in short interest ratio experience significantly more negative initial response (more correction). Next, I show that negative earnings announcements with positive abnormal drift have significantly higher change in short interest ratio than those with negative abnormal drift. Moreover, I find that, holding all else equal, stocks with the largest increase in short interest ratio (SIR decile 10) is almost 10% more likely to result in overreaction than stocks with the largest decrease in short interest ratio (SIR decile 1). In the end, I show that, holding all else equal, change in short interest ratio significantly contributes to overreaction. In particular, within stocks that have positive abnormal drift, the ones that experience the largest increase in short interest ratio average 1.55% higher drift than the ones that experience the largest decrease in short interest ratio. Robustness tests show that my results are not likely to be driven by extreme values in abnormal drift, particular year observations, or length of window for return calculations."


Are you looking for more strategies to read about? Check /Screener

Do you want to see an overview of our database of trading strategies? Check /Chart

Do you want to know how we are searching new strategies? Check /Home/How

Do you want to know more about us? Check /Home/About


Follow us on:

Facebook: https://www.facebook.com/quantpedia/

Twitter: https://twitter.com/quantpedia

Continue reading

Historical Returns for US Bonds since 1793

4.November 2018

We have mentioned it several times – we are quants but we love history and we love research papers like this:

Author: McQuarrie

Title: The First Eighty Years of the US Bond Market: Investor Total Return from 1793, Combining Federal, Municipal, and Corporate Bonds

Link: https://papers.ssrn.com/sol3/papers.cfm?abstract_id=3260733

Abstract:

US securities markets took root after Alexander Hamilton’s refunding of the Federal debt in the early 1790s. Accordingly, a market in bonds has been in operation in the US for over two centuries. Until recently, however, little was known about the bond market prior to 1857. This paper focuses on investor holding period returns, using newly compiled data on bond prices, rather than focusing on the movement of yields, as in Homer (1963). It incorporates the relatively familiar Treasury securities from before President Andrew Jackson paid off the debt in 1835, but also includes state and city debt, which ballooned beginning in the 1820s, as well as corporate debt, from its beginnings about 1830 to its explosion after 1850. I find that all three classes of bonds provided investors with similar total returns, excepting a brief period in the 1840s when state securities plunged before recovering. I also find that real returns in the eight decades following 1793 were generally higher than the long-term average return of 3.6% proposed for bonds in Siegel (2014). I further find that in these early years, bonds sometimes out-performed stocks over periods of several decades, again contrary to Siegel’s thesis. The paper considers the implications of a demonstration that stocks and bonds performed differently in the nineteenth century as compared to the twentieth century.

Notable quotations from the academic research paper:

"The importance of the nineteenth century, in the context of financial history, is to provide a check on hasty generalizations from limited data. Returns from a few decades in the twentieth century, first made available in Fisher and Lorie (1964), must be regarded as limited indeed. This limited twentieth century data, which emerged as financial history was developing as a discipline and has been widely diffused in publications by Ibbotson (2016, Stocks, Bonds, Bills & Inflation), has strongly inflected conclusions about what investors can expect over the long-term. The twentieth century US data, especially following WW II when the US economy bestrode the world as a colossus, paints a very sunny picture for stocks, and a sad cloudy picture for bonds, memorialized in Siegel (2014, Stocks for the Long Run).

The US had a rather different economy in the nineteenth century, especially the antebellum years which have been the focus of this paper. Likewise, the US economy then held a very different and much more minor position in the world economy. Hence, it was rhetorically powerful for Siegel (2014) to advertise that two centuries of data told one consistent story: stocks are splendid, bonds are laggards. Consistent performance across two such wildly different epochs was strongly supportive of his thesis.

It now appears that Siegel’s (2014, Stocks for the Long Run) early nineteenth century database was both thinner than many readers may have realized (e.g., dividend payments were estimated rather than observed; many prominent stocks were excluded), and more prejudicial to bonds than may have been grasped (e.g., by taking the minimum of Federal and municipal yields, even after Federal bonds gained circulation privileges). The much thicker datasets here do not support Siegel’s attempt to generalize from mid-twentieth results to the very different circumstances faced by US investors in the early nineteenth century. As it becomes possible to stitch together an unbroken multi-century record for both stocks and bonds, discussion may turn to the factors that determine when stocks (bonds) will do well, and when stocks (bonds) will do poorly. There is now a counter to Siegel’s thesis: that both investments follow a random walk within bounds, and that these bounds may not differ by much across these two major categories of investment.

Stocks did out-perform bonds in the middle of the twentieth century, per Ibbotson and Siegel; but stocks did not out-perform bonds in the first few decades of the nineteenth century. Generalizations from the middle of the twentieth century do not hold—these now appear as simple extrapolations. Gainsaid in the nineteenth century, these extrapolated returns may not apply to the twenty-first century either.
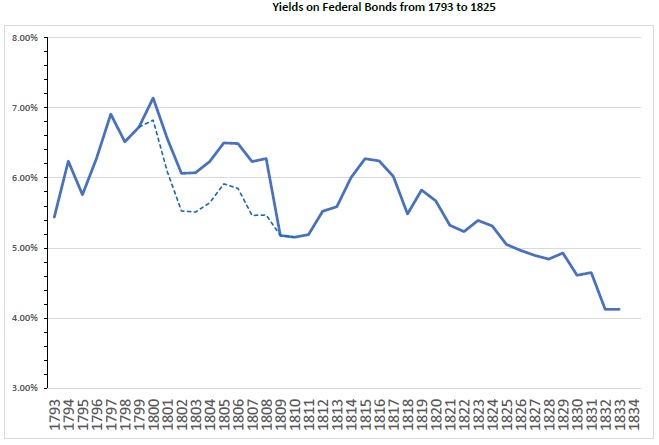
yields in 19th century

Examining Figure 1, the pattern is straightforward. Yields rose through the 1790s, then declined until the War of 1812 (prior to the war, the government steadily paid down its debt). After the war Federal yields resumed their decline, ending at their low point for the period charted.
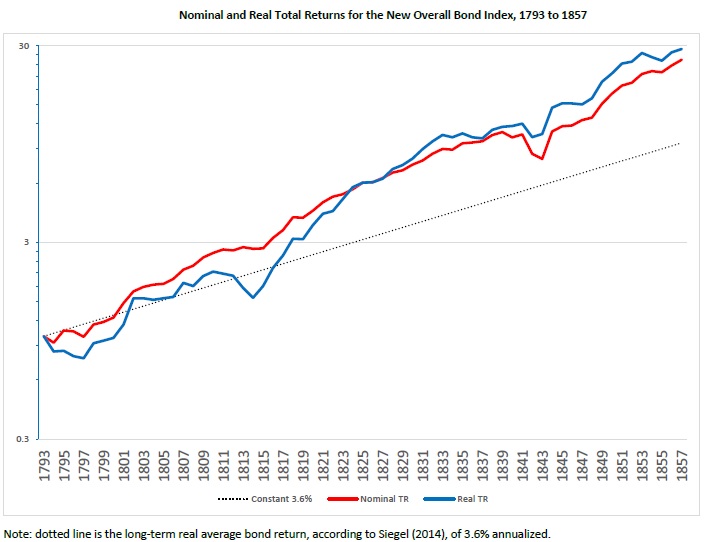
bond index in 19th century

A simple summary of the newly uncovered sixty-four years of bond returns charted in Figure 12 might state:
1) returns for the period were well above the long-term average cited by Siegel (2014);
2) bonds are as subject to bull and bear markets as stocks;
3) bond returns can be depressed or super-charged over periods decades in length.
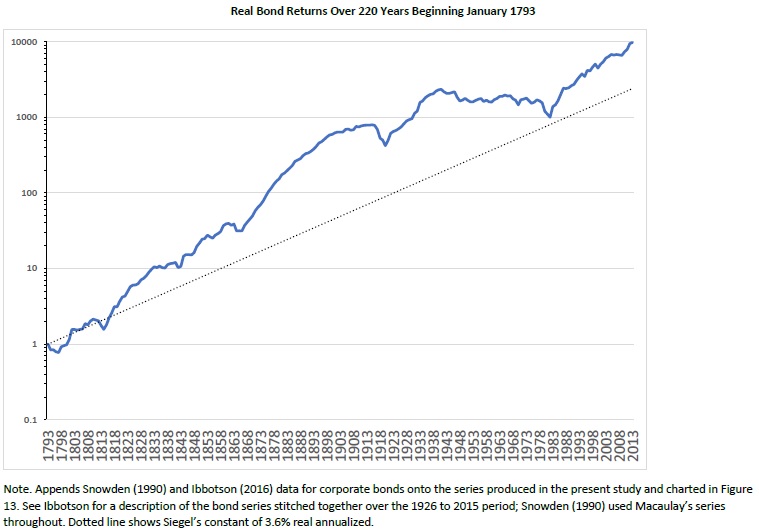
bond index for 200 years

The most straightforward interpretation of Figure 14 is that bond investors never received the average return over any lengthy period. Rather, from time to time bond investors suffered depressed returns, most notably from the 1940s through 1980, but also from 1793 through 1814, while at other times, bond investors enjoyed sustained periods of unusually high returns, most notably from the end of the Civil War to the beginning of World War I, but also from the end of the War of 1812 to the beginning of the Civil War, and from 1981 to the present day. Bond investors were also vulnerable to sudden sharp shocks in which the real value of a bond portfolio dropped 30% or even 40% over a few years (these were mostly associated with bouts of wartime inflation). Conversely, during favorable periods bond investors could rack up multi-decade returns comparable to those expected from stocks. Over the eighty-seven years beginning in 1814, bond investors received an annualized real return of 7.12%–somewhat higher than the long-term return to be expected from stocks, according to Siegel, of 6.6%.
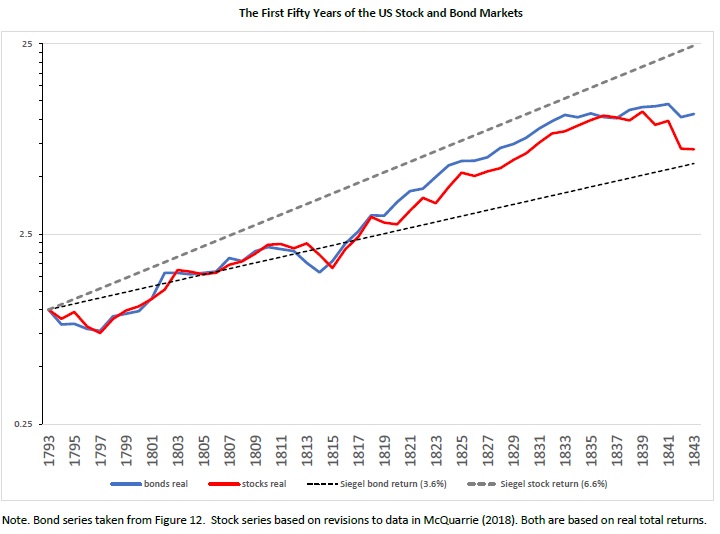
us stocks and bonds

Figure 15 combines fifty years of bond data gathered in this paper with fifty years of stock returns. The pattern is not supportive of Siegel’s claim that stocks must out-perform bonds over decades-long periods. Nor does the pattern support Siegel’s (and Bernstein’s) expectation that real stock returns, measured over the long-term, will converge on an underlying constant, currently estimated by Siegel as 6.6%. Rather, stocks significantly underperformed this standard over the 1793-1843 period.

If Siegel (2014) had never published his thesis about stocks for the long run, and Figure 15 were the only evidence available on historical stock and bond returns in the nineteenth century, what would be the most straightforward interpretation of it?

Answer: that over most periods decades in length, stocks and bonds return about the same. Second, that returns fluctuate, consistent with a random walk within bounds, in which strings of good or bad performance, of any length, may occur. Accordingly, in the fullness of time sharp drops may occur, and stocks and bonds may drop together or not. Likewise, stocks and bonds may register an above-trend performance, lasting decades, which may be coincident or not. If the analyst is free to select an arbitrary beginning point, subject only to that point being decades in the past, then when measured at exactly the right (wrong) time, stocks can be shown to have under-performed bonds “over the long run.” The fifty years from 1793 provide such an example. Stocks returned 3.96% real annualized, while bonds returned 4.88%. As before, the difference sounds small until converted into ending portfolio values. Over those fifty years, perhaps one of the worst five-decade periods in the history of the US securities markets, stocks turned an investment of $1000 into $6,963, but bonds turned that $1000 into $10,807."


Are you looking for more strategies to read about? Check /Screener

Do you want to see performance of trading systems we described? Check /Chart/Performance

Do you want to know more about us? Check /Home/About


Follow us on:

Facebook: https://www.facebook.com/quantpedia/

Twitter: https://twitter.com/quantpedia

Continue reading

Determinants of Emerging Market Bonds Returns

24.October 2018

Do you invest in emerging market bonds? A new interesting academic research paper just for you:

Author: Kang, So, Tziortziotis

Title: Embedded Betas and Better Bets: Factor Investing in Emerging Market Bonds

Link: https://papers.ssrn.com/sol3/papers.cfm?abstract_id=3196018

Abstract:

We document novel empirical insights driving the prices of sovereign external emerging market bonds. In the time series, we examine the market portfolio’s time-varying exposures to a broad set of macro factors (rates, credit, currency, and equity) and identify these embedded betas as key drivers of its excess returns. In the cross-section, we construct complementary value and momentum style factors and demonstrate their ability to explain country expected returns. Building off these insights, we introduce a simple risk-on versus risk-off framework to characterize the correlation structure spanning our macro and style factors. Lastly, we show how our style factors can be incorporated in an optimized long-only portfolio to generate outperformance relative to a value-weighted benchmark portfolio.

Notable quotations from the academic research paper:

"Our paper attempts to answer several salient questions:

What broad insights can macro factors provide into the time series of returns?

What country-specific insights can style factors provide into the cross-section of expected returns?

How can a factor-based investor systematically leverage these insights?

macro factors and emerging market bonds

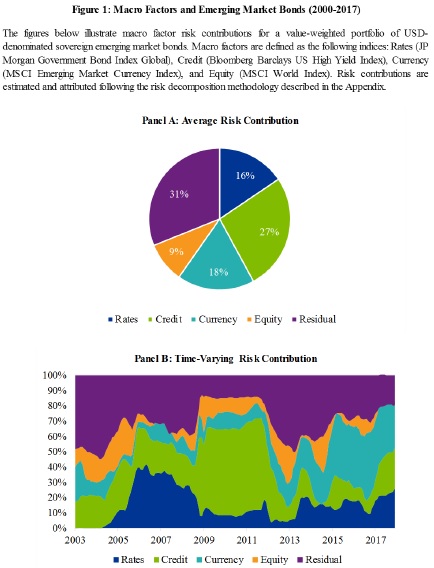
To motivate our paper, we begin by illustrating how macro factors have been a significant source of time-varying risk in the EMB universe. The top panel of Figure 1 decomposes the total risk of a value-weighted EMB portfolio between 2000 and 2017 in terms of macro risk factors. As expected, interest rate and credit risk factors appear to be the primary sources of risk, with relative risk contributions of 16% and 27%, respectively.2 While the EMB universe only includes USD denominated bonds with no explicit exposure to exchange rate fluctuations or global equity markets, our EM currency and global equity factors surprisingly account for 18% and 9% of the portfolio’s risk, respectively. Moreover, the bottom panel of Figure 1 reveals that these relative risk contributions have not been static, but in fact varied significantly over time.

Given these observations, our empirical analysis begins with an examination of the time series relationship between macro factors and EMB returns. We first highlight the impressive performance of the EMB portfolio, which realized an annualized excess return of 7.5% with a volatility of 9.0% over this sample period, corresponding to a Sharpe Ratio of 0.83. After controlling for its macro factor exposures, however, we find that the EMB portfolio realized no significant outperformance. We then examine the EMB portfolio’s macro factor exposures, which we call embedded betas, finding the relative risk contributions from these macro factors to be well balanced on average.

Next, we investigate the ability of value and momentum style factors to explain the cross section of country expected returns. We find that our risk-seeking value factor serves as an important source of risk-adjusted returns, while our momentum factor provides valuable defensive protection. We construct our value factor based on a measure we call default-adjusted spread, which corresponds to option-adjusted spread adjusted for expected sovereign default risk. On the other hand, our momentum factor exploits a simple cross-asset insight from currency markets to identify challenging sovereign credit conditions. Since a depreciating currency weakens a sovereign issuer’s ability to service its external debt, we argue that negative currency momentum should forecast lower bond prices to the extent that bond markets underreact to movements in the foreign exchange market.

historical performance

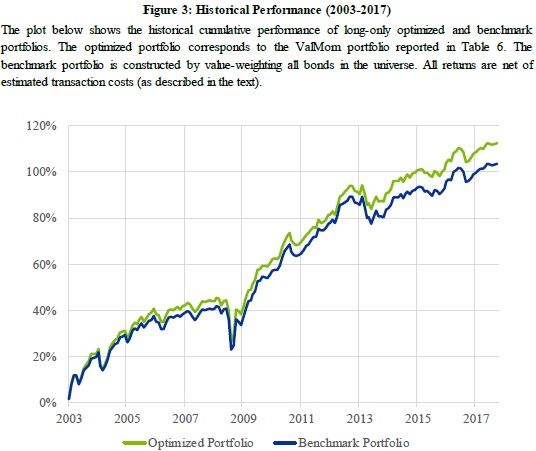
Finally, we empirically test how incorporating our style factors in a long-only portfolio can generate outperformance relative to the value-weighted EMB portfolio through improved country selection bets. We do so by constructing and backtesting optimized long-only portfolios that incorporate realistic benchmark-relative constraints and trading frictions. We find that a multifactor strategy that combines value and momentum insights outperforms its value-weighted benchmark by 60 basis points per annum net of transaction costs, resulting in a net information ratio of 0.82."


Are you looking for more strategies to read about? Check /Screener

Do you want to see performance of trading systems we described? Check /Chart/Performance

Do you want to know more about us? Check /Home/About


Follow us on:

Facebook: https://www.facebook.com/quantpedia/

Twitter: https://twitter.com/quantpedia
Continue reading

Beta Anomaly Is a Force Behind a Number of Equity Factors

18.October 2018

A new financial research paper has been published and is related to:

#77 – Beta Factor in Stocks

Authors: Liu

Title: Asset Pricing Anomalies and the Low-Risk Puzzle

Link: https://papers.ssrn.com/sol3/papers.cfm?abstract_id=3258015

Abstract:

The original observation in Black, Jensen and Scholes (1972) that the security market line is too flat – the beta anomaly – is a driving force behind a number of well-documented cross-sectional asset pricing puzzles. I document that returns to a broad set of anomaly portfolios are negatively correlated with the contemporaneous market excess return. I show that this negative covariance implicitly embeds the beta anomaly in these cross-sectional return puzzles. Taking into account the exposure to the beta anomaly either attenuates or eliminates the economic and statistical significance of the risk-adjusted returns to a large set of asset pricing anomalies.

Notable quotations from the academic research paper:

"Defying both theory and intuition, low beta assets have consistently outperformed high beta assets, both over time and across various asset markets. This observation has come to be known as the beta anomaly. In this paper, I present evidence that the beta anomaly is embedded in a broad set of cross-sectional asset pricing puzzles.

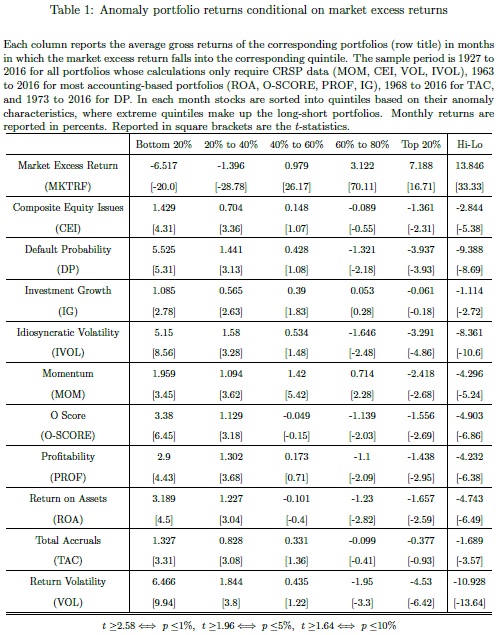
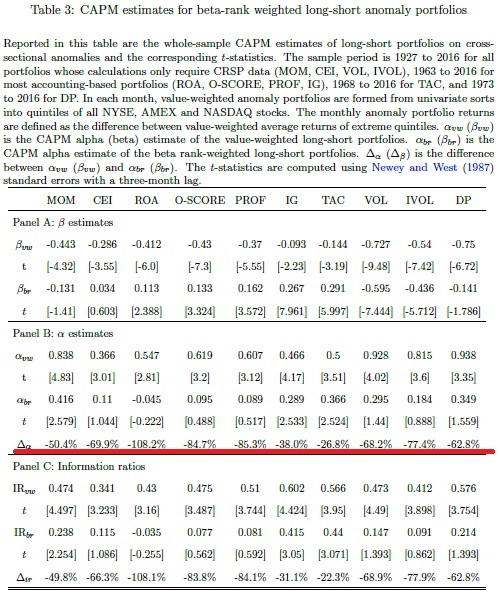
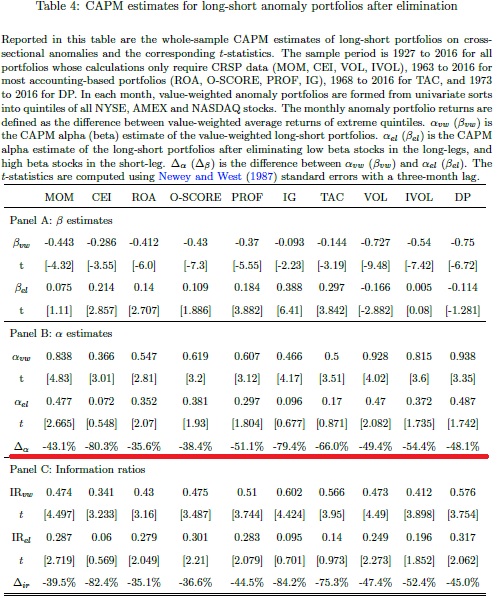
I document that anomaly portfolio returns share a striking and peculiar pattern: returns are positive and peak in market downfalls, but are negative when the market rises. I verify that this negative covariance is empirically equivalent to the long portfolios holding stocks with lower betas relative to the short portfolios. Mitigating the exposure to the beta anomaly either attenuates or eliminates the economic and statistical signi ficance of the risk-adjusted returns to numerous cross-sectional anomalies.

anomaly returns in different market states

This paper analyzes a set of ten asset pricing puzzles representative of di fferent types of cross-sectional return predictors documented in the literature. The sample includes anomalies that are operation-based (total accruals, return on assets, pro fitability, investment growth), return-based (momentum), risk-based (O-score, default probability, return volatility, idiosyncratic volatility), as well as issuance-related (composite equity issues). It is remarkable that portfolios formed on such a wide range of characteristics all have returns that are negatively correlated with the market.

The observed negative covariance has two immediate implications. First, to the extent that these anomaly portfolios hold "quality" stocks (profi table, high past return, mature, low probability of failure, etc.), the fact that they pay off in bad states of the world is consistent with flight to quality in market downturns. The negative covariance between "quality" stocks and the market points to the beta anomaly as an explanation for why "quality" stocks have high average returns. Second, the shared negative covariance with the market is suggestive of the data mining concern in the empirical asset pricing literature – the search for cross-sectional return predictability has led to di fferent dimensions to slice the data, many of which somehow implicitly take advantage of the beta anomaly.

To show that the beta anomaly subsumes the risk-adjusted returns of the cross-sectional anomalies, I mitigate the long-short portfolios' exposure to the beta anomaly in two complementary ways.

beta ranking

First, I consider an alternative weighting scheme when aggregating returns to the portfolio level: I weight stocks in long legs using the ascending decile ranking of their pre-formation betas, and weight stocks in short legs using the descending decile beta rankings. This way of constructing portfolios keeps the original portfolio constituents while putting more weight on high beta stocks in the long leg, and more weight on low beta stocks in the short leg, relative to value-weighted portfolios.

elimination weighting

The second approach complements the first by keeping the value-weighting scheme from the original portfolio construction, but removing stocks with low betas in the long leg, and stocks with high betas in the short leg.

Together these two approaches allow me to separate the e ffect of beta exposure from the e ect of the anomaly characteristics on the long-short portfolios' alphas. Both modifi ed portfolio construction methods reduce or remove the exposure to the beta anomaly, and lead to reduced CAPM alphas for the anomaly trading strategies. In terms of economic magnitude, the reduction in trading profi tability ranges from 27% up to a reversed sign."


Are you looking for more strategies to read about? Check /Screener

Do you want to see performance of trading systems we described? Check /Chart/Performance

Do you want to know more about us? Check /Home/About


Follow us on:

Facebook: https://www.facebook.com/quantpedia/

Twitter: https://twitter.com/quantpedia
Continue reading

It Is Hard to Profit by Buying Options and Betting on Higher Volatility

11.October 2018

A new financial research paper has been published and is related to:

#20 – Volatility Risk Premium Effect

Authors: Israelov, Tummala

Title: Being Right is Not Enough: Buying Options to Bet on Higher Realized Volatility

Link: https://papers.ssrn.com/sol3/papers.cfm?abstract_id=3248500

Abstract:

Speculators who wish to bet on higher future volatility often purchase options to “go long volatility.” Should investors who buy options expect to profit when realized volatility increases? If so, under what conditions? To answer these questions, we conduct an analysis of the relationship between long volatility performance (buying options) and contemporaneous changes in volatility. We find that buying one-month S&P 500 options is only consistently profitable in the highest decile of changes in one-month volatility. Buying options consistently loses money in the lowest seven deciles of changes in volatility. We then study the trade entry and exit timing required to retain the profits from long option positions during significant volatility increases. We find similar results in global equity option markets.

Notable quotations from the academic research paper:

"During most of the mid-2010s, the S&P 500 Index’s volatility hovered near its historical lows. This calm environment has led many investors to ask whether low volatility presents an opportunity to obtain “cheap” portfolio downside protection by purchasing index options. Israelov and Nielsen (2015) show that the answer to this question is no. They show that the Volatility Risk Premium (VRP) also exists in low volatility environments, and therefore that portfolio protection is still expensive even in calm markets.

Portfolio protection, however, is not the only rationale for purchasing options. A long option position allows a speculator to bet on rising volatility. Many proponents of long volatility exposure often advocate this trade in a low implied volatility market environment. Heightened levels of uncertainty, geopolitical risk, or merely a reversion to long-term volatility are some of the arguments put forth by those who expect volatility to spike.

A recommendation to buy options to capture a predicted increase in volatility is predicated on the assumption that investors profit from long options (or long volatility) positions when volatility increases. This paper tests that assumption.

Although it may seem unintuitive, we show that long volatility positions can lose money even when realized volatility rises. How can this be true? Because, long volatility investors must overcome the well-documented VRP – the difference between implied and realized volatility – just to break even. On average this VRP spread is around 3% in the S&P 500. Therefore, the VRP spread typically accrues to the volatility seller, paid by the long volatility investor. As such, long volatility investors enter their trade facing a significant head wind.

volatility risk premium

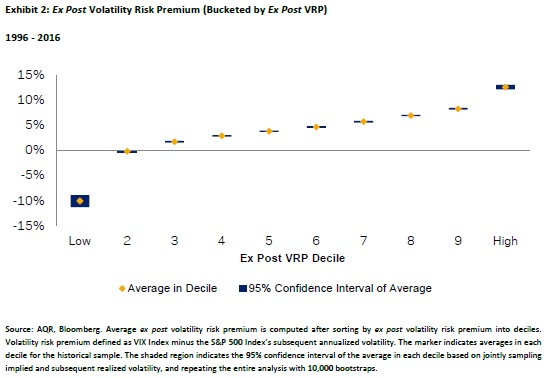
Exhibit 2 sorts the ex post VRP into deciles and reports the average within each decile. On average, equity index options have been richly priced, with an average VRP of 3.0%. The VRP was positive around 85% of the time. Correspondingly, Exhibit 2 shows that, on average, the VRP is positive in eight of the ten deciles, approximately flat in one decile, and negative in one decile. This result implies that long volatility positions in one-month equity index options have been profitable infrequently.

long options returns

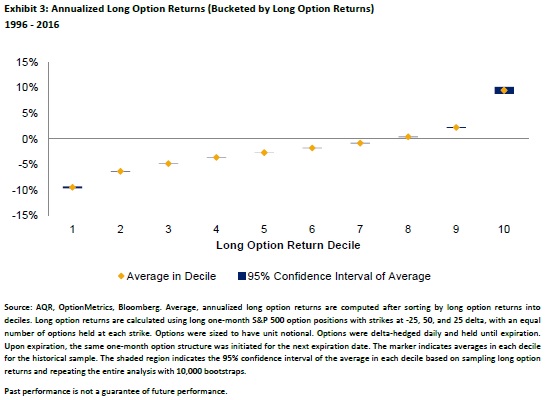
Exhibit 3 sorts the returns of the long option portfolios into deciles, and reports their average annualized return within each decile. Similar to Exhibit 2, Exhibit 3 shows that long option portfolios were infrequently profitable (28% of the time). Average returns were negative in seven of the ten deciles, flat in one decile, and profitable in two. Sorting on actual profitability reveals that there are relatively few profit opportunities.

Volatility mean-reverts over the long run. With equity volatility at historical lows in the mid-2010s, many market commentators suggested long volatility positions in order to bet on increases in volatility. But are bets on increasing volatility actually profitable when volatility increases?

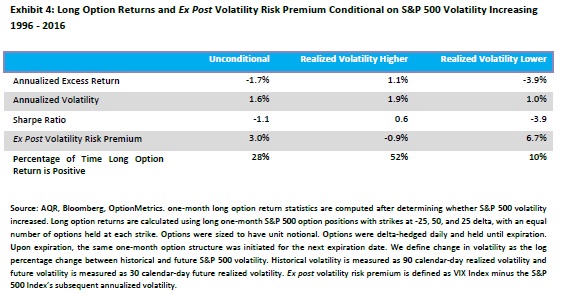
performance table

Using our change in volatility measure, we document that over 30-day periods volatility increased 43% of the time in the S&P 500 between 1996 and 2016. Exhibit 4 reports the long option portfolio’s return properties conditional on only holding options during those 30-day periods in which volatility actually increased. For a more complete picture, the exhibit also reports return properties of the unconditional long option portfolio in which the investor does not attempt to time, as well as return properties conditional on periods in which volatility decreased. Having perfect foresight into whether equity markets become more volatile is profitable, but not reliably so. The conditional ex post VRP is -0.9% during periods in which volatility increased versus the 3.0% unconditional VRP. During periods when volatility increased, the average conditional delta-hedged long option annualized return is 1.1%, with a 0.6 Sharpe ratio. This is certainly better than the unconditional long option annualized return of -1.7%, with a -1.1 Sharpe ratio, and considerably better than the conditional long option annualized return of -3.9% and corresponding -3.9 Sharpe ratio during periods when volatility decreased. However, even when realized volatility increases, long option returns are only profitable about half the time. A small set of out-sized volatility increases is what led to positive conditional average long option returns. This suggests that even knowing with certainty that volatility will increase is not enough to reliably profit from a long volatility position. The investor is left with a coin flip in terms of the hit rate of holding a long option position in this scenario.

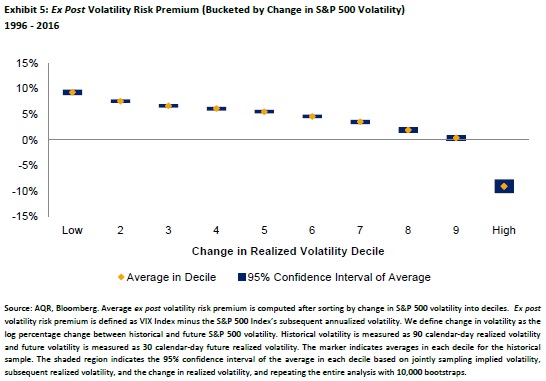
performance table

Then what condition is sufficient to reliably profit? We sort the ex post VRP into deciles by change in volatility and report the average in each decile in Exhibit 5. The ex post VRP is only negative in the tenth decile. It is also interesting that the first decile’s average VRP is more positive than the tenth decile’s is negative.

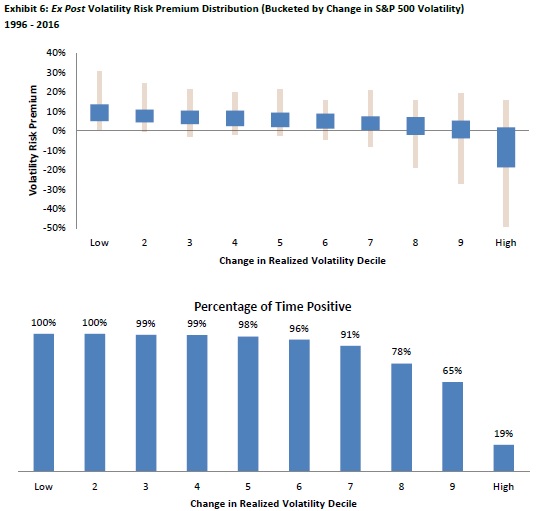
distribution

Exhibit 6 shows the distribution of the ex post VRP within each decile. The ex post VRP was positive more than 90% of the time in seven of the ten deciles, and positive more than 65% of the time in the eighth and ninth decile. The only decile in which the ex post VRP was consistently negative was the tenth decile. Correspondingly, large increases in volatility are the only time that we expect long option positions to be profitable.

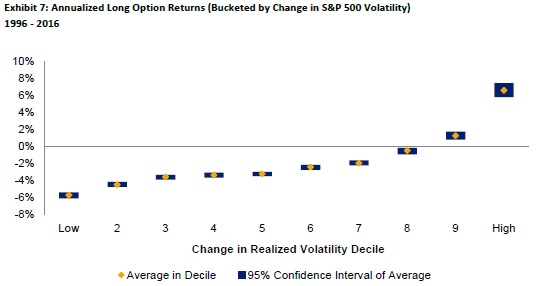
annualizaed option returns

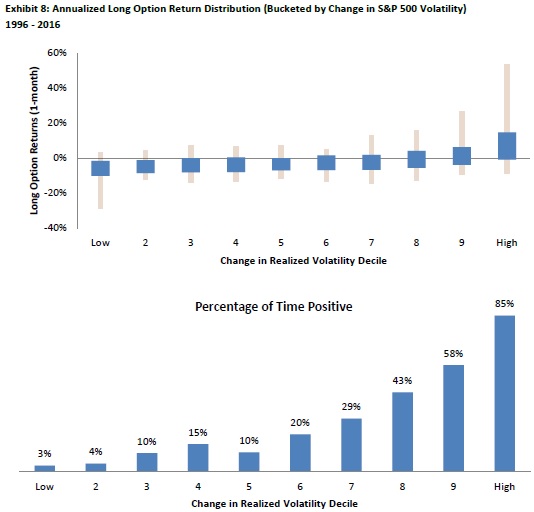
Realized option returns are likely more interesting to option investors than the difference between implied and realized volatility. In that regard, we next sort long option returns into deciles by change in volatility, and report the average annualized return in each decile in Exhibit 7.

annualizaed option returns distribution

Average long option returns were negative in eight of the ten deciles. Exhibit 8 shows the distribution of long option returns in each decile. Long option returns were consistently negative in most deciles, positive slightly more than half the time in the ninth decile, and consistently positive (85% of the time) in the tenth decile.

Overall, the results for long option returns are similar to those found for the ex post VRP. To consistently profit from a long volatility position on the basis of forecasting changes in volatility, you would have had to predict a 10% probability outcome. The average, annualized long option return in this decile was 6.6% and the average return across the other nine deciles was -2.7%.

Due to these considerations, tactical long volatility traders face a steep uphill battle. Managers who are able to successfully implement this strategy should be given credit for demonstrating exceptional skill (or congratulated for their good luck). However, some amount of healthy skepticism is likely warranted for those who claim to consistently have such exceptional skill."


Are you looking for more strategies to read about? Check /Screener

Do you want to see performance of trading systems we described? Check /Chart/Performance

Do you want to know more about us? Check /Home/About


Follow us on:

Facebook: https://www.facebook.com/quantpedia/

Twitter: https://twitter.com/quantpedia

Continue reading

VVIX Index Predicts Value/Growth Return Spread

27.September 2018

A new financial research paper has been published and is related value/growth style returns:

#26 – Value (Book-to-Market) Anomaly

Author: Krause

Title: Risk and Uncertainty in Style Rotation

Link: https://papers.ssrn.com/sol3/papers.cfm?abstract_id=3209491

Abstract:

The effectiveness of the VIX index as a leading indicator of style returns has been examined in the finance literature, finding that increases in this “fear index” lead to outperformance of “value” vs “growth” stocks, although the effect has attenuated over time. This study introduces the concept of “uncertainty” as an additional indicator of returns to value, as measured by the CBOE® VVIX (“volatility of volatility”), that that may be considered as a proxy for “uncertainty” in the Knightian sense. Increases in uncertainty (the VVIX index) lead to negative short-term returns to value. Additional macroeconomic variables provide additional incremental information regarding these phenomena.

Notable quotations from the academic research paper:

"this study examines the effectiveness of the two CBOE® volatility indices as leading indicators of style returns (value vs. growth), and the results of the analysis indicate that the CBOE® VVIX index provides significant incremental information regarding the interaction of returns, volatility, and uncertainty on a lead-lag basis. The initial analysis of the VIX index relative to style returns is consistent with Boscaljon et al. (2011) since it finds largely insignificant short-term effects of the VIX index on returns to value.

However, innovations in the VVIX index indicate significant negative returns to value. The inclusion of several macroeconomic variables provides additional explanatory information since the VIX index indicates positive returns to value under certain conditions. The main contribution to the literature of this paper is the introduction of the additional concept of “uncertainty” into the returns to value analysis using highly liquid ETFs. The availability of these products, and their recent exponential growth, provides an opportunity to examine the relation of expected volatility and uncertainty to growth and value using similar, easily tradable and low-cost instruments.

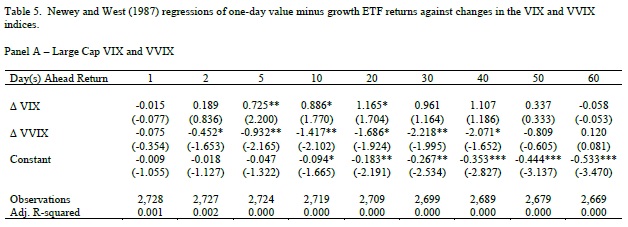
In order to further explore the returns to value from uncertainty as proxied by the VVIX index, in Table 5, changes in the VVIX index are included in the estimations of Equation 2 as a potentially further explanatory, independent variable. In this estimation, there is one indication of the potential returns to value from volatility in conjunction with uncertainty. In Panel A, for the large-cap ETFs, the results for five-day returns to value are significantly positive for changes in the VIX index (volatility) at the five percent level, although some other coefficients (10- and 20- day) are significant at the ten percent level. Additionally, the coefficients are significant and negative for changes in the VVIX index (uncertainty) over five- to thirty-day time periods (the 20-day coefficient is marginally significant) at the five percent level.

VVIX vs value/growth stocks

"


Are you looking for more strategies to read about? Check /Screener

Do you want to see performance of trading systems we described? Check /Chart/Performance

Do you want to know more about us? Check /Home/About


Follow us on:

Facebook: https://www.facebook.com/quantpedia/

Twitter: https://twitter.com/quantpedia

Continue reading

Bitcoin Returns Resemble Returns of High Sentiment Beta Stocks

21.September 2018

A new financial research paper has been published and is related to cryptocurrency trading strategies:

Author: Jo, Park, Shefrin

Title: Bitcoin and Sentiment

Link: https://papers.ssrn.com/sol3/papers.cfm?abstract_id=3230572

Abstract:

On the surface, cryptocurrencies share important features in common with high sentiment beta stocks. Baker and Wurgler (2007) identify high sentiment betas with small startup firms that have great growth potential. This paper investigates the degree to which, during the period July 18, 2010 to February 26, 2018, the return to bitcoin displayed the characteristics of a high sentiment beta stock. Using a sentiment-dependent factor model, the analysis indicates that in large measure, bitcoin returns resembled returns to high sentiment beta stocks.

Notable quotations from the academic research paper:

"The main objective of this paper is to investigate the degree to which bitcoin resembles a “high sentiment beta” stock, a term introduced by Baker and Wurgler (2007). They note that some stocks are more vulnerable to being mispriced than others, stating: “stocks of low capitalization, younger, unprofitable, high-volatility, non–dividend paying, growth companies … are likely to be disproportionately sensitive to broad waves of investor sentiment.” This statement implies that when investors become excessively optimistic about stocks in general, they become even more optimistic about stocks of small firms that, while not currently profitable, are perceived as holding great potential for future profitability. Baker and Wurgler describe stocks that are disproportionately sensitive to investor sentiment as featuring “high sentiment beta.”

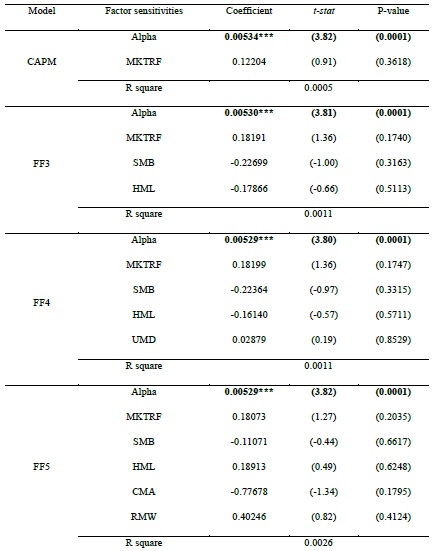
bitcoin's alpha

Table 3 presents the coefficient estimates of CAPM, Fama-French three, Carhart four, and Fama-French five factor models for U.S. daily excess returns on excess Bitcoin Return. We note that Jensen’s alpha is significant and positive at the 0.1% significance level in all the above asset pricing models during our sample period. Notice too that all of the coefficients of CAPM and Fama-French market and other factors are insignificant, suggesting that bitcoin returns are largely nonsystematic, at least from the perspective of a traditional factor pricing model.

There are at least three different channels by which sentiment can impact bitcoin returns. The first channel is bitcoin-specific, which is reflected in bitcoin’s Jensen’s alpha. The second channel involves the sensitivity of bitcoin’s price to general market sentiment. Baker and Wurgler (2007) describe such sentiment as general optimism about stocks.

The third channel involves the manner in which sentiment mediates fundamental factor loadings, as noted by Baker and Wurgler (2006). Of special interest is the impact of sentiment on factor loadings associated with size (SMB) and profitability (RMW), because of the analogy between bitcoin and Baker and Wurgler’s association of high sentiment beta to small startup firms that are not yet profitable but possess great growth potential. Because bitcoin is the cryptocurrency most closely associated with a blockchain technology, and blockchain activity is positively related to general economic activity, our prior expectation is that bitcoin returns will be statistically related to the market risk premium.

factor loadings

The results displayed in Table 5 Panel A indicate the following. First, the returns to bitcoin are statistically related to the market risk premium. Moreover, the interaction term involving the market risk premium features a negative coefficient. Therefore, when sentiment declines, bitcoin returns become more sensitive to the market risk premium.

Factor loading estimates for two other interaction terms are statistically significant. The first pertains to size (SMB), with a negative sign, and the second pertains to investment (CMA), with a positive sign. The bitcoin size effect is that when sentiment declines, bitcoin returns share a common feature with the stocks of small firms. This finding has the same flavor as Baker and Wurgler’s finding that the size effect only applies in connection with periods of negative sentiment. In particular, this finding is in line with the intuitive association of new cryptocurrencies to the stocks of small startups. The bitcoin investment effect is that when sentiment declines, bitcoin returns share a commonality with firms that invest aggressively rather than conservatively. In this respect, aggressive investment reduces firms’ free cash flows and equity returns, whose effect on bitcoin is most pronounced during times in which investors generally become more bearish.

Table 5 Panel A indicates that bitcoin returns are statistically related to the coefficient on the Fama-French profitability factor RMW ( 5 ), and with a positive sign. Therefore, the return to holding bitcoin is generally positive during periods when the stocks of higher profitability firms outperform the stocks of lower profitability firms. At first glance, this finding appears to be at odds with bitcoin returns resembling the returns to the stocks of unprofitable firms. However, in interpreting this finding, it is important to keep in mind that the return to small growth stocks cannot be explained by the Fama-French three-factor model, as those stocks have historically earned low returns, not the high returns predicted by the model. Similarly, in the extended Fama-French factor model, profitability is related differently to small, growth stocks than to other stocks.

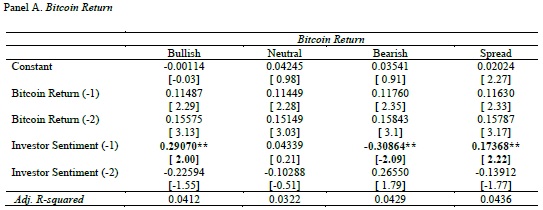
One of the main implications of the regression analysis above is that sentiment impacts bitcoin returns indirectly through traditional factors, but with no direct discernable direct effect. This leaves open the question of how bitcoin returns and sentiment have coevolved over time. To investigate this issue, we employ Vector Auto Regression (VAR) models that focus on the dynamic relationship between Investor sentiment index and Bitcoin Return.

VAR model

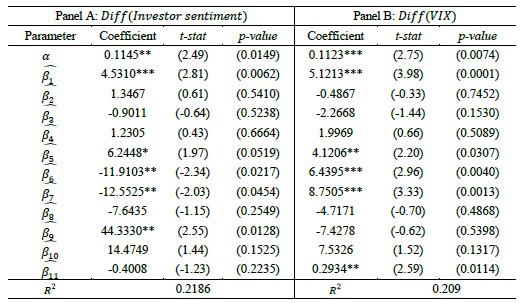
The results suggest that while Bitcoin Returns do not Granger-cause Investor Sentiment Index for the Investor Sentiment equations (Panel B), Investor Sentiment Index does Granger-cause Bitcoin Returns for the ratio of the Bitcoin Returns equation (Panel A). In particular, bullish (bearish) investor sentiment significantly drives Bitcoin Returns positively (negatively). It is noteworthy that although the time period of the bitcoin price decrease (i.e., January-February, 2018) is much shorter, and the percentage of bearish investor sentiment is somewhat lower, the negative impact of bearish investor sentiment on Bitcoin Returns seems to be a bit larger than the positive impact of bullish investor sentiment on Bitcoin Returns.

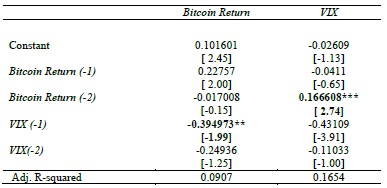
We further conduct VAR analysis with alternative measure of investor sentiment, Volatility Index (VIX) for robustness, and present the results in Table 9.

sensitivity to vix

In Bitcoin Return equation, the coefficient on VIX (lagged 1) is significantly negative, which implies that a change in VIX index from day t–30 to day t negatively affects bitcoin return. This negative impact of VIX on Bitcoin Returns can be interpreted to mean that investors’ fear about the future market tends to induce a decrease in the price of bitcoin. Intuitively, when the volatility index increases, investors grow afraid of increased volatility, and sell bitcoin, lowering the bitcoin price. Expressed differently, if the VIX decreases, then the market is less volatile, and investors become willing to take risks to earn above average returns by buying bitcoin, thereby driving up its price."


Are you looking for more strategies to read about? Check /Screener

Do you want to see performance of trading systems we described? Check /Chart/Performance

Do you want to know more about us? Check /Home/About


Follow us on:

Facebook: https://www.facebook.com/quantpedia/

Twitter: https://twitter.com/quantpedia

Continue reading
Subscription Form

Subscribe for Newsletter

 Be first to know, when we publish new content
logo

Log in