Using Deep Neural Networks to Enhance Time Series Momentum

22.June 2019

A new research paper related to:

#118 – Time Series Momentum

Authors: Lim, Zohren, Roberts

Title: Enhancing Time Series Momentum Strategies Using Deep Neural Networks

Link: https://papers.ssrn.com/sol3/papers.cfm?abstract_id=3369195

Abstract:

While time series momentum is a well-studied phenomenon in finance, common strategies require the explicit definition of both a trend estimator and a position sizing rule. In this paper, we introduce Deep Momentum Networks — a hybrid approach which injects deep learning based trading rules into the volatility scaling framework of time series momentum. The model also simultaneously learns both trend estimation and position sizing in a data-driven manner, with networks directly trained by optimising the Sharpe ratio of the signal. Backtesting on a portfolio of 88 continuous futures contracts, we demonstrate that the Sharpe-optimised LSTM improved traditional methods by more than two times in the absence of transactions costs, and continue outperforming when considering transaction costs up to 2-3 basis points. To account for more illiquid assets, we also propose a turnover regularisation term which trains the network to factor in costs at run-time.

Notable quotations from the academic research paper:

"While numerous papers have investigated the use of machine learning for financial time series prediction, they typically focus on casting the underlying prediction problem as a standard regression or classification task – with regression models forecasting expected returns, and classification models predicting the direction of future price movements. This approach, however, could lead to suboptimal performance in the context time-series momentum for several reasons.

Firstly, sizing positions based on expected returns alone does not take risk characteristics into account – such as the volatility or skew of the predictive returns distribution — which could inadvertently expose signals to large downside moves. This is particularly relevant as raw momentum strategies without adequate risk adjustments, such as volatility scaling, are susceptible to large crashes during periods of market panic. Furthermore, even with volatility scaling – which leads to positively skewed returns distributions and long-option-like behaviour – trend following strategies can place more losing trades than winning ones and still be profitable on the whole – as they size up only into large but infrequent directional moves. The fraction of winning trades is a meaningless metric of performance, given that it cannot be evaluated independently from the trading style of the strategy. Similarly, high classification accuracies may not necessarily translate into positive strategy performance, as profitability also depends on the magnitude of returns in each class. In light of the deficiencies of standard supervised learning techniques, new loss functions and training methods would need to be explored for position sizing – accounting for tradeoffs between risk and reward.

In this paper, we introduce a novel class of hybrid models that combines deep learning-based trading signals with the volatility scaling framework used in time series momentum strategies – which we refer to as the Deep Momentum Networks (DMNs). This improves existing methods from several angles.

Firstly, by using deep neural networks to directly generate trading signals, we remove the need to manually specify both the trend estimator and position sizing methodology – allowing them to be learnt directly using modern time series prediction architectures.

Secondly, by utilising automatic differentiation in existing backpropagation frameworks, we explicitly optimise networks for risk-adjusted performance metrics, i.e. the Sharpe ratio, improving the risk profile of the signal on the whole.

Lastly, retaining a consistent framework with other momentum strategies also allows us to retain desirable attributes from previous works – specifically volatility scaling, which plays a critical role in the positive performance of time series momentum strategies. This consistency also helps when making comparisons to existing methods, and facilitates the interpretation of different components of the overall signal by practitioners.
performance of trading strategies

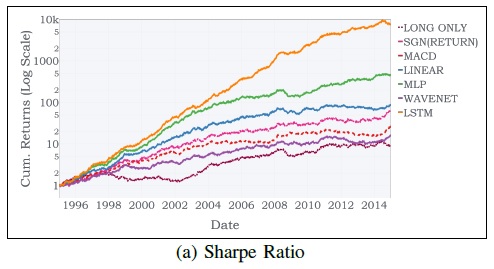
Referring to the cumulative returns plots for the rescaled portfolios in Exhibit 4, the benefits of direct outputs with Sharpe ratio optimisation can also be observed – with larger cumulative returns observed for linear, MLP and LSTM models compared to the reference benchmarks. Furthermore, we note the general underperformance of models which use standard regression and classification methods for trend estimation – hinting at the difficulties faced in selecting an appropriate position sizing function, and in optimising models to generate positions without accounting for risk."


Are you looking for more strategies to read about? Check /Screener

Do you want to see performance of trading systems we described? Check /Chart/Performance

Do you want to know more about us? Check /Home/About


Follow us on:

Facebook: https://www.facebook.com/quantpedia/

Twitter: https://twitter.com/quantpedia

Youtube: https://www.youtube.com/channel/UC_YubnldxzNjLkIkEoL-FXg


Continue reading

Time-Series Momentum Works Everywhere

16.June 2019

It looks that time series momentum is one of the most prevalent effects in finance. Once again, an academic paper shows that it works in every corner of financial markets – in traditional assets, alternative assets and even in long short equity factors …

Authors: Babu, Levine, Ooi, Pedersen, Stamelos

Title: Trends Everywhere

Link: https://papers.ssrn.com/sol3/papers.cfm?abstract_id=3386035

Abstract:

We provide new out-of-sample evidence on trend-following investing by studying its performance for 82 securities not previously examined and 16 long-short equity factors. Specifically, we study the performance of time series momentum for emerging market equity index futures, fixed income swaps, emerging market currencies, exotic commodity futures, credit default swap indices, volatility futures, and long-short equity factors. We find that time series momentum has worked across these asset classes and across several trend horizons. We examine the co-movement of trends across asset classes and factors, the performance during different market environments, and discuss the implications for investors.

Notable quotations from the academic research paper:

"Our full data contains 156 assets, of which 58 are the “traditional assets” studied in the literature cited above, 82 are “alternative assets,” meaning futures, forwards, and swaps not previously studied, and 16 are “factors” constructed as long-short equity portfolios. In other words, we collect so much new data that the number of new assets outnumbers the “traditional assets” studied in the literature. While we broaden the universe, we only consider investable liquid assets or strategies.

We find strong evidence for time series momentum across the assets and factors that we study. Over our sample period, the gross Sharpe ratio of 12-month time series momentum for traditional assets is 1.17, and the strategy delivers an even higher Sharpe ratio of 1.34 for the alternative assets. The Sharpe ratio for long-short equity factors is 0.95, and, when we diversify across all three asset groups, the combined trend-following strategy yields a gross Sharpe ratio of 1.60.

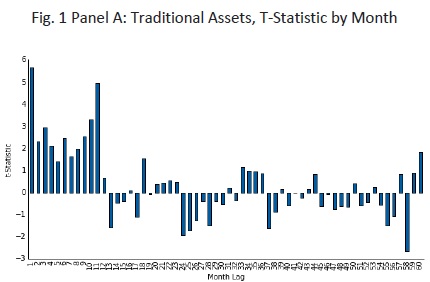
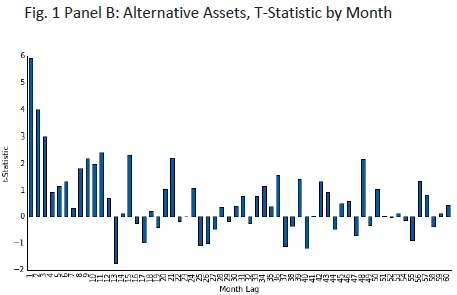
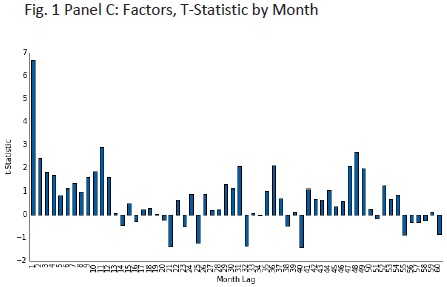
Figure 1 reports the t-statistics from the regression, using lags ranging from 1 month to 60 months. Panel A reports the results for traditional assets. The positive t-statistics for the first 12 months indicate return continuation – that is, trends – and t-statistics larger than 2 in magnitude are statistically significant, consistent with earlier findings. For lags above 12 months, we see some negative coefficients, indicating trend reversals, although these tend to be statistically insignificant. Panel B extends the analysis to alternative assets, which also display strong return continuation for the first 12 months, and more mixed returns beyond 12 months. Panel C extends the analysis to equity factor portfolios, showing that time series predictability is feature of more than just traditional and alternative assets, but also of equity factors, with positive t-statistics across the most recent 12 months. These results demonstrate the remarkable pervasiveness of return continuation for the most recent 12 months, but not for returns beyond 12 months, across a range of assets and equity factors.

Traditional assets. Our data for traditional assets are the prices of 58 liquid futures and forwards, consisting of 9 developed equity index futures, 13 developed bond futures, 12 cross-currency forward pairs (from nine underlying currencies), and 24 commodity futures.

t-stat for traditional assets

Alternative assets. Our data for alternative assets consist of prices for 7 emerging market equity index futures, 17 fixed income swaps, 24 emerging market cross currency pairs, 21 commodity futures, 5 credit default swap indices, and 8 volatility futures.

t-stat for alternative assets

Equity factors. For equity factors, our data consist of 16 of the most well-cited and robust single-name stock selection factors

t-stat for factors

"


Are you looking for more strategies to read about? Check /Screener

Do you want to see performance of trading systems we described? Check /Chart/Performance

Do you want to know more about us? Check /Home/About


Follow us on:

Facebook: https://www.facebook.com/quantpedia/

Twitter: https://twitter.com/quantpedia

Youtube: https://www.youtube.com/channel/UC_YubnldxzNjLkIkEoL-FXg


Continue reading

Equity Momentum in Years 1820-1930

10.June 2019

Once again, our favorite type of study – an out of sample research study based on data from 19th and beginning of 20th century.  Interesting research paper related to all equity momentum strategies …

Authors: Trigilia, Wang

Title: Momentum, Echo and Predictability: Evidence from the London Stock Exchange (1820-1930)

Link: https://papers.ssrn.com/sol3/papers.cfm?abstract_id=3373164

Abstract:

We study momentum and its predictability within equities listed at the London Stock Exchange (1820-1930). At the time, this was the largest and most liquid stock market and it was thinly regulated, making for a good laboratory to perform out-of-sample tests. Cross-sectionally, we find that the size and market factors are highly profitable, while long-term reversals are not. Momentum is the most profitable and volatile factor. Its returns resemble an echo: they are high in long-term formation portfolios, and vanish in short-term ones. We uncover momentum in dividends as well. When controlling for dividend momentum, price momentum loses significance and profitability. In the time-series, despite the presence of a few momentum crashes, dynamically hedged portfolios do not improve the performance of static momentum. We conclude that momentum returns are not predictable in our sample, which casts some doubt on the success of dynamic hedging strategies.

Notable quotations from the academic research paper:

"This paper studies momentum and its predictability in the context of the rst modern stock market, the London Stock Exchange (LSE), from the 1820s to the 1920s.

Factors' performance. Compared to the U.S. post-1926, we find that the market has been less profi table – averaging 5% annually (but also less volatile). Its Sharpe ratio has been 0.34, not too far from the 0.43 of CRSP. The Small-Minus-Big (SMB) factor delivered a 4.85% average annual return, much higher than that found in U.S. post-1926. The risk-free rate, as proxied by the interest on British Government's consols, has been close to 3.3% throughout the period, despite the many large changes in supply (i.e., in the outstanding stock of public debt). As for momentum (UMD), consistent with the existing evidence it has been the most profi table factor – with an average annual return close to 9% – and the most volatile – with 20% annual standard deviation.

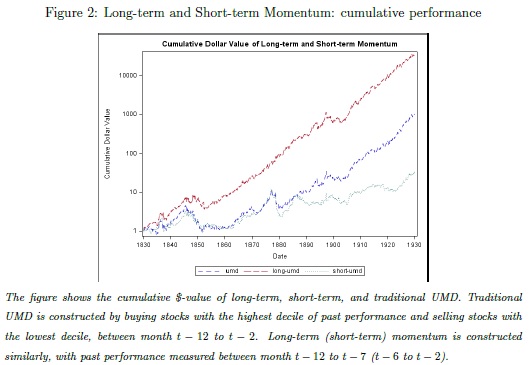
Momentum in years 1820-1930

Dissecting momentum returns. Recent literature debates whether momentum is long or short term. In our sample, UMD profi ts strongly depend on the formation period: they average at 10.6% annually for long-term formation (12 to 7 months) and 3.8% for short-term formation (6 to 2 months). So, our out-of-sample test confi rms that momentum is better described as a within-year echo.

To investigate the role of fundamentals as drivers of price momentum, we construct two sets of earnings momentum portfolio. The first earnings momentum portfolio is constructed based on the past dividend paid by the firm relative to its market cap. The portfolio buys stocks of the highest dividend-paying firms over a 12 to 2 months formation period, and shorts the stocks of the lowest ones. We find strong evidence that our dividend momentum (DIV) strategy is pro fitable across our sample: it yields a 5% average annual return with a standard deviation of 12%.

The second earnings momentum portfolio is constructed based on the dividend innovations. Speci cally, we look at the change of dividend year to year, and construct the DIV portfolio. The portfolio buys stocks with the highest change in dividend paid and shorts the stocks with the lowest ones. The DIV portfolio yield an over 24% return with a standard deviation of only 13.2%.

To discern whether price momentum seems driven by dividend momentum, we also test whether the alpha of the static UMD portfolio remains signi ficant and positive after we control for the Fama-French three factors plus the dividend momentum portfolio. In the EW sample, price momentum delivers excess returns of about 8.8% after controlling for the Fama-French three factors, signifi cant at the 1%. However, introducing DIV momentum reduces the alpha to 2.9%, and the alpha is insigni ficantly di fferent from zero. As for VW portfolios, they deliver higher alphas but are less precisely estimated. In this case, the annualized alpha of price momentum drops by half from 11.2% to 5.8% after controlling for DIV momentum.

Momentum crashes. We find that the distribution of monthly momentum returns is left skewed and displays excess kurtosis. Within the five largest EW (VW) momentum crashes, investors lost 18% (26%) on average. The difference between the beta of the winners and that of the losers has been -2.4 (-3.5), on average, and the losses stemmed mostly from the performance of the losers, which averaged at 24% (21%) monthly return. We find little action in the winners portfolio, which returned on average 2% (-6%).

Predictability and dynamic hedging. Dynamic hedging consists in levering the portfolio when its realized volatility has been low and/or the market has been under-performing, and de-levering otherwise. We begin our analysis by looking at whether set of variables helps predicting momentum returns in our sample, and we find that it does not. Probably, this is because the crashes in our sample are more heterogeneous both in terms of origins and in terms of length. In particular, they do not necessarily occur when the market rebounds after a long downturn, and they tend to last for shorter periods of time. As a consequence, our out-of-sample test of the dynamic hedged UMD strategy shows that either it underperforms static momentum, or it does not improve its returns.

"


Are you looking for more strategies to read about? Check /Screener

Do you want to see performance of trading systems we described? Check /Chart/Performance

Do you want to know more about us? Check /Home/About


Follow us on:

Facebook: https://www.facebook.com/quantpedia/

Twitter: https://twitter.com/quantpedia

Youtube: https://www.youtube.com/channel/UC_YubnldxzNjLkIkEoL-FXg


Continue reading

Video Presentation for Bear Market Strategy

5.June 2019

We have a new Youtube video + online presentation for all people who liked our short article about the commodity strategy which can be used as a hedge / diversification during bear markets …

Youtube video:


Online presentation:

"


Are you looking for more strategies to read about? Check /Screener

Do you want to see the performance of trading systems we described? Check /Chart/Performance

Do you want to know more about us? Check /Home/About


Follow us on:

Facebook: https://www.facebook.com/quantpedia/

Twitter: https://twitter.com/quantpedia

Youtube: https://www.youtube.com/channel/UC_YubnldxzNjLkIkEoL-FXg


Continue reading

Skewness / Lottery Effect in Commodities

30.May 2019

We at Quantpedia are continually building a database of ideas for quantitative trading strategies derived out of the academic research papers. Motivated by the recent fall of the S&P500 index at the end of 2018, we have added a new filtering field into our Screener, which you can use to find strategies that can be utilized as a hedge/diversification to equity market risk factor during bear markets. We would like to present one strategy that is profitable itself, but with an added value of negative correlation with the equity market, to be able to perform in the desired way also during the " bad" times.

The strategy we would be talking about can be found in our database under the name #281 – Skewness Effect in Commodities and is built on a research paper written by Fernandez-Perez, Frijns, Fuertes and Miffre – The Skewness of Commodity Futures Returns. Guys at AlphaArchitect have been really generous and they have provided a space for us to write a short article in which we 1) briefly discuss the lottery effect, 2) we discuss the research on this topic in the context of commodities, and 3) we conduct an independent replication effort of the commodity lottery effect identified in academic research.

Authors: Vojtko, Padysak

Title: Skewness Effect in Commodities

Link: https://alphaarchitect.com/2019/05/30/skewness-effect-in-commodities/

Shortly:

"Economies and markets have their seasonalities and cyclicality, where bull markets alternate with bear markets. Bull markets are connected with particularly good performance of the stocks and profiting investors. However on the other hand, during the bear markets, investors tend to lose in the falling equity market. Therefore, during these stressful times, it might be better for practitioners to invest in a portfolio that is negatively correlated with the equity market to gain profit instead of counting loses.

There is strong evidence that investors have a preference for lottery-like assets (the assets that have a relatively small probability of a large payoff or in other words, big skewness). Therefore, it should be profitable to not play the lottery, but rather be “the lottery ticket issuer“ by shorting the commodities with high skewness and going long commodities with low skewness. Additionally, commodities as an asset class are quite distinct from equities and therefore they can often be used as a diversifier to equities.

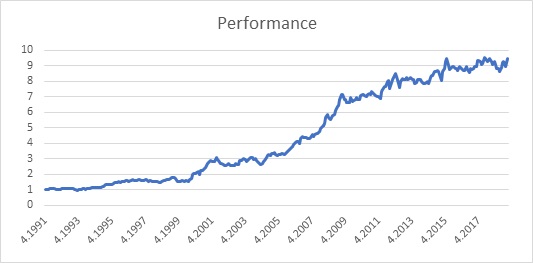
Lottery strategy in commodites

Clearly, the strategy is profitable, a dollar invested in 1991 would result in more than 9 dollars by 2019, which results in a yearly performance of nearly 8,5%. Moreover, the risk of the strategy is relatively low, with the maximal drawdown of around 16 %, which results in a return to a drawdown ratio of slightly more than 0,5.

Our research suggests that the performance of the equity market represented by the S&P500 index is negatively correlated with the performance of the skewness strategy. Therefore, if the equity market performs badly, our strategy should be still profitable.

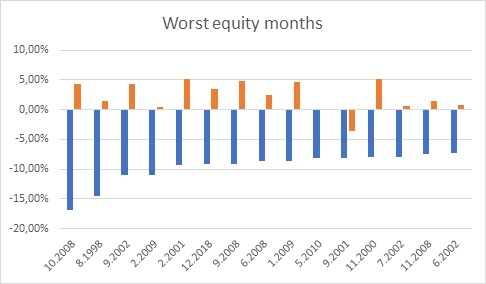
What is more important, if we would look upon the worst months of S&P500 index (blue bars) and compare it with the performance of the strategy (orange bars), we would see the performance of the suggested strategy is at most times positive and therefore the investor would be able to hedge his equity portfolio.

Worst equity month performance vs. commodity strategy

To sum it up, the lottery anomaly in commodities is alive and performs in a desirable way also in the recent period. Moreover, the profitable strategy based on this anomaly could also serve as a hedge against equities and offer a profitable possibility to invest during times when equities are in bear markets.

Authors:
Radovan Vojtko, CEO, Quantpedia.com
Matus Padysak, Analyst, Quantpedia.com

"


Are you looking for more strategies to read about? Check /Screener

Do you want to see the performance of trading systems we described? Check /Chart/Performance

Do you want to know more about us? Check /Home/About


Follow us on:

Facebook: https://www.facebook.com/quantpedia/

Twitter: https://twitter.com/quantpedia


Continue reading

Transaction Costs of Factor Strategies

25.May 2019

A very important research papers related to all equity factor strategies …

Authors: Li, Chow, Pickard, Garg

Title: Transaction Costs of Factor Investing Strategies

Link: https://papers.ssrn.com/sol3/papers.cfm?abstract_id=3359947

Abstract:

Although hidden, implicit market impact costs of factor investing strategies may substantially erode the strategies' expected excess returns. The authors explain these market impacts costs and model them using rebalancing data of a suite of large and longstanding factor investing indices. They introduce a framework to assess the costs of rebalancing activities, and attribute these costs to characteristics such as rate of turnover and the concentration of turnover, which intuitively describe the strategies' demands on liquidity. The authors evaluate a number of popular factor-investing strategy implementations and identify how index construction methods, when thoughtfully designed, can reduce market impact costs.

Notable quotations from the academic research paper:

"Factor investing strategies have become increasingly popular. According to data from Morningstar Direct, assets under management (AUM) in factor investing ETFs and mutual funds across global markets increased from just below US$75 billion in 2005 to more than US$800 billion by the end of 2016.

In practice, when a provider rebalances an index, most managers tracking it execute the necessary transactions near the close of the rebalancing day in order to minimize their portfolio’s tracking error. The fund managers may appear to be perfectly tracking the index; in another words, minimizing implementation shortfall, which is the aggregate difference between the average traded price and the closing price of each of the index's underlying securities on the rebalancing day. Thus, the total implementation cost of an index fund could be perceived as merely the sum of the explicit costs associated with trading, such as commissions, taxes, ticker charges, and so forth. This notion misses the propagating market impact that trading has on the index’s value. The large volume of buy and sell orders for the same securities, executed at the same time, can result in securities prices moving against the managers, producing losses for both the index and the fund investors. This implicit cost is often overlooked because it is not visible when comparing a fund’s net asset value (NAV) and the index’s value; it can, however, be overwhelmingly large relative to the explicit costs for strategies with massive AUM. This article focuses on unmasking the market impact costs that arise from synchronous buying and selling.

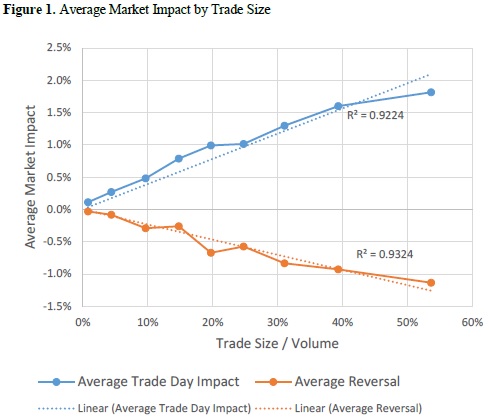
We analyze the behavior of stocks that were traded during the rebalancing of 49 FTSE RAFI™ Indices (henceforth, “the indices”). We find significant evidence of market impact on the rebalancing day and a subsequent price reversal over the next four days. We find that the magnitude of price impact is predictable, because it is directly related to the security’s liquidity and the size of the trade.

Specifically, we identify that a fund incurs approximately 30 basis points (bps) of trading costs due to market impact for every 10% of a stock’s average daily volume (ADV) traded in aggregate by the factor investing index–tracking funds.

Market Impact

Our simple relationship of market impact versus the security’s liquidity and the size of the trade can be used to estimate the implicit transaction costs of rebalancing trades. We apply our model and evaluate the costs of an extended list of popular strategies with various turnover rates, trade sizes, levels of security liquidity, and number of rebalances. We find that, at a modest level of AUM, and assuming all rebalancing trades occur near the end of
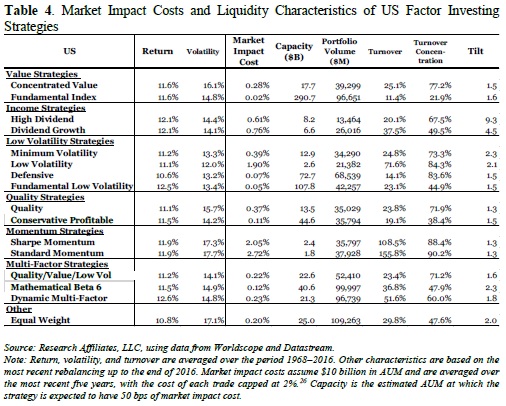
the rebalancing date, the expected transaction costs can significantly erode the expected alpha as indicated by long-term historical backtests. Specifically, with as little as $10 billion in AUM, momentum indexing strategies can have trading costs of 200 bps or more. At the same level of assets, income strategies’ costs are in the 60–80 bps range, and quality strategies’ costs fall below 40 bps. We report the capacities, defined as AUM when expected costs reach a high and fixed level (50 bps a year), of these strategies. We also present an attribution model to relate costs to strategy characteristics and explain in detail how certain styles of investing—for instance, those that trade frequently and those that trade completely in and out of a few illiquid positions—require higher costs than others.

Liquidity characteristics

"


Are you looking for more strategies to read about? Check /Screener

Do you want to see performance of trading systems we described? Check /Chart/Performance

Do you want to know more about us? Check /Home/About


Follow us on:

Facebook: https://www.facebook.com/quantpedia/

Twitter: https://twitter.com/quantpedia


Continue reading

The Impact of Crowding on Alternative Risk Premiums

17.May 2019

Related to all factor strategies …

Author: Baltas

Title: The Impact of Crowding in Alternative Risk Premia Investing

Link: https://papers.ssrn.com/sol3/papers.cfm?abstract_id=3360350

Abstract:

Crowding is a major concern for investors in the alternative risk premia space. By focusing on the distinct mechanics of various systematic strategies, we contribute to the discussion with a framework that provides insights on the implications of crowding on subsequent strategy performance. Understanding such implications is key for strategy design, portfolio construction, and performance assessment. Our analysis shows that divergence premia, like momentum, are more likely to underperform following crowded periods. Conversely, convergence premia, like value, show signs of outperformance as they transition into phases of larger investor flows.

Notable quotations from the academic research paper:

"Crowding risk is listed as one of the most important impediments for investing in alternative risk premia. We contribute to this industry debate by exploring the mechanics of the various ARP in the event of investor flows, and study the implications of crowdedness on subsequent performance.

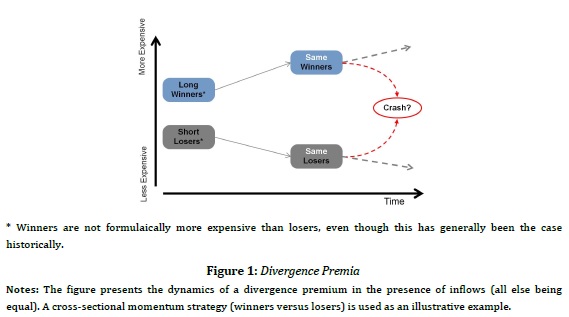
The cornerstone of our methodology is the classification of the ARP strategies into divergence and convergence premia. Divergence premia, like momentum, lack a fundamental anchor and inherently embed a self-reinforcing mechanism (e.g. in momentum, buying outperforming assets, and selling underperforming ones). This lack of a fundamental anchor creates the coordination problem that Stein (2009) describes, which can ultimately have a destabilising effect.

Divergence factor

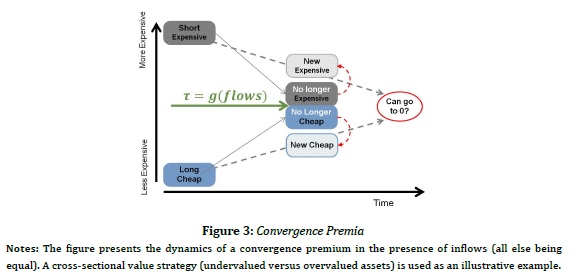
Conversely, convergence premia, like value, embed a natural anchor (e.g. the valuation spread between undervalued and overvalued assets) that acts as an self-correction mechanism (as undervalued assets are no longer undervalued if overbought). Extending Stein’s (2009) views, such dynamics suggest that investor flows are actually likely to have a stabilising effect for convergence premia.

Convergence premia

In order to test these hypotheses we use the pairwise correlation of factor-adjusted returns of assets in the same peer group (outperforming assets, undervalued assets and so on so forth) as a metric for crowding.

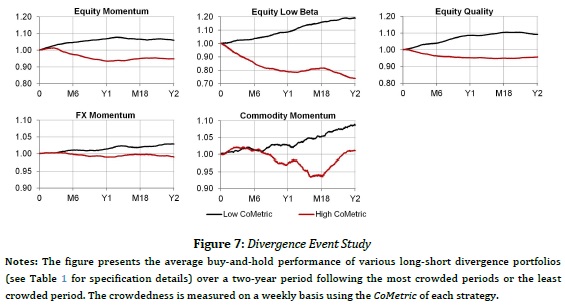
We provide empirical evidence in line with these hypotheses. Divergence premia within equity, commodity and currency markets are more likely to underperform following crowded periods.

All divergence premias

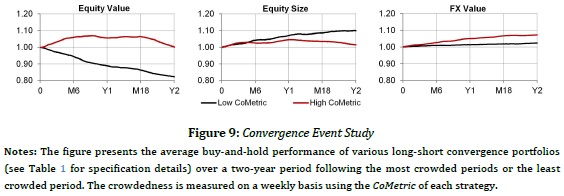
Whereas convergence premia show signs of outperformance as they transition into phases of higher investor flows.

All convergence premias"


Are you looking for more strategies to read about? Check /Screener

Do you want to see performance of trading systems we described? Check /Chart/Performance

Do you want to know more about us? Check /Home/About


Follow us on:

Facebook: https://www.facebook.com/quantpedia/

Twitter: https://twitter.com/quantpedia


Continue reading

News Implied VIX Since The Year 1890

9.May 2019

We present an interesting academic paper with a methodology that allows estimating VIX (volatility risk) since the year 1890 …

Authors: Manela, Moreira

Title: News Implied Volatility and Disaster Concerns

Link: https://papers.ssrn.com/sol3/papers.cfm?abstract_id=2382197

Abstract:

We construct a text-based measure of uncertainty starting in 1890 using front-page articles of the Wall Street Journal. News implied volatility (NVIX) peaks during stock market crashes, times of policy-related uncertainty, world wars and financial crises. In US post-war data, periods when NVIX is high are followed by periods of above average stock returns, even after controlling for contemporaneous and forward-looking measures of stock market volatility. News coverage related to wars and government policy explains most of the time variation in risk premia our measure identifies. Over the longer 1890-2009 sample that includes the Great Depression and two world wars, high NVIX predicts high future returns in normal times, and rises just before transitions into economic disasters. The evidence is consistent with recent theories emphasizing time variation in rare disaster risk as a source of aggregate asset prices fluctuations.

Notable quotations from the academic research paper:

"This paper aims to quantify this “spirit of the times”, which after the dust settles is forgotten, and only hard data remains to describe the period. Specifically, our goal is to measure people’s perception of uncertainty about the future, and to use this measurement to investigate what types of uncertainty drive aggregate stock market risk premia.

We start from the idea that time-variation in the topics covered by the business press is a good proxy for the evolution of investors’ concerns regarding these topics.

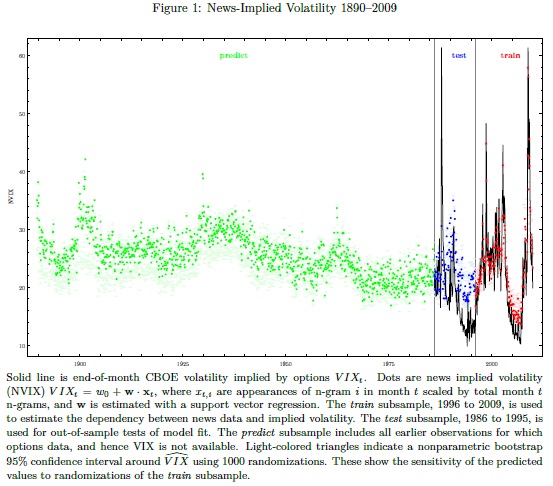
We estimate a news-based measure of uncertainty based on the co-movement between the front-page coverage of the Wall Street Journal and options-implied volatility (VIX). We call this measure News Implied Volatility, or NVIX for short. NVIX has two useful features that allow us to further our understanding of the relationship between uncertainty and expected returns:

(i) it has a long time-series, extending back to the last decade of the nineteen century, covering periods of large economic turmoil, wars, government policy changes, and crises of various sorts;

(ii) its variation is interpretable and provides insight into the origins of risk variation.

The first feature enables us to study how compensation for risks reflected in newspaper coverage has fluctuated over time, and the second feature allows us to identify which kinds of risk were important to investors.

We rely on machine learning techniques to uncover information from this rich and unique text dataset. Specifically, we estimate the relationship between option prices and the frequency of words using Support Vector Regression. The key advantage of this method over Ordinary Least Squares is its ability to deal with a large feature space. We find that NVIX predicts VIX well out-of-sample, with a root mean squared error of 7.48 percentage points (R2 = 0.19). When we replicate our methodology with realized volatility instead of VIX, we find that it works well even as we go decades back in time, suggesting newspaper word-choice is fairly stable over this period.

News Based VIX Index

We study whether fluctuations in NVIX encode information about equity risk premia. We begin by focusing on the post-war period commonly studied in the literature for which high-quality stock market data is available. We find strong evidence that times of greater investor uncertainty are followed by times of above average stock market returns. A one standard deviation increase in NVIX predicts annualized excess returns higher by 3.3 percentage points over the next year and 2.9 percentage points annually over the next two years.

Interpretability, a key feature of the text-based approach, enables us to investigate what type of news drive the ability of NVIX to predict returns. We decompose the text into five categories plausibly related (to a varying degree) to disaster concerns: war, financial intermediation, government policy, stock markets, and natural disasters. We find that a large part of the variation in risk premia is related to wars (53%) and government policy (27%). A substantial part of the time-series variation in risk premia NVIX identifies is driven by concerns tightly related to the type of events discussed in the rare disasters literature."


Are you looking for more strategies to read about? Check /Screener

Do you want to see a performance of trading systems we described? Check /Chart/Performance

Do you want to know more about us? Check /Home/About


Follow us on:

Facebook: https://www.facebook.com/quantpedia/

Twitter: https://twitter.com/quantpedia


Continue reading

An Analysis of PIMCO’s Bill Gross’ Alpha

4.May 2019

Bill Gross is probably the most known fixed income fund manager. A new academic paper sheds more light on his track record and sources of his stellar performance …

Authors: Dewey, Brown

Title: Bill Gross' Alpha: The King Versus the Oracle

Link: https://papers.ssrn.com/sol3/papers.cfm?abstract_id=3345604

Abstract:

We set out to investigate whether ''Bond King" Bill Gross demonstrated alpha (excess average return after adjusting for market exposures) over his career, in the spirit of earlier papers asking the same question of ''Oracle of Omaha," Warren Buffett. The journey turned out to be more interesting than the destination. We do find, contrary to previous research, that Gross demonstrated alpha at conventional levels of statistical significance. But we also find that result depends less on the historical record than on whether we take the perspective of academics interested in market efficiency, investors picking a fund or someone (say a potential employer) asking whether a manager has skill or is throwing darts to pick positions. These are often thought to be overlapping or even identical questions. That's not completely unreasonable in equity markets, but in fixed income these are distinct. We also find quantitative differences, mainly that fixed-income securities have much higher correlations with each other than equities, make alpha 4.5 times as hard to measure for Gross than Buffett. We don't think our results will have much practical effect on attitudes toward Gross as an investor, but we hope they will advance understanding of what alpha means and appropriate ways to estimate it.

Notable quotations from the academic research paper:

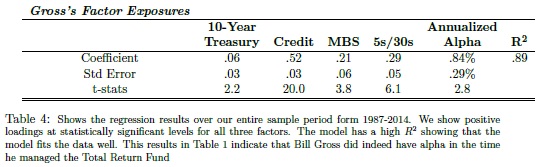
"Superstar bond portfolio manager Bill Gross announced his retirement last week. From 1987 to 2014, his PIMCO Total Return fund generated 1.33% per year of alpha versus the Barclays US Credit index, with a t-statistic of 3.76. For many years his fund was the largest bond fund in the world, and was generally considered to be the most successful. This track record inspired us to take a closer quantitative look along the lines of Frazzini, Kabiller and Pedersen's Buff ett's Alpha (FKP). Gross, like Bu ffett, often publicly discussed what he perceives as the drivers of his returns. At the Morningstar Conference in 2014 and in a 2005 paper titled "Consistent Alpha Generation Through Structure" Gross highlighted three factors behind his returns: more credit risk than his benchmark, more 5-year and less 30-year exposure, and long mortgages and other securities with negative convexity.

We present five main fi ndings:

1. We con firm that those three factors, plus one for the general level of interest rates, explain 89% of the variance in Gross' monthly return over the 27-year period. We further estimate that Gross outperformed a passive factor portfolio by 0.84% per year, which is signi ficant at the 5% level. Gross' compounded annual return over the period was 7.52%, versus 6.44% for the Barclay's Aggregate US Index. So we find that most of his 1.08% annual outperformance of the index was alpha.

Bill Gross' Alpha

2. The FKP paper mentioned above considered one of the best-known track records in the equity asset class, Warren Buff ett's. We compliment this work by examining one of the best-known track records in the fixed-income asset class. Fixed-income investing o ffers a di erent set of challenges and opportunities than equity. We o ffer a novel discussion on the concept of manager alpha including important qualitative and quantitative di fferences in the concept of alpha with Gross versus Bu ffett.

3. The main qualitative di fference is that Gross exploited well known sources of risk and potentially excess return in the fixed-income market, exposures that investors rationally demand additional yield to accept. Bu ffett's performance, for the most part, correlates with factors uncovered long after he began investing and were still not accepted as fully as factors like credit risk or mortgage prepayment risk. Moreover Buff ett's factors probably result from behavioral biases and institutional constraints rather than rational investor preferences.

4. The main statistical di fference is the much higher r2 value in Gross' regression versus Buff ett's (about 0.9 versus 0.3) makes the alpha signi ficance estimate 4.5 times as sensitive to the observed returns on the factor portfolios. Since it is nearly impossible to estimate expected returns – there is considerable debate about the level of the equity premium even with 150 years or more of data – this makes it important to select factors that conform as closely as possible to what Gross actually did, rather than factors that merely have a high return correlation to Gross' results. The closer the factors conform to Gross' practice, the better the chance that any deviations in factor performance from expectation over the period are reflected equally in both Gross' actual results and the factor portfolio results.

5. Gross earned essentially all of his alpha in favorable markets for his factors and had a signi ficantly negative timing ability in the sense that his factor exposures were greater in months the factor had negative returns than in months the factor had positive return. This latter feature could be unfortunate timing decisions or negative convexity in the factor exposures. We discuss whether this can shed light on the source of Gross' alpha, speci fically whether it relates to preferential access to new issues and leverage."


Are you looking for more strategies to read about? Check /Screener

Do you want to see performance of trading systems we described? Check /Chart/Performance

Do you want to know more about us? Check /Home/About


Follow us on:

Facebook: https://www.facebook.com/quantpedia/

Twitter: https://twitter.com/quantpedia


Continue reading

Case Study: Quantpedia’s Composite Seasonal / Calendar Strategy

26.April 2019

Despite the fact that the economic theory states that financial markets are efficient and investors are rational, a large amount of research is about anomalies, where the result is different from the theoretical expectation. At Quantpedia, we deal with anomalies in the financial markets and we have identified more than 500 attractive trading systems together with hundreds of related academic papers.

This article should be a case study of some strategies that are listed in our Screener, with an aim to present a possible usage of strategies in our database. Moreover, we have extended the backtesting period and we show that the strategies are still working and have not diminished. This blog also should serve as a case study how to use the Quantpedia’s database itself; therefore the choice of strategies was not obviously random and strategies were filtered by given criteria, however, every strategy is listed in the “free“ section, and therefore no subscription is needed.

Continue reading
Subscription Form

Subscribe for Newsletter

 Be first to know, when we publish new content
logo

Log in