Cross-Asset Price-Based Regimes for Gold
Introduction
This article develops a price-based macro–financial model of gold that formally links its medium-horizon return dynamics to cross-asset risk-premium configurations. Although gold has traditionally been conceptualized as a non-yielding inflation hedge or safe-haven asset, contemporary empirical evidence reveals a substantially more intricate structure: gold’s forward returns are systematically conditioned by the joint momentum of (i) gold itself and (ii) long-duration U.S. Treasury total-return indices. The alignment of these two signals appears to encode macroeconomic information—specifically the direction of real interest rates, the stance and expected trajectory of Federal Reserve policy, and the prevailing global risk-appetite regime.
Motivated by these findings, this study constructs a unified framework in which the joint gold–Treasury momentum state serves as a compact and economically interpretable indicator of the underlying macro regime. When past momentum in both gold and Treasuries is positive, the environment is dominated by falling real yields, rising recession risk, and de facto or anticipated monetary easing—a configuration historically associated with persistently positive gold excess returns. Conversely, when both signals are negative, the inferred macro regime shifts to one characterized by rising real yields, tightening financial conditions, and a rotation into pro-cyclical assets, producing a structurally adverse environment for gold. By formalizing this mechanism, the article aims to provide a theoretically coherent and empirically robust account of gold’s return-generation process, reconciling disparate strands of the literature on real rates, safe-haven demand, and multi-asset risk-premium cycles.
Background
A substantial literature documents that gold prices are deeply anchored to the level and trajectory of real interest rates, reflecting the intertemporal opportunity cost of holding an asset with no intrinsic yield. The negative relationship between gold and real yields—empirically documented by Erb and Harvey (2013), Baur and Lucey (2010), and further corroborated in a range of inflation-hedging studies—forms the foundational economic premise of modern gold valuation. Periods of falling real yields, typically associated with dovish monetary regimes or deteriorating growth expectations, produce systematic tailwinds for gold; rising real yields generate the opposite effect.
Momentum in long-duration Treasuries provides a natural and empirically validated proxy for these real-rate dynamics. Positive Treasury momentum corresponds to declining yields (i.e., rising bond prices) and generally signals accommodative macro conditions, increased growth uncertainty, or outright easing. Conversely, negative Treasury momentum captures tightening cycles, repricing of duration risk, and rising expectations of future growth or policy normalization. This view is consistent with the macro-financial interpretation of bond momentum advanced by Koijen, Moskowitz, Pedersen, and Vrugt (2018), as well as the broader cross-asset momentum literature (Moskowitz, Ooi, and Pedersen 2012), which emphasizes the role of slow-moving macroeconomic drift in generating persistent return continuation across asset classes.
Motivation
The novel empirical observation motivating this article is that the interaction—not merely the independent effects—of gold momentum and Treasury momentum forms a state variable with substantial explanatory and predictive power for future gold performance. When both gold and Treasuries exhibit positive medium-horizon momentum, the joint signal identifies a “falling real-rate regime,” consistent with heightened demand for safe assets, elevated recession probability, and an easing-dominant monetary environment. In contrast, when both exhibit negative momentum, the configuration corresponds to a “rising real-rate regime,” frequently associated with accelerated growth expectations, policy tightening, and a systematic rotation toward high-beta, carry-rich, and cyclical assets.
This adverse regime—simultaneous negative momentum in gold and long-duration Treasuries—is empirically characterized by strong performance of pro-cyclical asset classes such as broad equities, industrial commodities, value and financial sectors, and high-yield credit, while duration-sensitive safe-haven assets contract. This phenomenon fits squarely within the macro-asset-pricing literature, which documents that rising real yields, improving growth conditions, and tightened financial conditions jointly favor short-duration, growth-sensitive assets (see Cochrane 2011; Adrian, Crump, and Moench 2015). The joint gold–Treasury factor thus operates as a compact, economically interpretable macro-regime classifier that distinguishes between easing-dominant, risk-off episodes and tightening-dominant, risk-on episodes.
By explicitly situating gold within these macro-financial cycles and formalizing the mechanism through which cross-asset momentum reveals latent real-rate regimes, this article contributes a theoretically grounded and quantitatively validated model of gold price dynamics—one that unifies safe-haven demand, opportunity-cost channels, and cross-asset risk sentiment into a single, coherent framework.
Methods
Data
The empirical analysis draws on a long-horizon dataset constructed to isolate the dynamic interaction between gold returns and the intermediate- to long-duration performance of U.S. Treasuries. The investable asset under consideration is GLD (SPDR Gold Trust), which serves as the operational proxy for physical gold exposure. Although portfolio allocations are restricted exclusively to GLD, the model incorporates the return history of IEF (iShares 7–10 Year Treasury Bond ETF) as an informational variable used to characterize macro-financial regimes and to construct the joint momentum state central to the empirical framework. ETF data were pulled from EODHD.com – the sponsor of our blog. EODHD offers seamless access to +30 years of historical prices and fundamental data for stocks, ETFs, forex, and cryptocurrencies across 60+ exchanges, available via API or no-code add-ons for Excel and Google Sheets. As a special offer, our blog readers can enjoy an exclusive 30% discount on premium EODHD plans.
To ensure continuity across monetary cycles and to avoid the well-documented biases associated with short-sample analyses, the study employs an extended historical dataset spanning 31 December 1969 through 30 September 2025. Because GLD and IEF themselves do not exist across this whole horizon, the early portion of the sample relies on an internally maintained historical reconstruction of gold spot prices and U.S. Treasury total-return indices, engineered to be methodologically consistent with the modern ETF instruments and sourced from our internal database for bond and gold prices.
In the final, for cash, we incorporate the Federal Funds Effective Rate (FEDFUNDS) from the Federal Reserve Economic Data (FRED) repository. The FEDFUNDS series provides the canonical short-term policy/cash-rate benchmark used to construct cash returns, to form cash-adjusted excess-return series, and to finally amend the model’s mapping between monetary-policy stance and inferred real-rate regimes.
Methodology
All return series are computed on a total-return basis, adjusted for roll mechanics where applicable, and sampled monthly to align with the medium-horizon predictive structure motivating the study. Momentum factors are calculated using overlapping backward-looking windows of 1, 3, 6, and 12 months, consistent with the cross-asset momentum literature and with the empirical model developed herein.
Benchmark
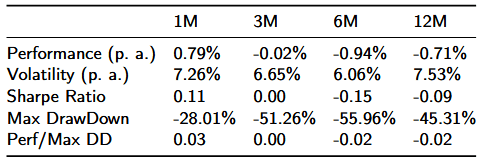
The buy‑and‑hold allocation to GLD (GLD B&H) is adopted as the definitive baseline against which all dynamic and regime‑conditional strategies are evaluated. The following figure and table report the core ex‑post metrics used throughout the paper (annualized performance, annualized volatility, Sharpe ratio, maximum drawdown, and the performance‑to‑max‑drawdown ratio), which together define the empirical target that proposed momentum‑ or macro‑conditioned strategy should outperform to be considered economically meaningful.
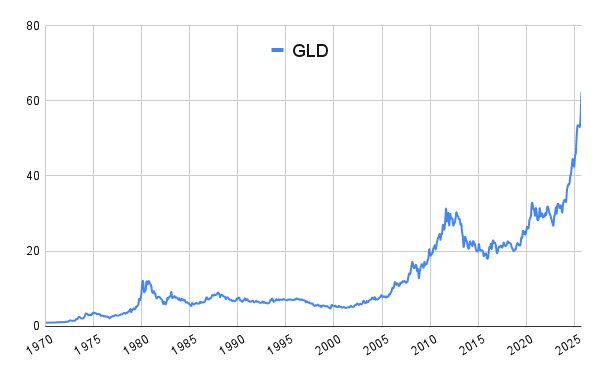
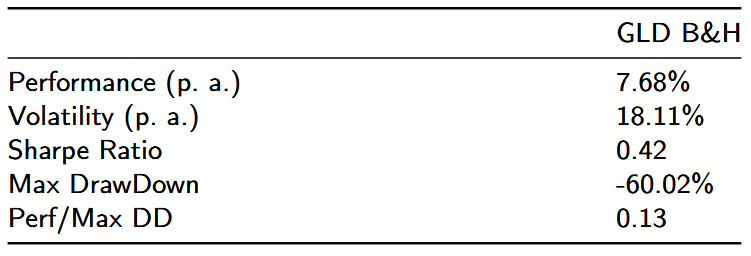
Over the back‑test horizon, the GLD buy‑and‑hold indicates that, while GLD delivers positive long‑run nominal returns, it does so with substantial realized volatility and episodic, deep capital losses that materially depress risk‑adjusted outcomes.
Consequently, the empirical objective for the model and subsequent trading rules is twofold: (i) to preserve or modestly improve long‑run nominal returns while (ii) materially reducing realized drawdowns and increasing the Sharpe ratio.
Results
This section presents empirical results evaluating whether information from other asset classes, specifically long-duration U.S. Treasury total-return indices, provides incremental predictive power for future gold returns beyond that embedded in gold’s own past performance. Our objective is to assess whether a multi-asset momentum specification—gold momentum augmented with Treasury momentum—improves the out-of-sample performance of trading strategies. We systematically examine forecast horizons of 1, 3, 6, and 12 months using standardized momentum signals and evaluate long-only timing strategies for the GLD ETF.
Across all exercises, results are presented using the following elements for each horizon:
(i) equity curves for four individual momentum models and their cross-model average;
(ii) performance evaluation tables reporting CAGR, annualized volatility, maximum drawdown, Sharpe ratio, and Calmar ratio.
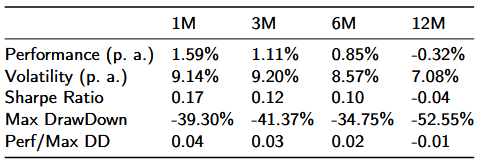
1. Baseline: Gold Momentum as a Predictor of Future Gold Returns
We first consider the canonical specification in which the predictor variable is the past performance of gold itself. For each horizon (1M, 3M, 6M, 12M), we compute a simple long-only timing rule:
Long GLD when past gold performance over the given horizon is positive,
flat (0% allocation) when the signal is negative.
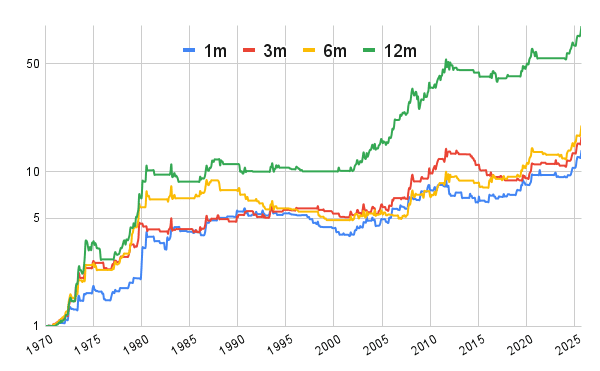
The resulting four equity curves, along with their simple average, are displayed in Figure 1 (we use a log scale to better depict appreciation over time). Performance statistics are summarized in Table 1.
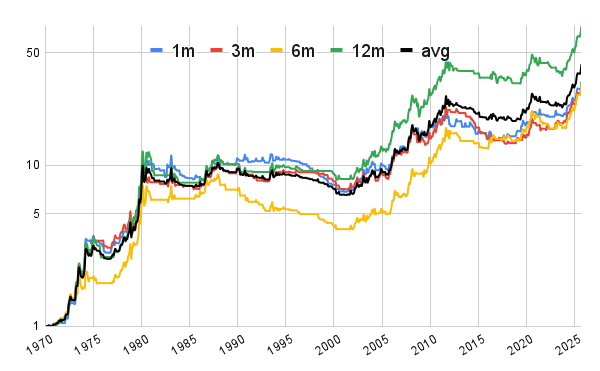
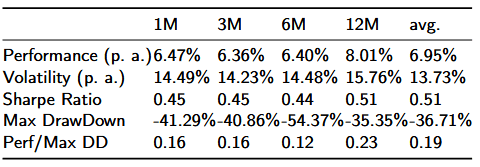
Consistent with the existing literature on time-series momentum (Moskowitz, Ooi, and Pedersen 2012), we observe that positive gold momentum is in itself sufficiently predictive of favorable subsequent returns. All four horizons and composite average produce statistically significant Sharpe and Calmar ratios.
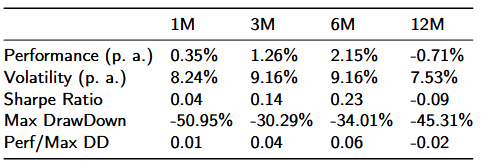
Opposite-Signal Specification
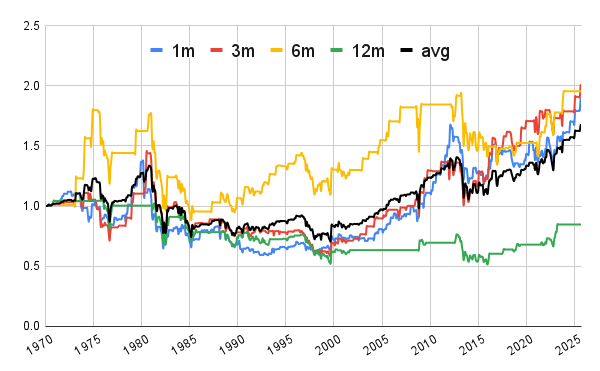
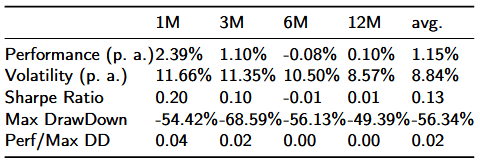
We next evaluate the contrarian rule—long GLD when gold momentum is negative and flat otherwise. Figure 2 and Table 2 report the results.
Across all horizons, this specification performs substantially worse, sometimes with negative risk-adjusted returns and pronounced drawdowns. This confirms that the negative-momentum gold regime is particularly unfavorable, and that gold’s own past underperformance conveys meaningful information about persistent macro headwinds.
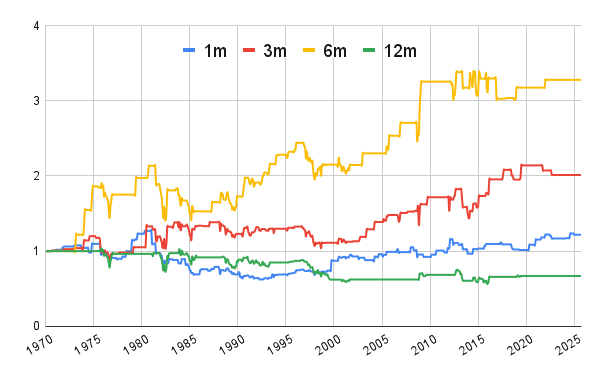
2. Treasury Momentum (IEF) as a Predictor of Gold Returns
We then replace gold momentum with the past performance of the 7–10 year U.S. Treasury total-return index (IEF) as the predictive signal for GLD. The trading rule is analogously defined:
Long GLD when past IEF performance is positive,
flat otherwise.
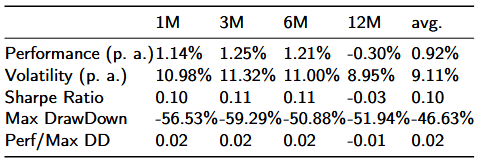
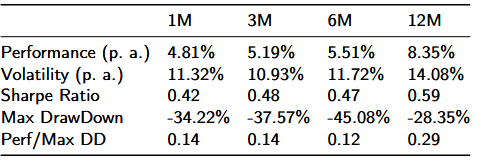
The four equity curves (1M, 3M, 6M, 12M) and their average are shown in Figure 3 (we again use a log scale); Table 3 reports performance statistics.
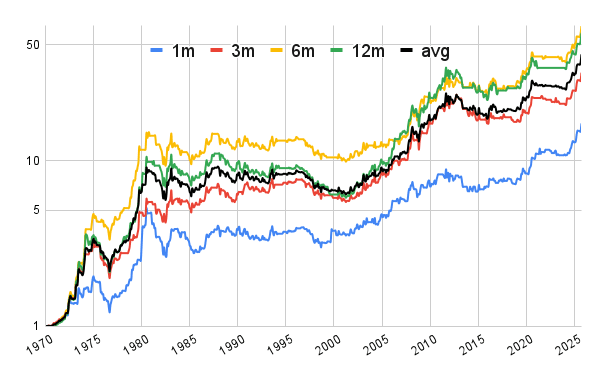
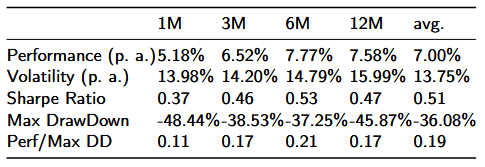
Surprisingly—and counterintuitively from a purely macroeconomic-centric perspective—positive Treasury momentum predicts positive gold returns. Across all horizons, the IEF-based models deliver Sharpe and Calmar ratios that are very similar to those of the baseline gold-momentum models. This finding is economically consistent with the hypothesis that falling yields and accommodative monetary conditions jointly drive positive gold performance, and that Treasury momentum serves as an effective proxy for the real rate.
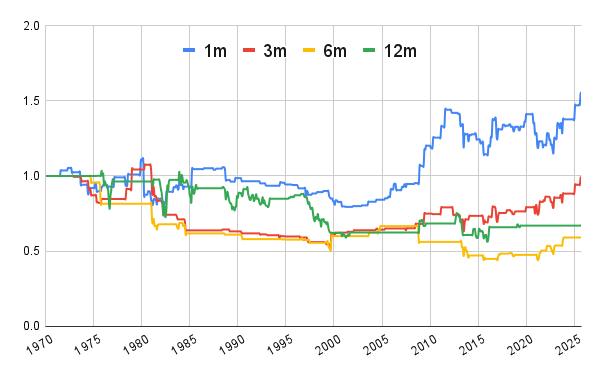
Opposite-Signal Specification (IEF Negative Momentum)
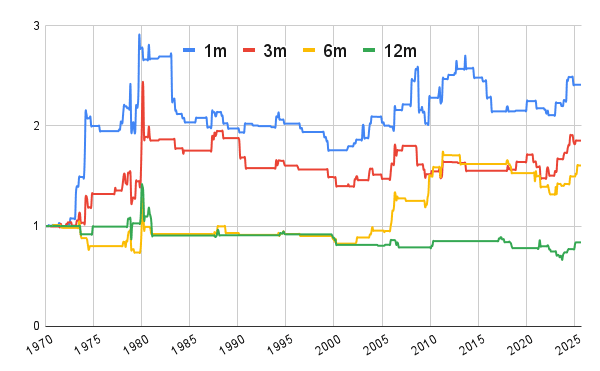
We repeat the exercise using the contrarian rule—long GLD when IEF momentum is negative. Figure 4 and Table 4 present the results.
Mirroring gold’s own negative momentum regime, negative Treasury momentum is associated with poor forward gold performance, with returns across all horizons low and risk-adjusted metrics inferior. This reinforces the interpretation that an environment of rising yields and tightening macro conditions is systematically adverse for gold.

3. Joint Momentum States: Combining GLD and IEF Predictors
To evaluate the combined information content of gold and Treasury momentum, we classify each month into one of four joint macro-states:
GLD positive, IEF positive
GLD positive, IEF negative
GLD negative, IEF positive
GLD negative, IEF negative
For each of the four forecasting horizons (1M, 3M, 6M, 12M), we compute equity curves and performance tables under each state-conditioned trading rule.
State 1: Gold ↑ and Treasuries ↑ (Aligned Positive Momentum)
Figure 5 (again on a log scale) and Table 5 show that this regime achieves the strongest performance across the most extended horizon (12M) of all versions and variants presented so far. Both Sharpe and Calmar ratios sufficiently exceed those obtained from models relying solely on gold or bond momentum. Notably, these results are achieved even without holding cash during ineligible periods (i.e., the strategy remains fully invested only when the joint signal is positive and earns no yield or interest otherwise), underscoring the robustness of this combined predictor.
States 2–4: All Other Combinations
In contrast, the remaining three regimes—
2. GLD positive, IEF negative
3. GLD negative, IEF positive
4. GLD negative, IEF negative
—produce far inferior performance. Figures 6–8 and Tables 6–8 consistently demonstrate weak or negative Sharpe ratios, poor cumulative returns, and elevated drawdowns.
These findings imply that only the jointly positive state contains reliable predictive content, whereas all other states reflect macro environments unfavorable to tactical gold exposure. In particular:
State 4 (GLD negative & IEF negative) consistently exhibits the worst forward performance, aligning with an interpretation of rising real yields and pro-cyclical macro conditions.
States 2 and 3 offer no incremental value and largely reflect transitional macro phases with a limited directional signal for gold.
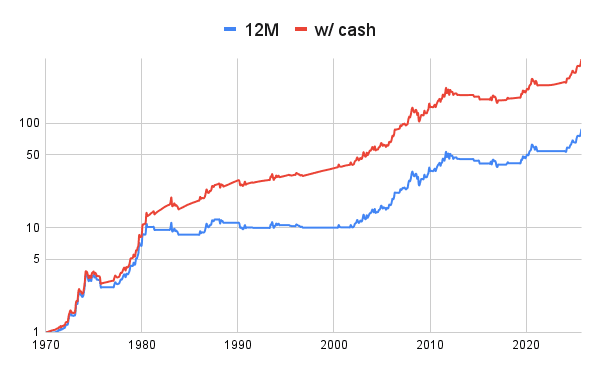
Annual Joint-Momentum Allocation Rule: The 12-Month Gold–Treasury Regime Filter
A refined annual (12-month) advanced momentum strategy is constructed by conditioning gold exposure on the joint 12-month momentum state of both GLD and IEF, selecting exclusively the State 1 configuration—Gold ↑ and Treasuries ↑—which empirically dominates all other variants in Sharpe ratio, Calmar ratio, and cumulative return growth. The trading rule is defined as follows: at each monthly rebalancing date, compute the trailing 12-month total return of GLD and the trailing 12-month total return of IEF; if and only if both returns are strictly positive, the strategy maintains a 100% long allocation to GLD; if either return is non-positive, the strategy allocates 0% to GLD, or may hold cash position earning United States Fed Funds Interest Rate, as the absolute, final amended version.
This specification isolates the macro regime characterized by falling real yields and easing financial conditions, which the empirical analysis identifies as the state with positive forward gold returns. Consequently, the 12M joint-momentum State 1 rule represents the most potent version of the model, outperforming all single-signal and all alternative state-conditioned strategies.
The empirical evidence demonstrates that a joint gold–Treasury momentum specification materially improves the information set for timing tactical gold exposure relative to single‑signal rules. Across 1, 3, 6, and 12‑month horizons, the only consistently robust predictive configuration is the aligned positive state (GLD↑ & IEF↑), which identifies a falling real‑yield / easing macro regime that persistently precedes favorable gold excess returns. All alternative joint states (GLD+/IEF−, GLD−/IEF+, GLD−/IEF−) produce weak or adverse risk‑adjusted outcomes, with the GLD−/IEF− state exhibiting the most adverse forward performance; this asymmetry supports the interpretation that the interaction of duration and gold momentum encodes latent real‑rate and risk‑appetite information that single‑asset momentum cannot fully capture.
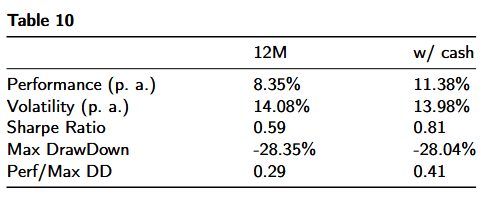
Quantitatively, the annualized back‑test metrics for the 12‑month joint‑momentum rule substantiate both improved returns and materially better risk‑adjusted outcomes when cash is explicitly incorporated. The pure 12M regime filter, augmenting the rule with a cash allocation (proxied by the Federal Funds rate), raises the annualized return, slightly lowers volatility, increases the Sharpe ratio, and leaves the drawdown meaningfully unchanged, improving the performance-to-drawdown metric. The improvement with cash is economically intuitive: holding a short‑term cash sleeve during out‑of‑regime months captures policy‑rate carry, reduces opportunity cost of being flat, and amplifies the information value of the regime filter without materially increasing tail risk.
Discussion & Conclusion
The evidence strongly supports the conclusion that gold’s return-generating process is inherently macro-financial, and that incorporating cross-asset momentum—especially from long-duration Treasuries—enhances predictive accuracy by capturing the low-frequency dynamics of real rates and monetary policy regimes.
From a portfolio‑construction and asset‑pricing perspective, these results have three immediate implications. First, the joint momentum factor serves as a compact, investable regime classifier that maps directly to real‑rate and monetary‑policy states, making it useful for both tactical allocation and structural models of gold premia. Second, the strategy is implementable with liquid proxies (GLD, IEF, and a Fed‑funds cash sleeve) and monthly rebalancing, but practical deployment requires careful adjustment for transaction costs, ETF fees, and realistic execution slippage; robustness checks (bootstrap inference, walk‑forward validation, and sensitivity to momentum lookback) are therefore essential before capital allocation. Third, the findings invite formal extensions—explicit modeling of expected real rates, incorporation of inflation surprises and cross‑asset carry, and integration into multi‑asset portfolio optimization—to quantify how the gold–Treasury regime signal interacts with broader risk‑premium cycles and to establish economic significance under alternative macro scenarios.
Author: Cyril Dujava, Quant Analyst, Quantpedia
Are you looking for more strategies to read about? Sign up for our newsletter or visit our Blog or Screener.
Do you want to learn more about Quantpedia Premium service? Check how Quantpedia works, our mission and Premium pricing offer.
Do you want to learn more about Quantpedia Pro service? Check its description, watch videos, review reporting capabilities and visit our pricing offer.
Do you want algorithmic access to the full Quantpedia database via the API? Subscribe to Quantpedia Pro, ask for an API key, and explore the in/out-of-sample statistics, source academic papers, and code snippets — ideal for quantitative research, systematic trading workflows, and AI model training.
Are you looking for historical data or backtesting platforms? Check our list of Algo Trading Discounts.
Or follow us on:
Facebook Group, Facebook Page, Telegram, Twitter, Linkedin, Medium or Youtube
Share onLinkedInTwitterFacebookRefer to a friend


