Defining Market Cycles Out of Sample
We have already published a few articles about how the different market cycles affect the performance of your portfolio and performance of market factors. So far, these states of the market were identified in-sample, with the benefit of hindsight. The full methodology of how we defined bull/ bear market, low/ high inflation, and rising/ falling interest rates is described in this article.
Today, we are going to define the same market states out-of-sample. We will describe our methodology and the thinking behind it all in this article. Both in sample and out of sample market cycle analysis may be useful for making investment decisions. It’s crucial to understand the differences and how to use this kind of analysis to your benefit.
In Sample vs. Out of Sample
When analyzing market cycles, one may use countless different methodologies. Both approaches we use – in sample and out of sample – have their own advantages and disadvantages. So, let’s talk them through.
In Sample
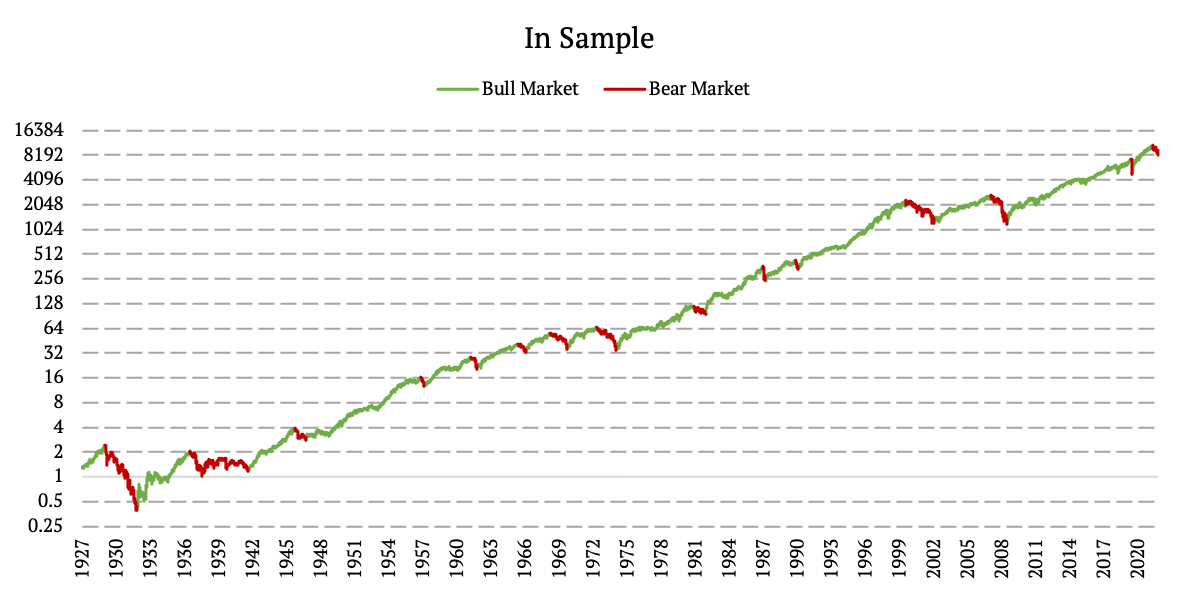
In 100 Years of Historical Market Cycles, we opted for an in-sample analysis. I.e., by means of hindsight, we back-identify different market cycles. The main advantage of this approach is that by knowing the past, we can exactly mark the start and the end of each market cycle. Hence, the market cycles are defined very precisely this way, without any lag or false signals.
We may precisely mark when the bull market changed into a bear market, when the rising rates began to fall, or when the inflation crossed the breakpoint from low to high and vice versa.
In Sample analysis is primarily being used by anyone who has a specific view on current market cycle. Let’s say I don’t care about any models and I have a firm view that we are heading into a period of falling rates and also falling equity markets. That’s my view I believe will materialize soon. I don’t know when, but I believe it will happen. Thus, now I need to know which assets will perform best in this environment, right? This is exactly what In Sample analysis shows.
Out of Sample
While it’s easier to identify a bull market or a high inflation in the past, this task becomes exponentially harder going forward. Are we already in a period of rising interest rates? Are we already in a bear market? Or are we already back in the bull market? An attempt to answer the question “What market cycle are we in right now?” is called an Out of Sample analysis.
When we analyze the data out-of-sample (without knowing what is about to come), we can however still use certain criteria to define individual market states and apply them to current data, thus identifying today’s market states. On the flip side, using the out-of-sample methodology means we lose the precise knowledge of the market cycle, creating a lagged reaction to the change from one state to another.
Out of Sample analysis is the most common and most widely used type of analysis. It’s meant for anyone who does not have any view on current market cycle. It’s also the hardest one to perform correctly and accurately. Let’s say I don’t think anything about the markets or inflation, but I would like to know which assets are prone to perform better in the upcoming months or years. Well, either I have a crystal ball, or I can create a simple model for an Out of Sample analysis of market cycles. We’ve chosen the second option.
Growth, Rates and Inflation
Firstly, we gathered 100 years of daily historical data on stocks, inflation, and rates. This is the key starting point of our analysis to identify the following market states:
- Bull and Bear markets – based on stock markets
- Rising and Falling interest rates – based on short rates and short-term yields
- High and Low inflation – simply based on inflation
We then identify the periods of bear vs. bull market, high vs. low inflation, and falling vs. growing interest rates over the last 100 years out-of-sample according to the methodology outlined below.
Defining Market States Out of Sample
Stock Market
Let’s start with identifying the bull vs. bear market. Data-wise, we combined Fama & French market factor (1926 – 1993) from Fama & French data library and SPY (SPDR S&P 500 ETF Trust) ETF’s daily returns (1993 – 2022) to obtain daily market data over the period 1926-2022.
To define the stock market cycles, in this article, we opted for the simplest definition possible. If the market is above the 252-day moving average, we are in a bull market. On the other hand, if the market is below the MA, we are in a bear market. Also, we applied a 2-day lag to make the calculations realistic.
Just to remind you how we defined bull and bear market in our in-sample analysis:
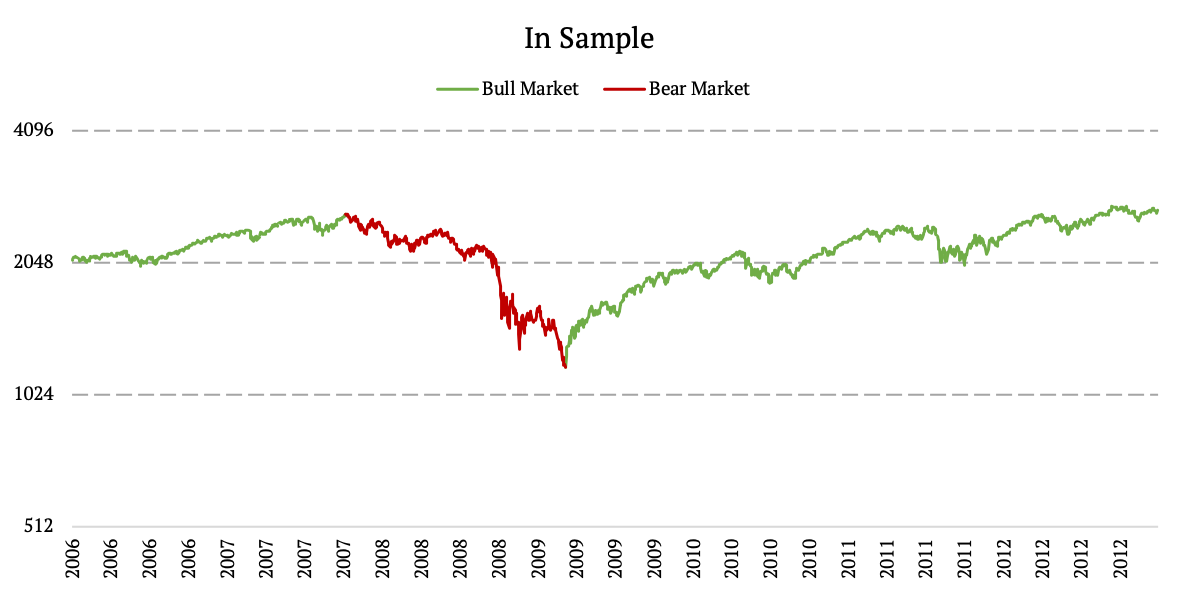
- Bear market: at least a 20% decline from the price high (drawdown); we measure a bear market from the high until the bottom
- Bull market: the period beginning at the bottom (after the bear market) and ending at the high (right before the next bear market)
The following figures show the difference between the in-sample and out-of-sample approaches.
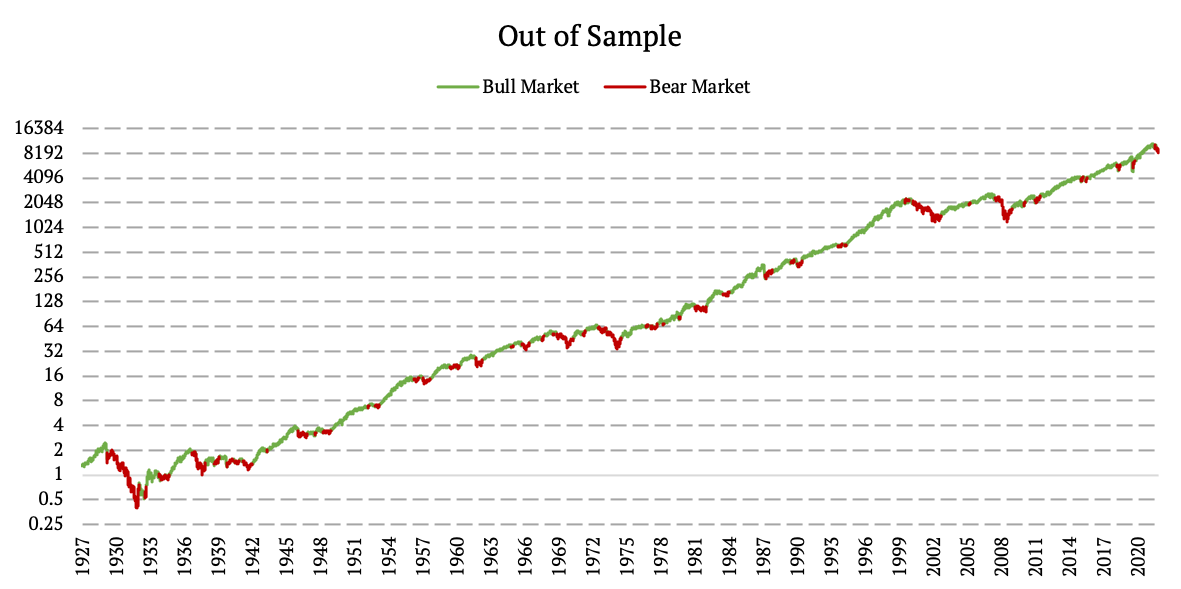
By construction, an In-Sample approach is always right and and Out of Sample approach gives us false signals from time to time. This results into bigger number of bull and bear markets for OOS approach, with some of them not being assessed correctly. However, this process is replicable and applicable in real time going forward without any crystal ball.
To highlight differences between IS and OOS, we present a zoomed-in chart from 2006 to 2012 to compare both approaches.
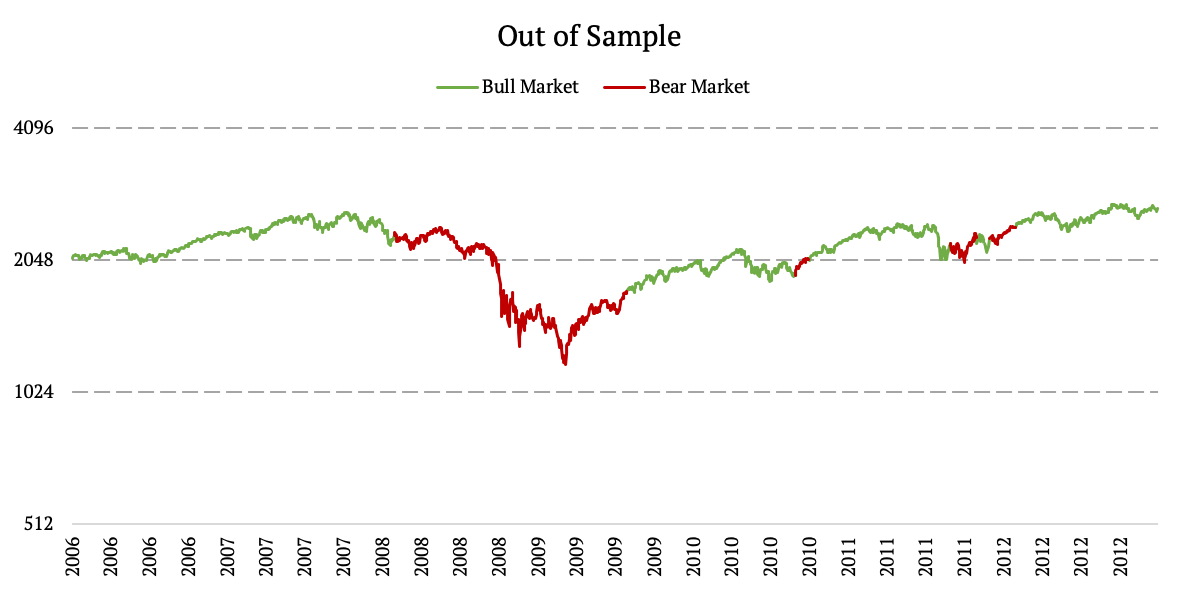
Is there a better methodology to define the Bull and Bear market out-of-sample than simple MA? Yes, there is. But we will get to it in a later article, right we just want to show the differences between in- and out-of-sample analyzes.
Inflation
Secondly, let’s look at inflation. We analyzed Consumer Price Index (CPI) to identify periods of high and low inflation. How do we define low and high inflation in the out-of-sample analysis? Firstly, we calculate a median CPI value with expanding window starting at 252-days. Every time the CPI was below the median value (known at that particular time only), we defined it as a low inflation. And every time the CPI was above the median value, we defined it as a high inflation. Again, we used a 2-day lag to make the calculations realistic.
A similar approach was taken in our in-sample analysis. In that case, we calculated the median CPI value over the entire period 1926-2022 (with hindsight) and marked the periods during which the CPI was higher than this median as periods with high inflation. On the other hand, the periods during which the CPI was below the median were marked as low inflation periods.
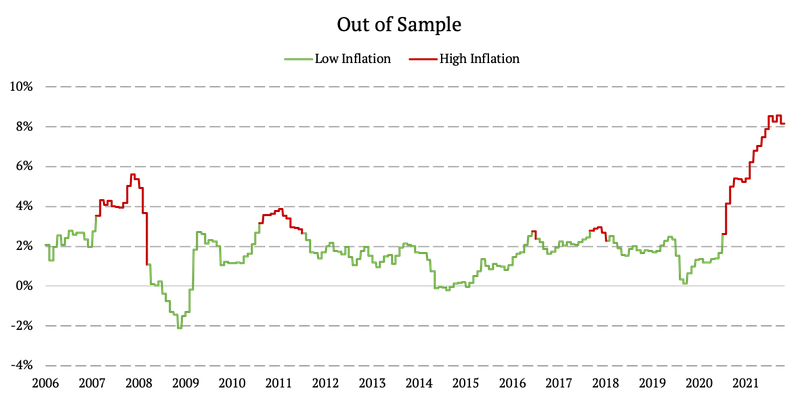
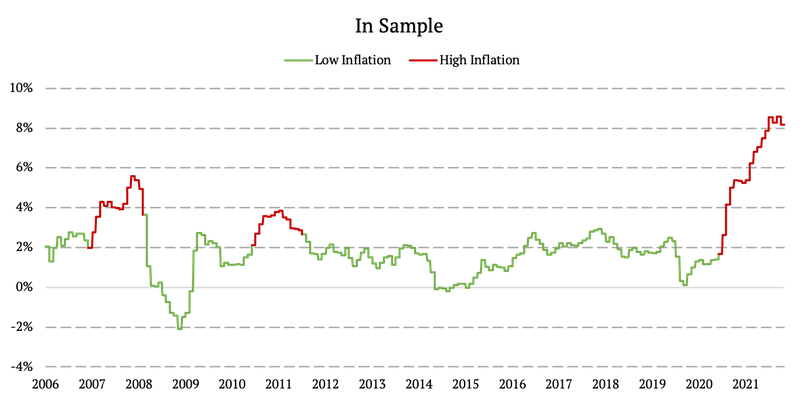
The following figures show the difference between the in-sample and out-of-sample approaches.
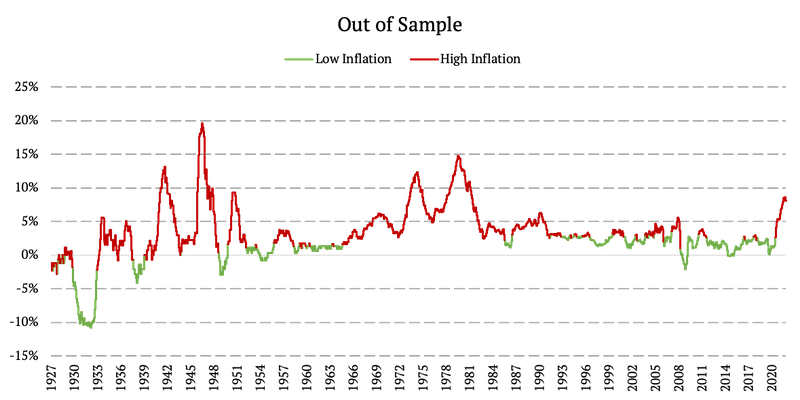
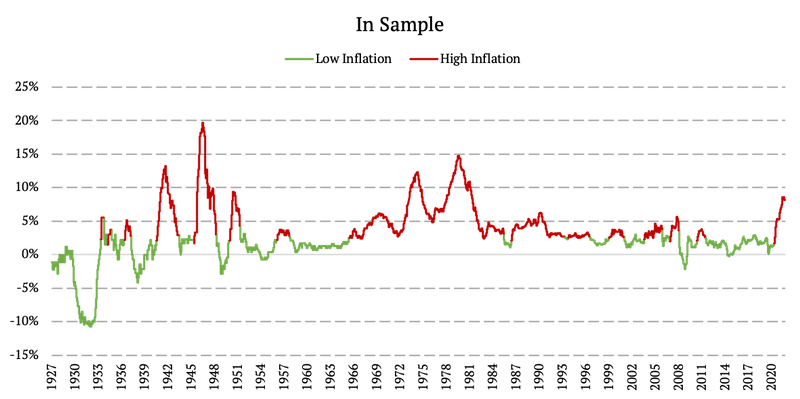
As expected, the differences are most pronounced in the earlier periods, when the expanding window isn’t long enough yet. The closer we move to the current date, the smaller the differences. We again present a zoomed-in chart, this time from 2006 to 2022 to depict the slight discrepancies between the out-of-sample and in-sample approaches.
Interest Rates
Lastly, we examined the development and market states of short-term interest rates. We combined multiple data sources to obtain the 100-year history of short rates. All the data sources are listed in the previous article.
To identify the rising/ falling rates states Out of Sample, we simply look at the last rate decision/movement. This movement then defines what rate cycle are we currently in. If the last rate movement was a rise, we define rate cycle right after that movement as a rising rates cycle. If the rate movement was a fall, we define state as falling rate state. Additionally, if rates remain the same from one day to the next, we stay in the same state/cycle as yesterday. And again, we apply the 2-day implementation lag.
To remind you, in our in-sample analysis, we used the following rules:
- Rising rates: begin immediately after the FED raises rates for the first time or (before the FED was setting rates) when there’s at least a 0.5% rise in short rates; this period has to last at least 3 months
- Falling rates: begin immediately after the FED lowers rates for the first time or (before the FED was setting rates) when there’s at least a 0.5% decline in short rates; this period has to last at least 3 months
The following figures show the difference between our in-sample and out-of-sample approaches.
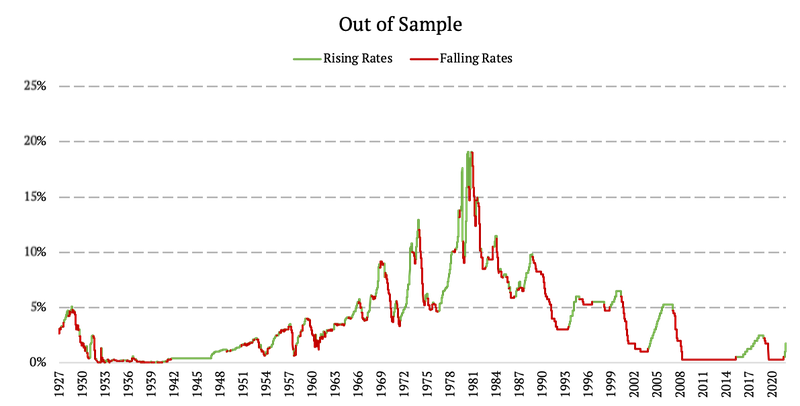
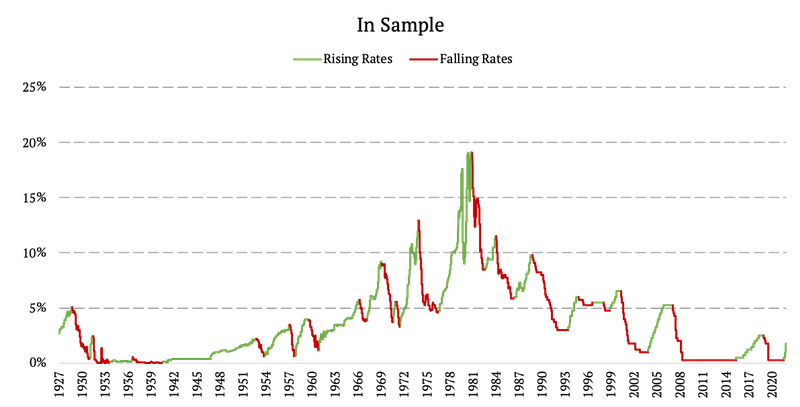
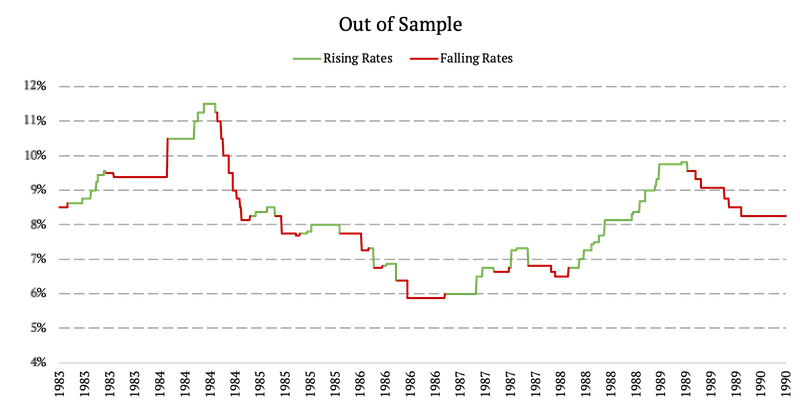
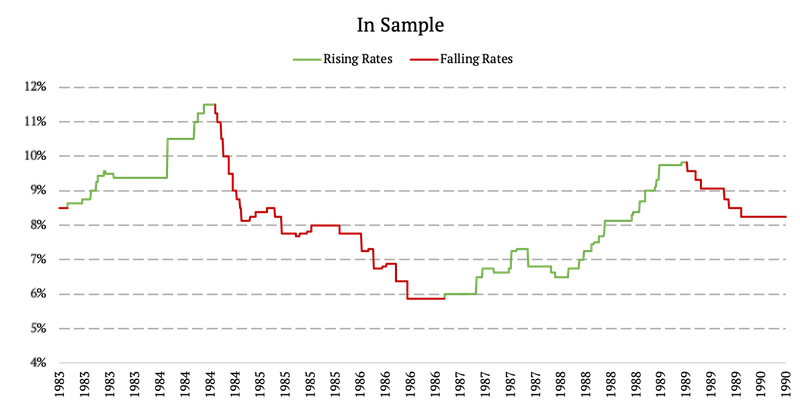
This time the results are pretty similar. The main difference is a methodological one – In Sample we require a state to last at least 3 months, whereas Out of Sample we act immediately. Additionally, we present a zoomed-in chart from 1983 to 1990 to highlight the difference between our out-of-sample and in-sample approaches.
Author:
Daniela Hanicova, Quant Analyst, Quantpedia
Are you looking for more strategies to read about? Sign up for our newsletter or visit our Blog or Screener.
Do you want to learn more about Quantpedia Premium service? Check how Quantpedia works, our mission and Premium pricing offer.
Do you want to learn more about Quantpedia Pro service? Check its description, watch videos, review reporting capabilities and visit our pricing offer.
Do you want algorithmic access to the full Quantpedia database via the API? Subscribe to Quantpedia Pro, ask for an API key, and explore the in/out-of-sample statistics, source academic papers, and code snippets — ideal for quantitative research, systematic trading workflows, and AI model training.
Are you looking for historical data or backtesting platforms? Check our list of Algo Trading Discounts.
Or follow us on:
Facebook Group, Facebook Page, Telegram, Twitter, Linkedin, Medium or Youtube
Share onLinkedInTwitterFacebookRefer to a friend


