Evaluating Factor Models in China
Today, we will evaluate some specifics that are akin to the now second largest market in the world – China. As a leading part of emerging markets, Chine is seen to grow in quite fast pace. With growth and new adaptation surely comes challenges and for some principles that are widely known in western markets, there are specific applications in China. Let’s have closer look and examine one of them.
Chinese markets have long history of very strict regulatory rules that are specifically problematic for companies that want to go public through initial public offering (IPOs). Recent years’ intervention of politic figures made some changes that lessen some of barrages into becoming publicly traded company and IPOs became more accessible. However, there are still other ways to enter the market legally and faster – “shell companies”. However, the abundance of these stocks creates a problem when researchers try to uncover sources of alpha in the Chinese market.
Widely accepted, for example, CAPM and Fama–French 3–factor models which works satisfactory with developed markets shows lower predictive power in China. As result of past research, it was found that eliminating the smallest 30% of stocks from calculations increases its accuracy. Those firms, often, is argued, are used as “shells”, allowing private firms to enter the stock exchanges while bypassing an IPO. One of most common application is reverse mergers (RMs), where private firm targets a publicly listed firm (i.e., the shell) by obtaining its shares. This is widely accepted in academia. With mentioning policy reforms in markets, number of IPOs increased, where RMs decreased. Does this have any implications for the previous statement; and if, are there any other better models to take this finding into account? Recent research of Zhiyong Li and Xiao Rao (2022) challenges old finding and proposes new, revisited model to more accurately predict returns with eliminating unnecessary noise.
Paper proposes alternative filter, which excludes the stocks with a high estimated shell probability when constructing factor models. Proposed model reconstructed 25 Fama–French portfolios based on the size and EP double-sorting. These results along with robustness tests confirm that proposed approach is better than simply dropping bottom 30% of stocks because significant part of them is not to be considered as “shells” anymore. Additionally, also authors provide appealing arguments for case that trading-related anomalies are likely driven by the high presence of retail investors, and are more critical in the Chinese market than in the US market. Proposed changes to models are very useful for portfolio managers to revisit their ways in analyzing Chinese markets.
Authors: Zhiyong Li and Xiao Rao
Title: Evaluating Asset Pricing Models: A Revised Factor Model for China
Link: https://papers.ssrn.com/sol3/papers.cfm?abstract_id=3950453
Abstract:
We develop a revised factor model, accounting for unique features of Chinese markets, and evaluate the performance of competing asset pricing models. Extant literature reveals that eliminating the smallest 30% of stocks improves the performance of factor models. The revised factor model excludes firms with a high expected probability of becoming shells, which are companies valued as shells in reverse mergers serving as an alternative way to go public. Our revised model has the smallest model specification errors and the best explaining power among various test assets. This new finding suggests that our model offers an effective benchmark model for empirical asset pricing in the Chinese stock market.
As always we present several interesting tables:
Notable quotations from the academic research paper:
“However, unlike in developed markets, these empirical asset pricing factor models are less effective in the Chinese stock market. For instance, Hu et al. (2019) find no value premium on the Chinese market when replicating Fama and French’s (1993) 3-factor model. They attribute this phenomenon to extreme values in the early years of the market. Liu, Stambaugh, and Yuan (2019; LSY hereafter) argue that small firms at the bottom 30% size quantile act as “shells”, allowing private firms to enter the stock exchanges while bypassing an IPO. According to LSY, the market value of these small firms is largely irrelevant to the company’s fundamentals. To avoid the shell value contamination, LSY eliminate the smallest 30% of stocks and construct risk factors that can effectively capture the cross-sectional variation of other “regular” stocks that account for approximately 93% of the total Chinese A-share market capitalization.
Our study contributes to the literature on asset pricing in Chinese equity markets in the following three points. First, we emphasize the limitation of the CH-3 factor model (proposed by LSY) in light of the presence of a structural break in the Chinese IPO market induced by the policy and regulation changes after 2017. Removing the bottom 30% of stocks may result in a systematically overestimated alpha when evaluating the portfolio performance. We circumvent these issues by proposing and implementing an improved asset pricing model that includes the bottom 30% of stocks contingent on the activity of reverse merges in constructing factor models.
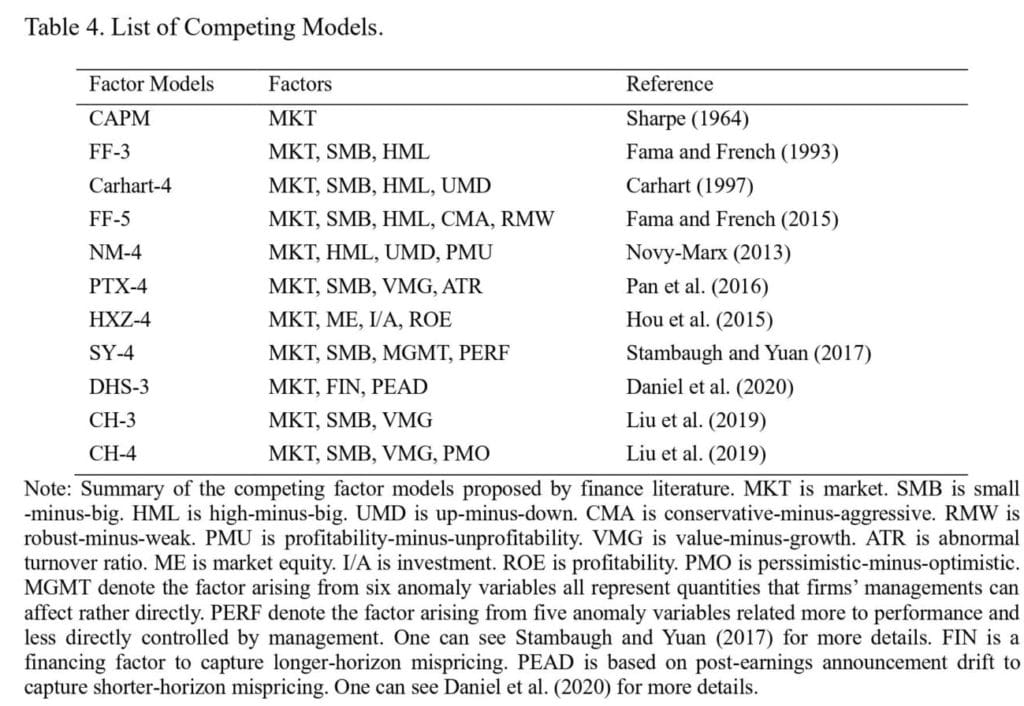
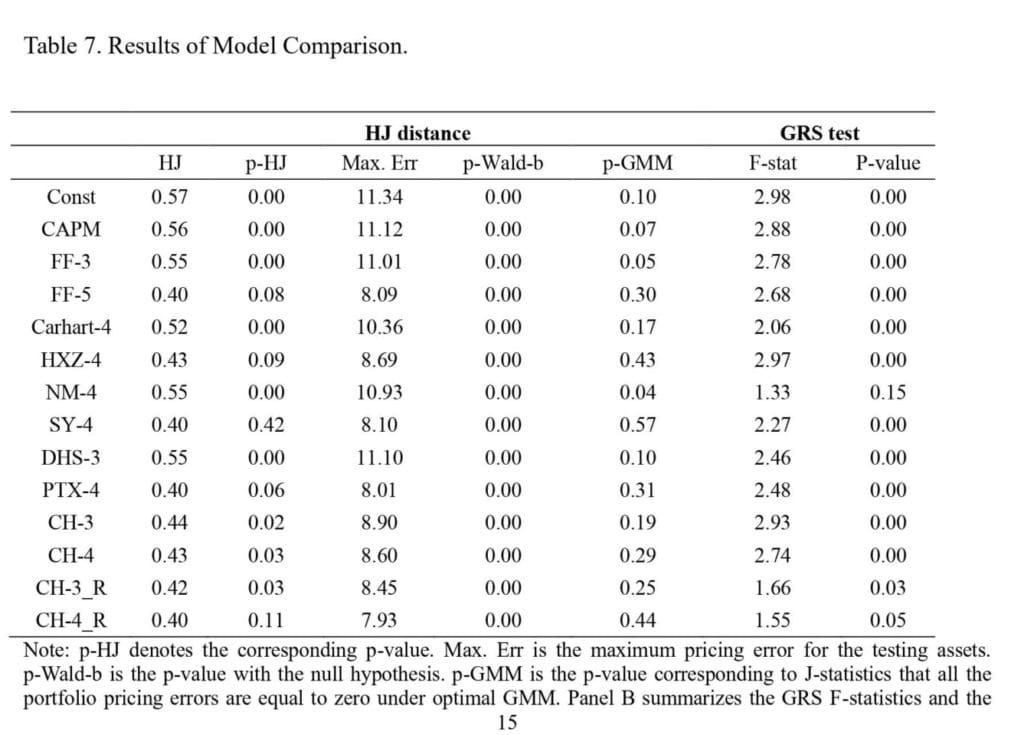
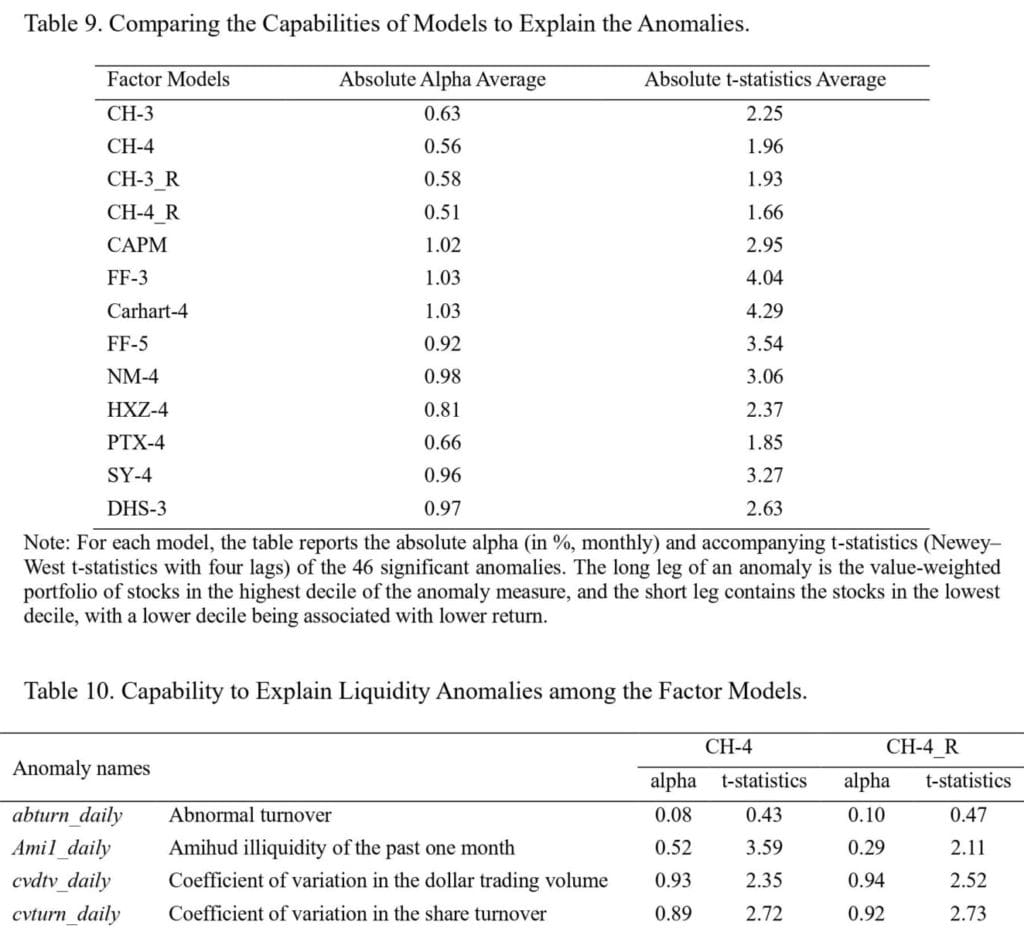
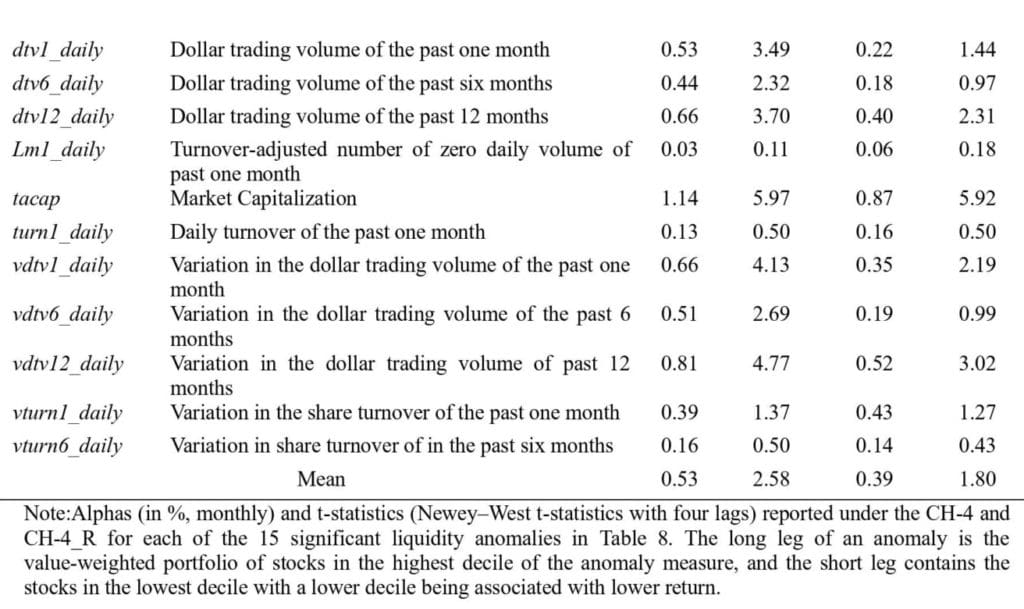
Second, we perform a series of rigorous model comparisons that include the most commonly used factor models. Unlike the comparison of asset pricing factor models in Sha and Gao (2019) and Ma et al. (2021), we examine 11 competing factor models based on various testing assets and methods to investigate model specification errors and pricing ability. Compared with the model of LSY, our revised model has the smallest pricing error measured through the HJ distance and can elucidate more liquidity anomalies. Portfolio managers may develop strategies to harvest the size premium, which contains “small” stocks in the bottom 30%. Thus, the proposed revised model is a more appropriate benchmark to evaluate portfolio performance.
Finally, our research can also play a role in improving market efficiency. An effective factor model can distinguish the source of systematic risk and provide a proper benchmark to compute the risk-adjusted return. Our study finds that following LSY’s proposal to construct factor models will lead to misestimating alpha in the portfolio evaluation. LSY’s research is quite influential; academics and financial practitioners may use the factor model to identify fund managers with active management ability. In that case, the capital might not be allocated to those skilled fund managers. As well known, active fund managers play an important role in correcting the mispricing in the security market and improving the degree of market efficiency. Therefore, we hold that our finding is beneficial for investment practice and capital allocation.
We aim to revise the CH-3 model by eliminating shell stocks. Stocks with a high ESP are more likely to get involved in the future RM deals. Therefore, we exclude high ESP stocks based on our replication of Lee et al. (2021). During each period, we construct our factor model and exclude firms with an ESP higher than a threshold value of 1%, but we also use the 0.1% and 5% as alternative threshold measures in robustness tests. The factor construction in our dataset displays similar explaining power. Since the ESP can only be estimated after 2011, we interpret the computed probability model as the rational expectation of a firm being a shell target. Because we cannot establish such a model in the pre-2011 period, it is reasonable to use the full universe of stocks when constructing our factors. We denote the revised CH-3 version as CH-3_R.
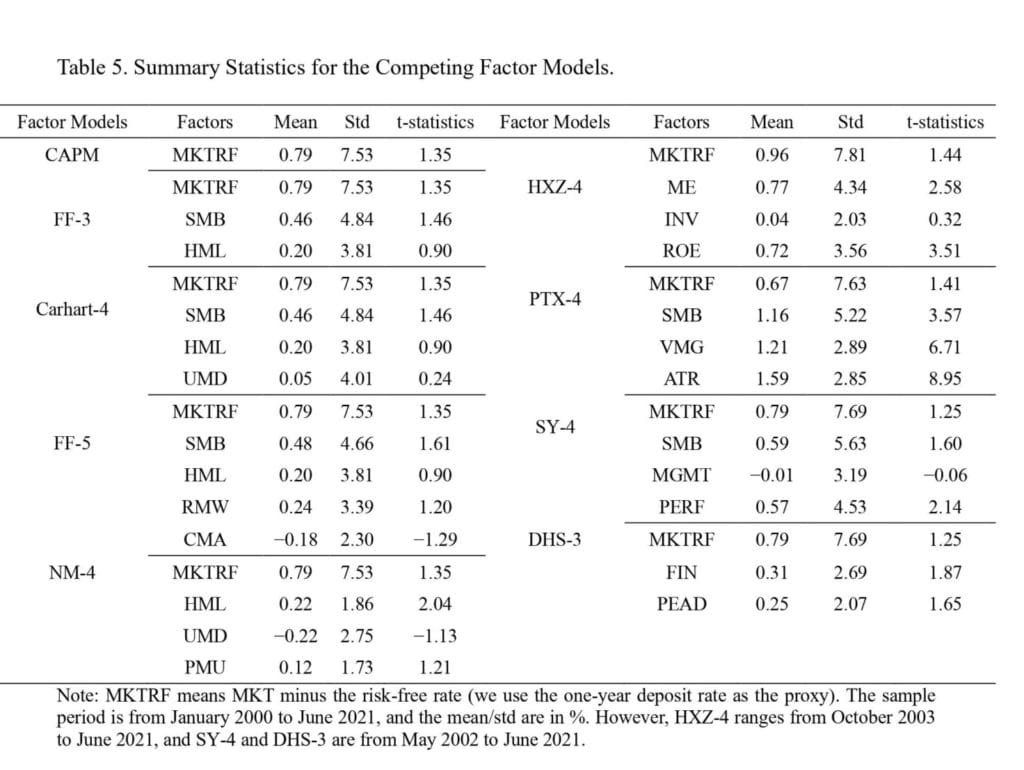
We report the summary statistics for the related factors in Table 3. CH-4_R presents the factor premiums that flexibly exclude the smallest firms based on their ESP. We present the mean, standard deviation, and t-statistics for each factor model. Furthermore, Table 3 displays the correlation between the raw CH-4 and the corresponding revised CH-4 factors. The inclusion of the smallest stocks drives the SMB from 0.46% per month to 0.74% (CH-4_R). Our revised MKT, VMG, and PMO factors are comparable to the raw CH-4 factors for the entire sample.
To evaluate the pricing ability for each factor model, a fair playing field must be established. We follow Fama and French (1993) and construct the 25 Fama–French portfolios. The deadline for Chinese listed firms to file annual reports is April 30. Therefore, we sort the stocks into quintiles based on size and E/P ratios at the end of April. The portfolio will be rebalanced until April of the subsequent year. The following filters are used when constructing the Fama–French portfolios: (i) the stock needs to be listed less than six months to avoid newly-issued firms and (ii) we remove any stocks with less than 120 trading records in the past year or less than 15 trading records in the past month to avoid trading suspension firms.
We report the mean, standard deviation, and t-statistics of the 25 Fama–French portfolios in Table 6. The average annualized returns range from 16.56% for the smallest firms with the lowest EP ratio to 18.12% for the smallest firms with the highest EP ratio. A nearly monotonic increase in average returns within a size quintile is observed as EP increases, barring the smallest size group. The average returns to the smallest firms are greater than those to the largest firms within the EP quintiles.
Altogether, the formal model comparison tests in this section reveal that our revised factor models outperform the original CH-3/4 models by LSY and other popular factor models. In particular, they outperform when (i) considering the model specification error, (ii) providing explanatory power for 25 Fama–French portfolios, and (iii) attempting to explain a variety of 122 anomalies in the Chinese stock market. The overarching results highlight the importance of approximating shell value contamination when constructing factor models to conduct empirical studies.”
Are you looking for more strategies to read about? Sign up for our newsletter or visit our Blog or Screener.
Do you want to learn more about Quantpedia Premium service? Check how Quantpedia works, our mission and Premium pricing offer.
Do you want to learn more about Quantpedia Pro service? Check its description, watch videos, review reporting capabilities and visit our pricing offer.
Do you want algorithmic access to the full Quantpedia database via the API? Subscribe to Quantpedia Pro, ask for an API key, and explore the in/out-of-sample statistics, source academic papers, and code snippets — ideal for quantitative research, systematic trading workflows, and AI model training.
Are you looking for historical data or backtesting platforms? Check our list of Algo Trading Discounts.
Or follow us on:
Facebook Group, Facebook Page, Telegram, Twitter, Linkedin, Medium or Youtube
Share onLinkedInTwitterFacebookRefer to a friend


