How to Build a Systematic Innovation Factor in Stocks
The aim of this article is multifold. It aims to answer the research question: does a portfolio consisting of top innovators outperform the S&P 500 index? To address this question, a strategy of investing long in top innovators according to their ranking is developed, and its performance is compared to that of the broad-based index. Based on the common belief that higher innovativeness carries higher risk, it aims to evaluate the volatility associated with innovative stocks. Additionally, it aims to analyze the impact of sector factors on the portfolio’s performance. Finally, it conducts a comparative analysis between the portfolio’s performance and that of the ARK Innovation ETF (ARKK), which specifically focuses on investing in companies relevant to the theme of disruptive innovation.
Innovation’s Profound Impact: theoretical background
In the world of business writing, there is widespread consensus on one thing: the significance of a company being innovative. Being creative and coming up with new ideas and solutions is seen as crucial for a company not just to survive but also to thrive and do well. In the beginning, research on innovation mainly looked at inventing and entrepreneurial efforts. Schumpeter[6] thought that for economies to grow and develop, it is crucial that new innovations replace the old ones through a process he called ‘creative destruction’. It is Schumpeter’s[6] theory of profit extraction, according to which innovation allows firms to temporarily hold a quasi-monopoly position, giving them the ability to extract rents. This theory is often cited as a justification for the favorable connection between a company’s innovativeness and its performance.
What does literature say?
Aligned with this viewpoint, marketing research suggests that innovativeness yields positive outcomes across diverse performance metrics. These include a firm’s market position, financial standing, and performance in the stock market[4,7]. Previous research has revealed a spectrum of impacts of innovation on firm value, ranging from nonexistent[1] to modest and applicable only in specific situations[3] to positive and substantial[4]. Executives often see innovation as a crucial strategy for achieving growth and financial success, even though it comes with inherent risks. According to the study[7], in which authors distinguish between breakthrough and incremental innovation in terms of building firm value, incremental innovation increases normal profits without affecting risk or economic rents, while breakthrough innovation is linked to higher economic rents and risk levels. However, authors conclude that despite the increased risk, shareholders benefit from a rise in equity value.
Having established the theoretical framework and delved into the related literature on innovation and its impact, our article is structured as follows: we first detail the data collection process. Next, we turn our attention to the methodology employed in our analysis, clarifying the approach taken in our portfolio construction, factor analysis, and regression analysis. Following that, we present our results, conduct performance comparisons against relevant benchmarks, and finally, draw our conclusions.
Data
Because a single mutually agreed-upon best measure of a firm innovativeness does not exist, for choosing the companies to be investigated, we looked at Fast Company’s list of the 50 World’s Most Innovative Companies. This list has been published annually since 2008. It acknowledges organizations that have introduced groundbreaking products, implemented innovative business strategies, promoted positive social impact, and transformed industries through their revolutionary approaches. Fast Company editors and writers assess each Most Innovative Company application based on four criteria: Innovation, to determine if the company has a distinctive and clearly demonstrated innovation; Impact, to evaluate the measured impact on the company and industry; Timeliness, to consider if the innovation occurred within the past 12 months or if there have been iterative advances; and Relevance, to examine how well the company explains the connection of the innovation to current events or broader industry and societal issues[2].
In each list, we identified the top 10 publicly traded companies, with the exception of the 2015 list where we found only 9 such companies, and obtained their price data from Yahoo Finance. More specifically, we obtained the adjusted close price, which is adjusted for stock splits, dividends, and other relevant events. We had to consider when the companies went public. For example, in the ranking from 2013, Uber is listed in the 6th place. However, it has been publicly traded since 2019, so we cannot include it in our portfolio from 2013. Our price dataset thus started on June 30, 2013 or inception date of firms that went public later. We were interested in determining the number of publicly traded firms in each list and, on average, there were 13.4 publicly traded companies per year. However, our primary focus was on the top 10 companies. Together out of all companies listed in the past 10 years, we pinpointed 55 as suitable candidates for our analysis. These statistical findings, depicted in Figure 1, reveal that while in 2021 and 2017 there were 17 publicly traded companies, in 2015, there were only 9 publicly traded companies.
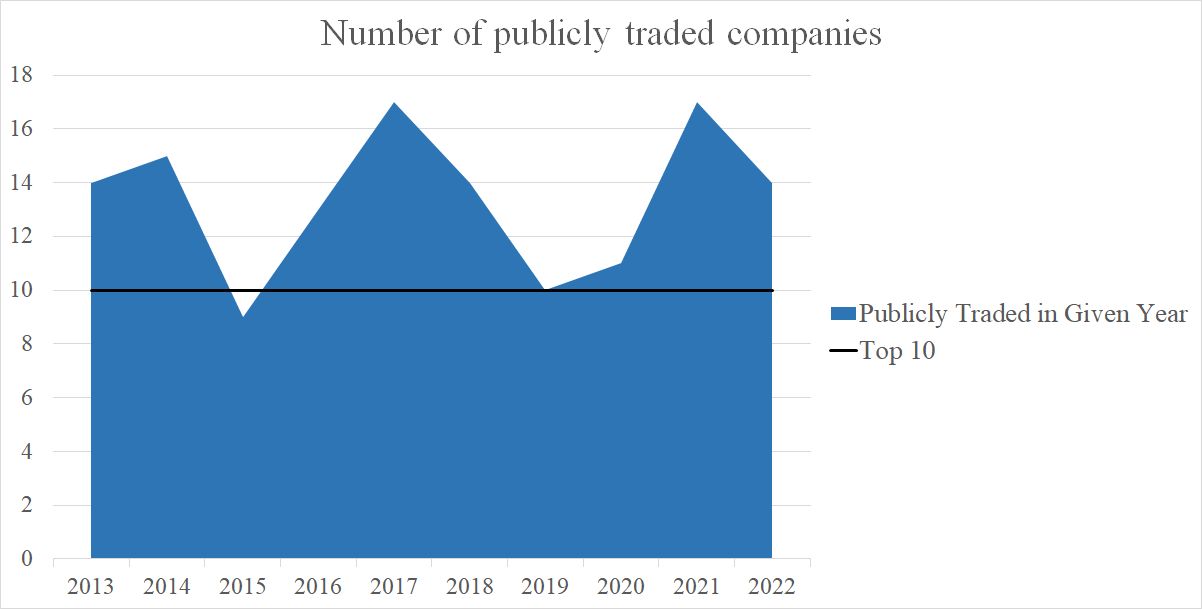
Figure 1 Number of publicly traded companies
Similarly, we also collected adjusted price data for the SPDR S&P 500 ETF Trust (SPY) from June 30th, 2013 and the ARK Innovation ETF (ARKK) since its inception on October 31, 2014.
Methodology
The Most Innovative Companies ranking debuted in 2008 and has been consistently updated each year around April. After identifying top innovative firms and obtaining their price data, we calculated their monthly performance. To create what we term ‘Innovative Portfolio,’ every mid-year, we establish a long-only portfolio, holding stocks of companies identified in that year’s list and rebalancing the portfolio in June of the following year. In other words, we buy stocks of the most innovative companies according to the 2012 rating on 30th of June 2012 and hold them until June 2013 (and then buy stocks of the most innovative companies according to the 2013 rating on 30th of June 2013). We then compare performance of this strategy to the performance of S&P 500 index as the benchmark, together with other characteristic such as Volatility and Sharpe Ratio.
Furthermore, we created a spread portfolio by going long on Innovative Companies and short on SPY. As we were interested in identifying the sectors contributing to the spread portfolio’s performance, we conducted a factor analysis, covering nine key sectors: Energy (XLE), Utilities (XLU), Technology (XLK), Materials (XLB), Consumer Staples (XLP), Consumer Discretionary (XLY), Industrial (XLI), Health Care (XLV), and Financials (XLF), with exclusions for Real Estate (XLRE) and Communication Services (XLC). After obtaining their adjusted daily prices, we calculated their monthly performance and deducted the results from the monthly market performance. The variance between monthly market performance and the monthly performance of each sector ETF serves as the sector factor. We enriched these factors with 3 more: Size, Value, and Market Beta Factors, introduced by Fama and French (1992). Size was calculated by comparing the monthly performance of small-cap stocks in iShares Russell 2000 ETF (IWM) with the large-cap S&P 500 Index (SPY). Value was calculated by comparing the monthly performance of value stocks in iShares S&P 500 Value ETF (IVE) with growth stocks in iShares S&P 500 Growth ETF (IVW). Lastly, Market Beta was calculated by comparing the monthly performance of the S&P 500 Index (SPY) with the monthly performance of a risk-free asset, represented by the short-term 1-3 Month Treasury Bill ETF (BIL). In total, we derived 12 factors.
Next, we conducted an Ordinary Least Squares (OLS) regression analysis, which, by using the spread portfolio as the dependent variable and sector and style factors as independent variables, identified sectors and style factors driving the performance distinctions between the Innovation Portfolio and the S&P 500 index.
Our last step was comparing monthly performance of our portfolio with the ARK Innovation ETF. Again, we calculated monthly performance of the index from Yahoo Finance price data and calculated correlation between them.
Results
Innovative Portfolio vs SPY
First, let’s evaluate the performance of our long-only portfolio during the 2013-2023 period compared to the broad-based index. As indicated in Table 1, the Innovative Portfolio achieved a superior annualized return (18.24%) over this period, outperforming the S&P 500 ETF Trust (12.75%). Figure 2 illustrates that the Innovative Portfolio notably outperforms the SPY during 2019 to 2021. By the end of 2021, the Innovative Portfolio experiences a pronounced peak in performance followed by a steep decline. Its success in return comes with larger price fluctuations, evidenced by the Innovative Portfolios volatility of 26.12%, compared to the SPY’s volatility of 14.90%. The Innovative Portfolio experienced a more significant maximum drawdown of -60.40%, contrasting with the SPY’s -23.93%, representing higher peak-to-trough decline for the Innovative Portfolio. In terms of risk-adjusted performance, the SPY demonstrated superiority with a higher Sharpe Ratio of 0.86, indicating a more favorable balance between return and risk compared to the Innovative Portfolios 0.70. The Sortino Ratio, a variation of the Sharpe ratio, confirms this trend where the SPY’s 0.53 surpasses the Innovative Portfolios 0.30, pointing to better risk-adjusted performance. In addition to analyzing the performance metrics, we present a graphical representation of the Innovative Portfolio’s alpha over the study period. Figure 3 visually depicts the excess return generated by our portfolio compared to the S&P 500 index.
Overall, according to our analysis, although the Innovative Portfolio demonstrated a superior annual performance, it also exhibited increased volatility and a more substantial maximum drawdown. Conversely, the SPY displayed worse risk-adjusted performance, evident in its lower Sharpe and Sortino Ratios.
| CAR | Volatility | Sharpe Ratio | Sortino | Max DD | |
| Innovative Portfolio | 18,24% | 26,12% | 0,70 | 0,30 | -60,40% |
| SPY | 12,75% | 14,90% | 0,86 | 0,53 | -23,93% |
Table 1 Innovative Portfolio vs SPY characteristics
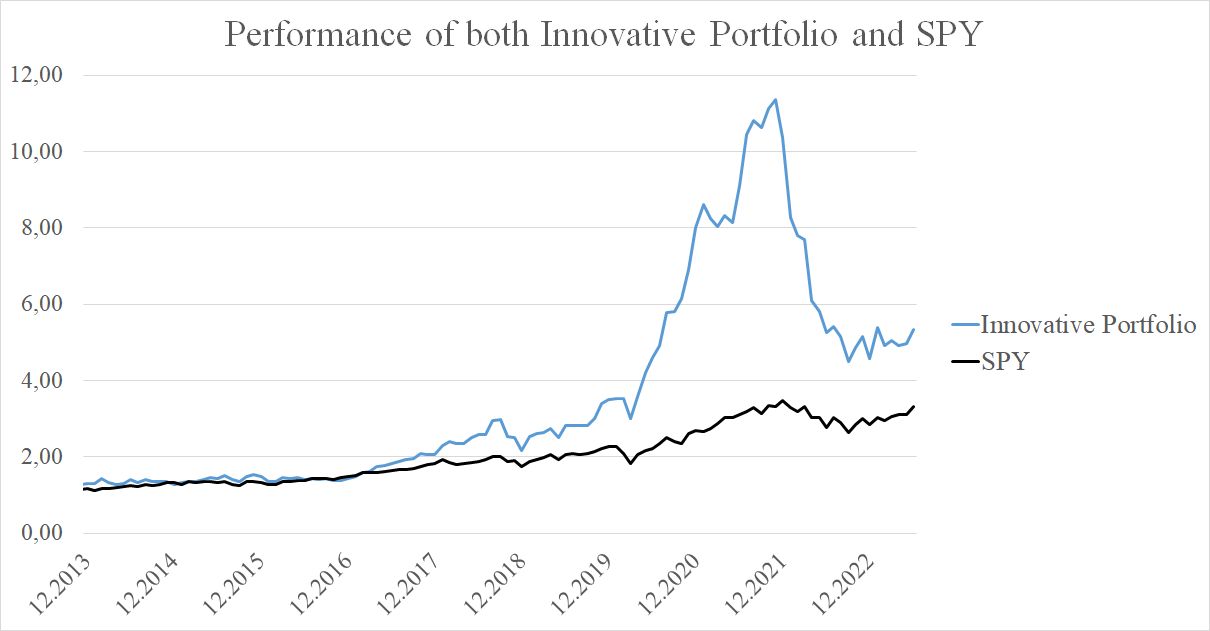
Figure 2 Performance of both Innovative Portfolio and SPY
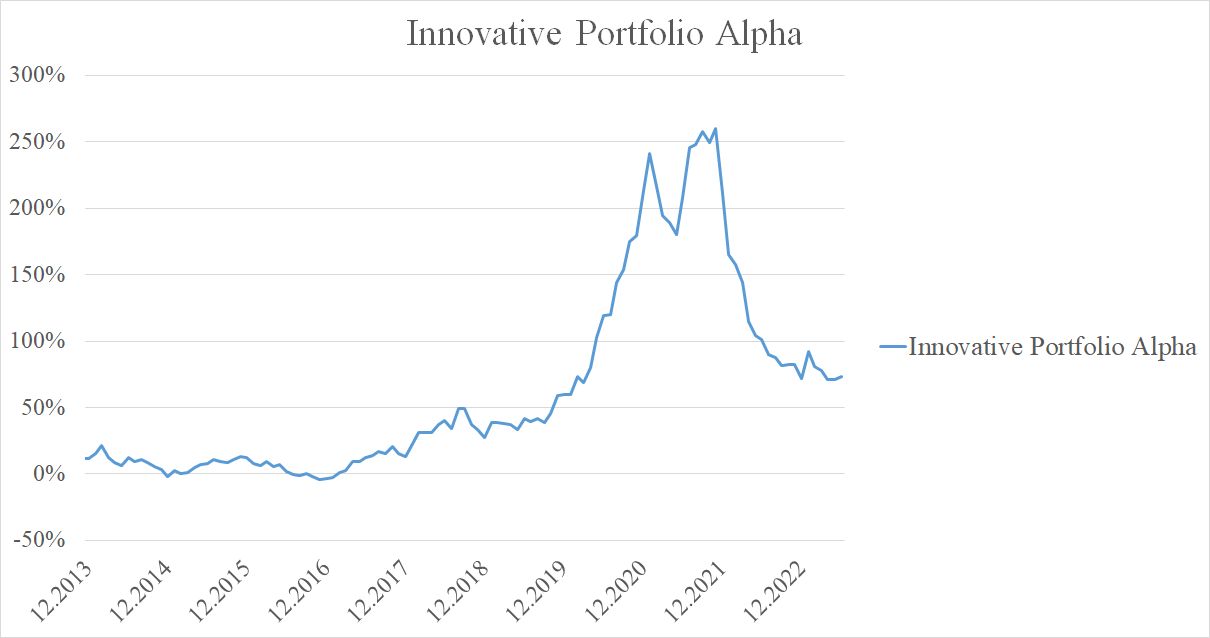
Figure 3 Innovative Portfolio Alpha
Innovative Portfolio vs SPY Factor Analysis
In Table 2, the results of the OLS regression for factor analysis reveal that, among the considered factors, the Size factor significantly influences the portfolio’s performance, as evidenced by a notable t-statistic of 4.71.
| Coefficients | Standard Error | t Stat | |
| Intercept | 0.0037 | 0.0041 | 0.9071 |
| Market | 0.1216 | 0.1104 | 1.1008 |
| Industrial | -0.5503 | 0.2423 | -2.2713 |
| Value | -0.5321 | 0.3106 | -1.7130 |
| Financial | -0.3571 | 0.2435 | -1.4669 |
| Consumer Staples | -0.3098 | 0.2163 | -1.4324 |
| Consumer Discretionary | -0.2764 | 0.2432 | -1.1366 |
| Energy | -0.2143 | 0.0847 | -2.5313 |
| Technology | -0.1812 | 0.3745 | -0.4839 |
| Utilities | -0.1603 | 0.1329 | -1.2062 |
| Health Care | -0.1108 | 0.2273 | -0.4874 |
| Materials | 0.1316 | 0.1669 | 0.7888 |
| Size | 0.8447 | 0.1793 | 4.7119 |
Table 2 OLS regression results
To visually represent the impact of the 9 sector and 3 style factors on the performance differential between the Innovative Portfolio and the SPY index, Figure 4 is presented. Positive values along the x-axis signify outperformance, with the Market, Materials, and Size factors showing positive trends. Notably, Size (t = 4.71) stands out as statistically significant, while Energy (t = -2.53) and Industrial (t = -2.27) also play a significant role, however on the negative side. The primary driver of the portfolio’s outperformance is the Size Factor, emphasizing the crucial role of smaller-cap stocks in generating positive returns. The R-squared value of 0.4881 indicates that approximately 48.81% of the variability in the dependent variable (performance disparities between the Innovative Portfolio and the SPY index) can be explained by the independent variables (9 sector and 3 style factors). In other words, the factors considered collectively account for almost half of the observed variation in the portfolio’s performance relative to the SPY index. The remaining performance variability is attributed to idiosyncratic risk. For a more explicit understanding of how different sectors and style factors contribute to overall portfolio returns, refer to Figure 5 which depicts the cumulative contribution of given factors.
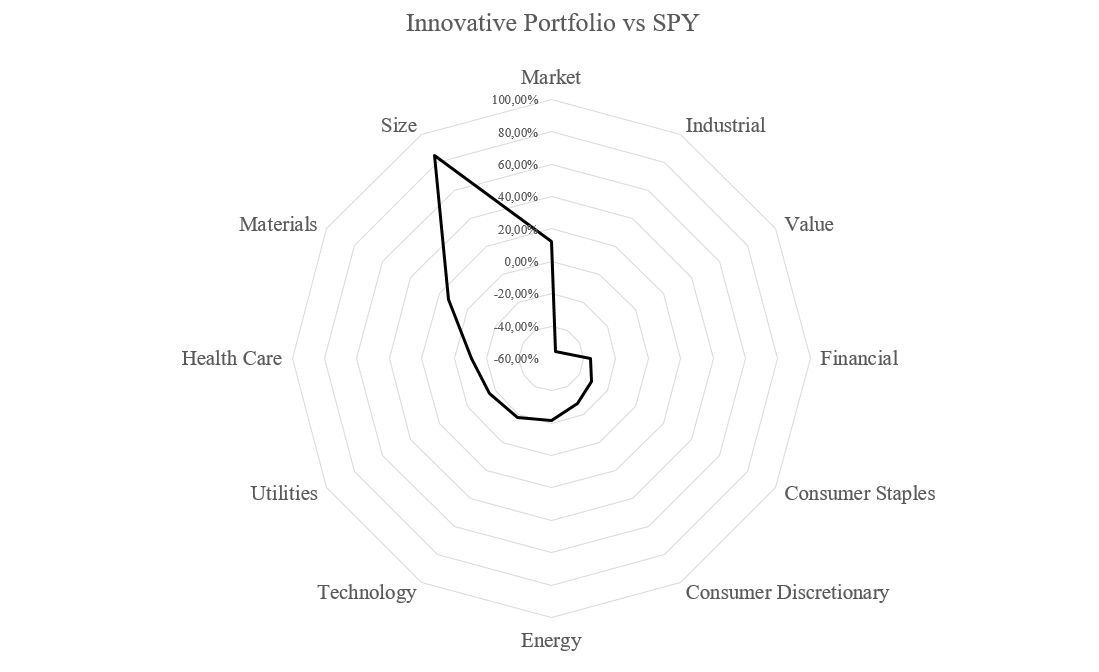
Figure 4 Factor Analysis
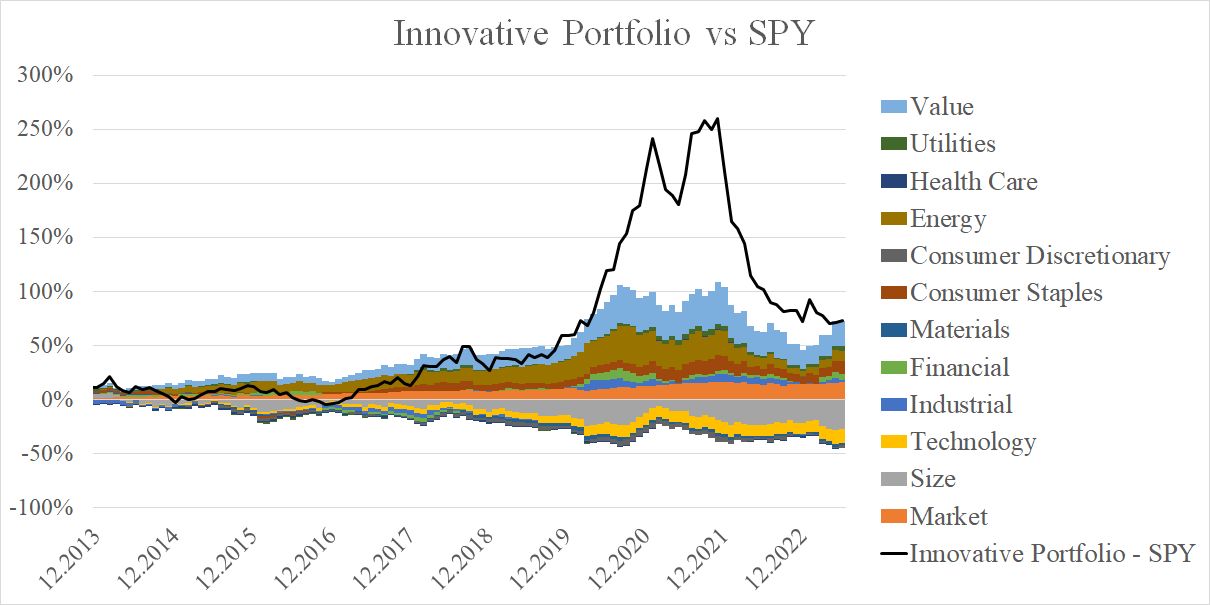
Figure 5 Innovative Portfolio vs SPY Factor Cummulative Contribution
Innovative Portfolio vs ARKK
Finally, we would like to share the results of our portfolio’s comparison with the ARK Innovation ETF. ARK Innovation ETF (ARKK) is an actively-managed fund investing in companies related to disruptive innovation, focusing on genomics, automation, energy transformation, AI, next-gen internet, and fintech. ‘Disruptive innovation,’ as defined by ARK, refers to the introduction of technologically enabled new products or services that could change the way the world operates. It seeks high-conviction ideas within this theme, with top holdings including Coinbase, Roku, Tesla, and Zoom. Led by Cathie Wood, ARK’s CIO, it targets high-growth sectors but faces risks, as seen in the 2022 challenges amid economic crises and the Federal Reserve’s response to inflation, impacting high-growth stocks in Ms. Wood’s portfolio.
The high correlation coefficient of 0.83 between the performance of the Innovative Portfolio and the ARK Innovation Index suggests a strong positive linear relationship. In practical terms, this indicates that the two portfolios tend to move in the same direction over time, as can be seen in Figure 6. It may suggest that both portfolios are influenced by similar drivers – similar market factors or economic conditions. However, ARKK is discretionary-based, while our strategy is systematic, based on publicly available dataset.
As for possible explanation of performance development, the rise of the ARK Innovation ETF might be attributed to accelerated impact of technological trends, including remote work and e-commerce, driven by the COVID-19 pandemic. However, the ETF faced a significant fall in the past two years due to economic uncertainty and tightening monetary policy. The Federal Reserve’s efforts to combat inflation through interest rate hikes had significant impact on ARKK, given its heavy concentration in growth stocks, which are sensitive to rising interest rates.
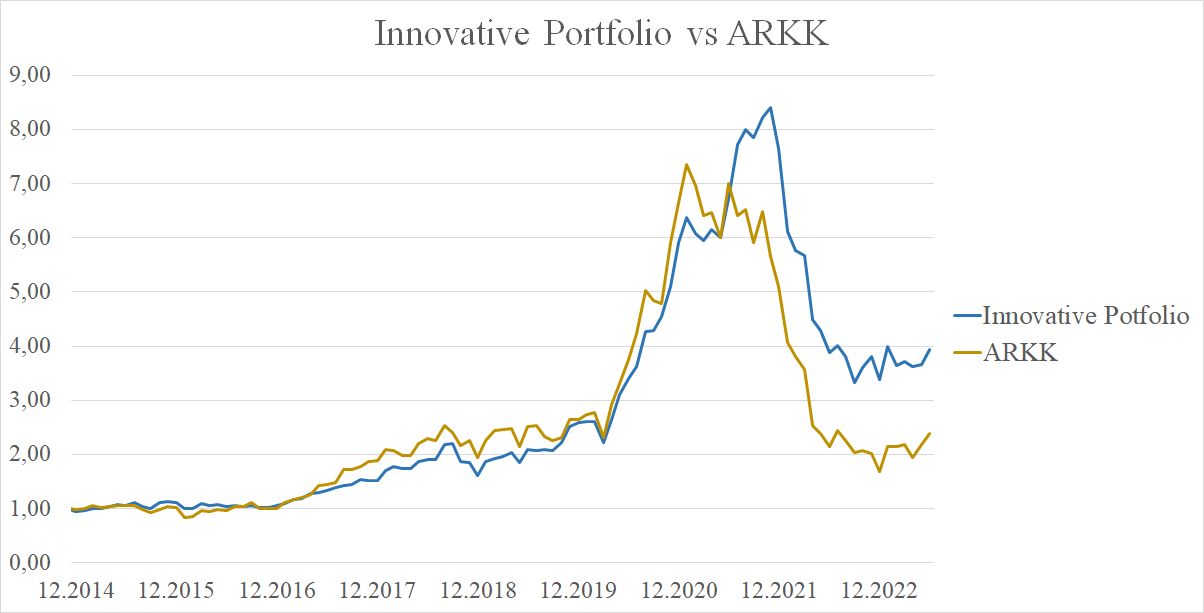
Figure 6 Innovative Portfolio vs ARKK
Conclusion
Innovation is crucial, as it fosters competitiveness and fuels economic growth. Our study adds to the existing literature by exploring the impact of firm innovativeness on stock performance, contributing valuable insights to this dynamic field.
In the first part of our analysis, we focused on evaluating the performance of a strategy centered on holding top innovative companies, which we named the “Innovative Portfolio.” Our primary objective was to answer the question of whether such a portfolio could generate significant alpha (outperform) a broad-based index, in our case, the S&P 500 index. Our results indicate that indeed, this portfolio outperforms the index but at the cost of higher volatility. In summary, while the Innovative Portfolio achieved a higher annual performance (18,24% vs 12,75%), it was accompanied by higher volatility (26,23% vs 14,9%) and a larger maximum drawdown (-60,40% vs -23,93%). On the contrary, the SPY showcased better risk-adjusted performance, reflected in its higher Sharpe and Sortino Ratios. This finding aligns with the theoretical assumption that a higher level of innovation leads to a higher firm value in terms of a firm’s performance on the stock market. It also aligns with the notion that higher returns come with higher volatility.
Next, we examined the sectors influencing the performance of the Innovative Portfolio. Out of the 12 sector and style factors considered, the Size Factor emerged as the key driver behind the portfolio’s superior performance. All the considered factors collectively explain almost half of the observed performance variance from the SPY index, leaving the remainder attributable to idiosyncratic risk, referring to company-specific factors.
Lastly, we compared the performance of our portfolio to the performance of the ARK Innovation ETF, which invests in growth stocks. We found that their performances share high positive correlation and exhibit similar behavior, including rapid fall in value during last two years due to rising inflation and tightening monetary policy.
Are you looking for more strategies to read about? Sign up for our newsletter or visit our Blog or Screener.
Do you want to learn more about Quantpedia Premium service? Check how Quantpedia works, our mission and Premium pricing offer.
Do you want to learn more about Quantpedia Pro service? Check its description, watch videos, review reporting capabilities and visit our pricing offer.
Are you looking for historical data or backtesting platforms? Check our list of Algo Trading Discounts.
Do you have an idea for systematic/quantitative trading or investment strategy? Then join Quantpedia Awards 2024!
Or follow us on:
Facebook Group, Facebook Page, Twitter, Linkedin, Medium or Youtube
[1] Eddy, A. R., & Saunders, G. B. (1980). New product announcements and stock prices. Decision sciences, 11(1), 90-97.
[2] Fast Company Lists. (n.d.). https://www.fastcompany.com/lists
[3] Geroski, P., Machin, S., & Van Reenen, J. (1993). The profitability of innovating firms. The Rand journal of economics, 198-211.
[4] Pauwels, K., Silva-Risso, J., Srinivasan, S., & Hanssens, D. M. (2004). New products, sales promotions, and firm value: The case of the automobile industry. Journal of marketing, 68(4), 142-156.
[5] Rubera, G., & Kirca, A. H. (2012). Firm innovativeness and its performance outcomes: A meta-analytic review and theoretical integration. Journal of Marketing, 76(3), 130-147.
[6] Schumpeter, J.A. (1942) Capitalism, Socialism and Democracy. Vol. 36, Harper & Row, New York, 132-145.
[7] Sorescu, A. B., & Spanjol, J. (2008). Innovation’s effect on firm value and risk: Insights from consumer packaged goods. Journal of Marketing, 72(2), 114-132.
Share onLinkedInTwitterFacebookRefer to a friend


