Implied Volatility Indexes for European Government Bond Markets
Volatility indexes are essential parts of the financial markets. They offer investable opportunities and exposure to the volatility, but most importantly, those indexes offer forward-looking measures of option-implied uncertainty. Therefore, such indexes are often used as indicators of risk or sentiment in the markets. For example, the well-known VIX index is often called the fear-index. The volatility indexes are not exclusive to the equity market. There are fixed-income option-implied volatility indexes for US Treasury futures, but the European fixed income market lacks such index. This novel research paper by Jaroslav Baran and Jan Voříšek fills this gap and proposes volatility indexes, connected to the euro bond futures using the Cboe TYVIX (US Treasury implied volatility index) (2018) methodology. As a result, the TYVIX and euro bond futures volatility indexes are directly comparable.
Authors: Jaroslav Baran and Jan Voříšek
Title: Volatility indices and implied uncertainty measures of European government bond futures
Link: https://www.esm.europa.eu/sites/default/files/wp43.pdf
Abstract:
Implied volatility and other forward-looking measures of option-implied uncertainty help investors carefully evaluate market sentiment and expectations. We construct several measures of implied uncertainty in European government bond futures. In the first part, we create new volatility indices, which reflect market pricing of subsequently realised volatility of underlying bond futures. We express volatility indices in both price and basis points, the latter being more intuitive to interpret; we document their empirical properties, and discuss their possible applications. In the second part, we fit the volatility smile using the SABR model, and recover option-implied probability distribution of possible outcomes of bond futures prices. We analyse shapes of the implied distribution, track its quantiles over time, calculate its skewness and kurtosis, and infer probabilities of a given upside or downside move in the price of bond futures or in the yield of their underlying CTD bond. We illustrate these complementary measures throughout the note using Bund futures as an example, and show the results for Schatz, Bobl, OAT, and BTP futures in the annex. Such forward-looking measures help market participants quantify the degree of future market uncertainty and thoroughly assess what risks are priced in.
The paper includes many interesting charts for volatility index of german bond futures:
Notable quotations from the academic research paper:
“Volatility indices, built upon the methodology of Cboe VIX (2019), have become popular measures of market uncertainty over the short term, across a range of underlying asset classes. They are easily interpretable as they reflect market pricing of subsequently realised volatility, implied from option prices, usually over the next 30 days. Fixed income option-implied volatility indices and products linked to them are already available in the US (for US Treasury futures and interest rate swaps – Cboe TYVIX/SRVIX indices, ICE BofAML MOVE/SMOVE index) and Japan (for JGB futures – S&P/JPX JGB VIX). In the case of other asset classes, the development of volatility indices has a longer history with a number of existing indices across equities, credit, commodities or FX.
| Do you want to test these ideas yourself? We offer our readers Historical Trading Data Discounts. |
In the euro area fixed income market, euro swaptions are usually used to monitorthe implied volatility of the underlying euro swap rates. However, we are not aware of any volatility index on European government bond futures. Such indices would provide insights into investor sentiment and forwardlooking market uncertainty of the underlying European sovereign bond market.
We expand the family of volatility indices and propose the construction of new implied volatility indices from options on European government bond futures traded on the Eurex exchange. We follow Cboe TYVIX (2018) methodology with a small adjustment. The underlying instruments for the quoted options are German, French and Italian government bond futures. In the case of Germany, we calculate volatility indices for different maturities from options on Schatz (2-year), Bobl (5-year), and Bund futures (10-year), the go-to reference for euro area yields, and the most traded interest rate derivative on Eurex exchange.
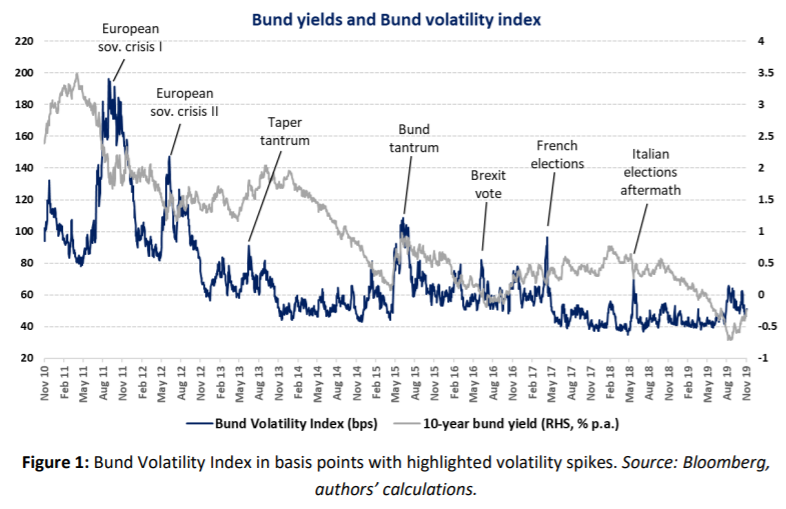
In the case of equities, empirical evidence suggests that market downturn is almost always associated with heightened volatility, however, fixed income volatility appears to be less directional; implied volatility increases both during a Bund sell-off and a Bund rally, given its flight to safety status.
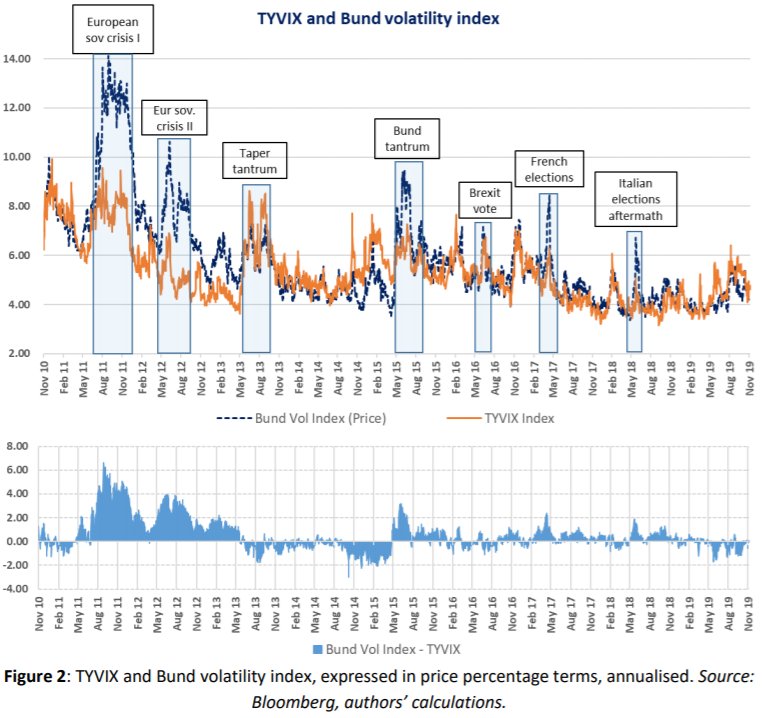
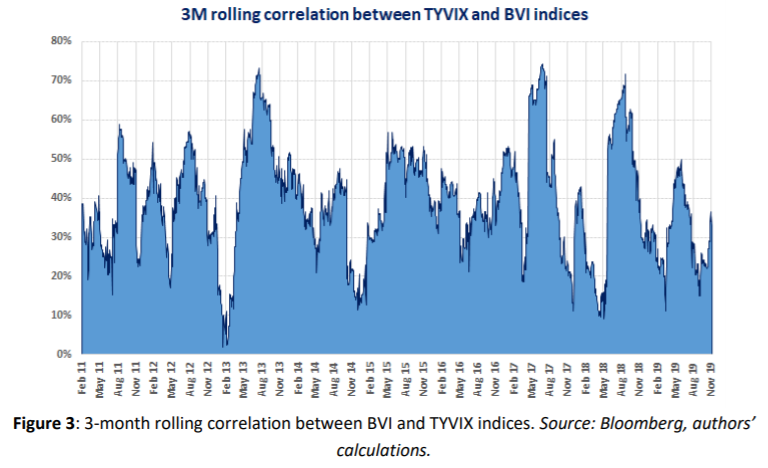
We can observe several other characteristics, similar to volatility of other asset classes. For example, Bund implied volatility suggests regime-like behaviour: average Bund implied volatility appears to have moved from higher values in 2011-2012 to lower values in 2013-2014, then the average volatility increased between 2015 and the beginning of 2017 before decreasing again. We can also observe mean reversion; every sudden spike eventually returned towards calmer periods, occasionally establishing a new regime. Volatility spikes and drops often reflect pricing of the uncertainty of a particular event: the volatility increases as the event date approaches, and drops after the event passed. The Bund volatility index has been moving together with the US Treasury implied volatility index, TYVIX, with a few exceptions related to European events, such as developments in the euro area sovereign credit spreads or repricing of the ECB rate expectations.”
Are you looking for more strategies to read about? Sign up for our newsletter or visit our Blog or Screener.
Do you want to learn more about Quantpedia Premium service? Check how Quantpedia works, our mission and Premium pricing offer.
Do you want to learn more about Quantpedia Pro service? Check its description, watch videos, review reporting capabilities and visit our pricing offer.
Do you want algorithmic access to the full Quantpedia database via the API? Subscribe to Quantpedia Pro, ask for an API key, and explore the in/out-of-sample statistics, source academic papers, and code snippets — ideal for quantitative research, systematic trading workflows, and AI model training.
Are you looking for historical data or backtesting platforms? Check our list of Algo Trading Discounts.
Or follow us on:
Facebook Group, Facebook Page, Telegram, Twitter, Linkedin, Medium or Youtube
Share onLinkedInTwitterFacebookRefer to a friend


