Out-of-sample Dataset Before the “Sample”: Pervasive Anomalies Before 1926
Data are the key to systematic investing/trading strategies. The hypotheses testing, risk or return evaluations, correlations, and factor loadings rely on past data and backtests. With an increasing speed of publication in finance, critiques of quantitative strategies have emerged. Strategies seem to decay in alpha, post-publication returns tend to be lower, and many strategies become insignificant once rigorously tested (in or out-of-sample). Moreover, some might even appear profitable purely by chance and the repetitive examination of the same dataset, such as CRSP stocks after 1963.
Is there any solution to overcome these limitations? Partially, the design of the novel machine learning strategies consisting of training, validation, and testing sets might help. Perhaps the most crucial part of such a scheme is the usage of the purely out-of-sample dataset. In this regard, the novel research by Baltussen et al. (2021) provides several valuable findings for the most recognized factors. The authors constructed a database of U.S. stocks, including dividends and market caps for 1488 major stocks from 1866 to 1926. The sample can be described as the pre-CRSP period, including independent, pre-publication, and “out-of-sample” data that can be a perfect test for the factors utilized today.
So what about the findings? The relationship between market beta and returns is insignificant and flat, but the low-beta stocks have highly significant CAPM alpha. Size premium is also negligible. Important factors appear to be momentum (12-1), dividend yield (which serves as a proxy for the value), and short-term reversal. Other crucial findings are that the factor premiums cannot be explained by macroeconomic risk, and the characteristics can explain 28% of the variation in returns. Lastly, the research shows that there are several pervasive factors with insignificant out-of-sample decay in premiums. Overall, the study is perhaps the best out-of-sample test of factors we can get right now.
Author: Guido Baltussen, Bart P. Van Vliet and Pim Van Vliet
Title: The Cross-Section of Stock Returns before 1926 (And Beyond)
Link: https://papers.ssrn.com/sol3/papers.cfm?abstract_id=3969743
Abstract:
We study the cross-section of stock returns using a novel constructed database of U.S. stocks covering 61 years of additional and independent data. Our database contains data on stock prices, dividends and hand-collected market capitalizations for 1,488 major stocks between 1866-1926. Results over this ‘pre-CRSP’ era reveal a flat relation between market beta and returns, an insignificant size premium, and significant momentum, value and low-risk premiums that are of similar size as over the post-1926 period. Overall, stock characteristics can explain over 25% of variation in stock returns. Further, recent machine learning methods are successful in predicting cross-sectional returns out-of-sample. These results show strong out-of-sample robustness of traditional factor models and novel machine learning methods.
As always we present several interesting figures:
Notable quotations from the academic research paper:
“Several studies reveal variables that predict cross-sectional differences in stock returns. Importantly, most of the existing empirical asset pricing studies rely on a 50 to 60 year sample of U.S. stocks, mostly covering the post-1963 period. However, this sample is extensively analyzed, raising the concern that studies on stock factors are potentially plagued by data dredging or p-hacking effects (Harvey, 2017, Fama and French, 2018). Consequently, many of the stock factors that seem important in-sample
may lose explanatory power, or even fail to hold up out-of-sample. As a case in a point, Harvey, Liu, and Zhu (2016) find that of over 300 documented stock-level anomalies many become questionable after analyzing these in a rigorous testing framework that allows for multiple hypotheses testing bias.
In this paper we study the cross-section of U.S. stock returns using a novel constructed database of out-of-sample data over the period 1866-1926. This ‘pre-CRSP’ sample period is of about similar length as existing CRSP-based studies (61-years), and covers an economically important period that is independent to existing datasets. This period was characterized by strong economic growth and rapid industrial developments, laying the foundations for the U.S. becoming the leading economic power in the world. Stock markets were well-developed as important trading venues, playing a pivotal role in economic growth and the financing of key innovations, with stock market capitalizations growing from USD 278 million to USD 18.8 billion (equivalent to USD 4.9 billion and USD 274.5 billion in 2020 real terms) for the stocks included in our sample, about similar to nominal GDP growth. Opening up this new and large stock market database before 1926 provides new grounds for independent tests to better understand stock prices and drivers of return.
As such, the first major contribution of this study is the creation of a novel database covering 61-years including the major stocks traded on the U.S. exchanges during the second half of the 19th and early 20th century. This database consists of stock prices, dividend yields, and market capitalization values with data from January 1866 through December 1926. To our knowledge we are the first to create a data set for this period including market capitalization values. Importantly, we hand-collect market capitalization, as an historical abundance of small stocks (like banks, many subject to infrequent trading) could render findings economically less important.
The second major contribution of this study is to examine the cross-section of stock returns out-of-sample in a robust and rigorous way. To this end, we focus on the most commonly studied stock characteristics that we can construct over our sample and avoid conducting a large data dredging exercise: risk (measured by market beta, but also by total volatility or idiosyncratic volatility), firm size (measured as total market capitalization of equity), dividend yield, 12-1 month price momentum, and short-term 1-month reversal.
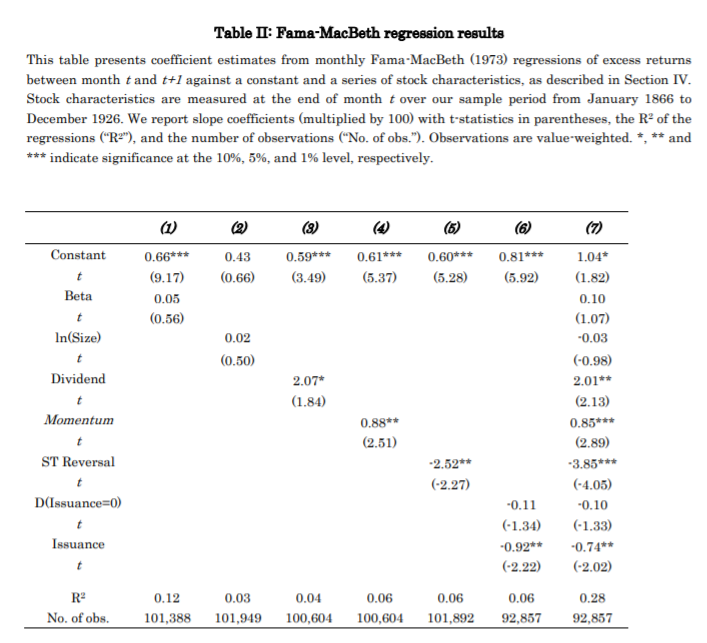
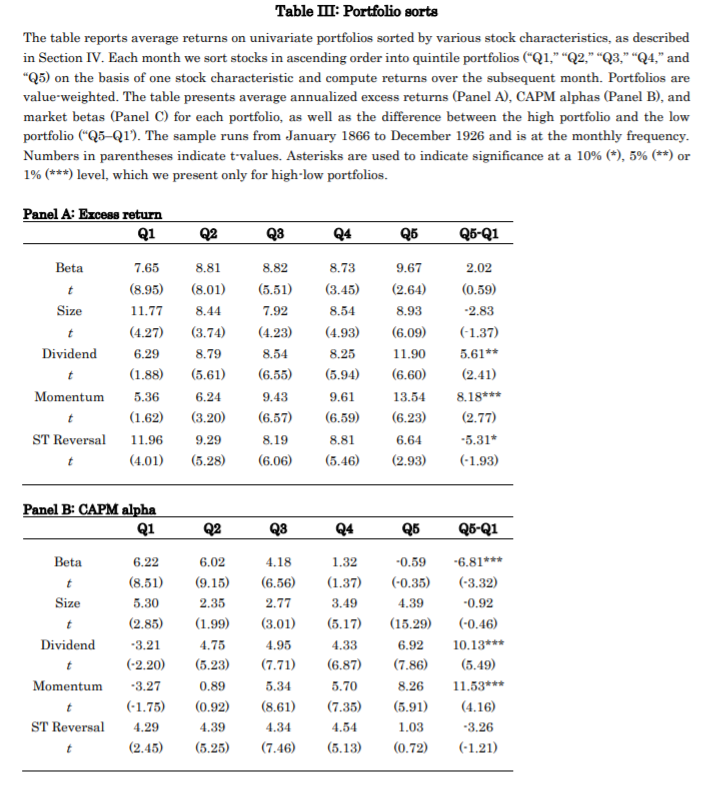
We start our analysis with Fama-MacBeth (1973) regressions and univariate portfolio sorts, both which we value-weight to prevent an undue impact of smaller stocks. In line with Black, Jensen and Scholes and Fama-MacBeth we find that market beta is not priced in the cross-section and the CAPM on average fails to explain asset prices: low-beta stocks have positive alpha and high-beta stocks have negative alpha over the 1866-1926 sample. Further,
price momentum and dividend yield carry significant cross-sectional premiums or return spreads. By contrast, size has no significant slope in Fama-MacBeth regression and no significant return spread in portfolio sorts, while short-term reversal is only significant in Fama-MacBeth regression. Combined, the six stock characteristics can explain 28% of the
variation in stock returns.
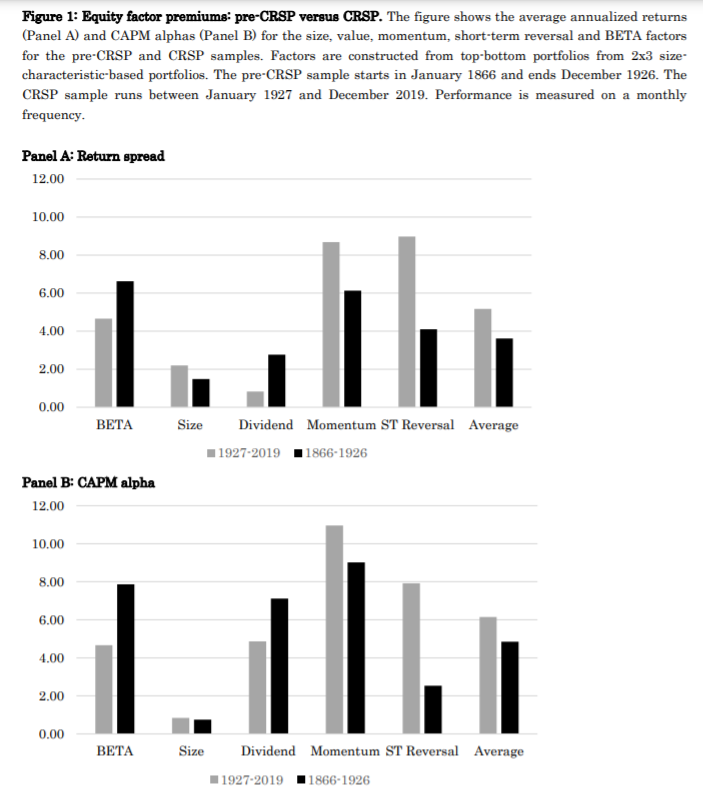
Next, we build ‘Fama-French style’ factor portfolios, double-sorted on size and a factor characteristic. As size is known to interact strongly with other characteristics (e.g. Fama and French, 1992, 2012, and Israel and Moskowitz, 2013) and our historical sample includes sufficient coverage on market capitalization, we can control for interaction with size. Akin to Frazzini and Pedersen (2014) we lever beta-sorted portfolios to be market-neutral. Our main results for these ‘standard factor’ 2×3 portfolios are summarized in Figure 1. We find economically substantial and statistically significant premiums and CAPM alphas for momentum, dividend yield and low-risk (i.e. BETA), and insignificance of the size premium. For short-term reversal we find significant premiums, but insignificant CAPM alphas. Overall, findings on stock factors are largely similar over the pre-1926 and post 1926 era’s. Further tests show that these results are generally robust across time and testing choices (including using total or idiosyncratic volatility to measure low-risk) hold up across industries and exchanges, and are robust to various controls on data quality. Further, factor spanning tests reveal that momentum, dividend yield, low-risk, but also short-term reversal are nonredundant asset pricing factors, while size is subsumed by the other factors. Overall, these results leave us to conclude that especially momentum, value and low-risk are persuasive empirical asset pricing factors.
Next, we explore several features of the early sample period to provide insights into economic explanations of stock factor premiums. The 1866-1926 period is interesting for several reasons. First, the pre-sample is characterized by large macroeconomic shocks and market fluctuations, providing out-of-sample insight into macroeconomic risk explanations.
For example, Asness, Moskowitz and Pedersen (2013) find that value and momentum premiums link to macroeconomic risks. Second, delegated asset management was notably absent over this period (Rouwenhorst, 2004), hence providing a natural test on the role of delegated management. Vayanos and Woolley (2013) argue that momentum and value returns can originate from delegated management, as cashflows to investment funds
influence prices. Third, momentum has been shown to carry crash risk (e.g. Daniel and Moskowitz, 2016). We find no clear evidence that macroeconomic risks explain stock factor premiums, as the factors generally bear no statistically or economically significant relation to
common macroeconomic factors. Further, our results are inconsistent with the delegated management hypothesis, as we find a significant momentum premium over the early sample, and we find no evidence of crash risk for momentum, opposite to the patterns observed post 1926.”
Are you looking for more strategies to read about? Sign up for our newsletter or visit our Blog or Screener.
Do you want to learn more about Quantpedia Premium service? Check how Quantpedia works, our mission and Premium pricing offer.
Do you want to learn more about Quantpedia Pro service? Check its description, watch videos, review reporting capabilities and visit our pricing offer.
Do you want algorithmic access to the full Quantpedia database via the API? Subscribe to Quantpedia Pro, ask for an API key, and explore the in/out-of-sample statistics, source academic papers, and code snippets — ideal for quantitative research, systematic trading workflows, and AI model training.
Are you looking for historical data or backtesting platforms? Check our list of Algo Trading Discounts.
Or follow us on:
Facebook Group, Facebook Page, Twitter, Linkedin, Medium or Youtube
Share onLinkedInTwitterFacebookRefer to a friend


