Quality Factor in Sector Investing
In general, a factor is described as a characteristic that can be associated with a group of assets, and it helps to explain their returns and risks. As noted in the literature focusing on CAPM, the market itself can be viewed as the primer and most significant equity factor. Besides the market factor, academics generally look for persistent factors over time with solid explanatory power over a wide variety of equities. However, many factors can’t be observed directly, and criteria on how to define them vary. Yet, everyone can agree on the three main categories in which we distinguish factors. To this day, the three main categories are: macroeconomic, statistical, and fundamental. Macroeconomic factors include surprises in inflation, surprises in GNP, surprises in the yield curve, and other measures of the overall economy. Statistical factor models identify factors using statistical techniques. Fundamental, capture stock characteristics such as industry membership, country membership, valuation ratios, and much more.
As a part of risk factor modelling, the most prevalent factors represent value, size, momentum, and growth. One of the most common models is the Fama and French Three-factor model (1992). The model was developed as an expenditure of the CAPM by adding size risk factor (large vs small-capitalization stocks) and value risk factor (low vs high book to market) to the market risk factor used in CAPM. This model considers the fact that, on average, value and small-cap stocks outperform. The model accounts for this outperforming tendency by incorporating these two additional characteristics, which is considered a more robust tool for explaining the cross-section of stock returns. As the financial literature was evolving, other factors were recognized and utilized in asset pricing models. For example, momentum – a widely recognized factor was utilized in Carhart’s model (1997). Also, the original Fama French Three-factor model (1992) was augmented with another two factors – profitability and investments to better explain the variation in stock returns. However, not every widely popular investing style and corresponding factor/factors are utilized in the asset pricing models.
Foundations of Factor Investing
In recent years, the focus shifted to a broader range of factors. Consequently, not only value, momentum, and size are being recognized as the most popular, but also factors such as quality, volatility or other risk measures became the most studied and researched factors in the academic, financial world. In the table below, we can see their main characteristics and measurements.
|
Factor |
Definition |
Measures |
|
Value |
Captures excess returns from equities with low prices compared to their fundamental value. |
Book to price, earnings to price, book value, sales, earnings, cash earnings, net profit, dividends, cash flow |
|
Momentum |
Reflects excess returns to stocks with stronger past performance. |
Relative returns |
|
Size |
Large vs small-capitalization stocks. |
The market capitalization of a stock |
|
Quality |
Captures excess returns to stocks that are characterized by low debt, stable earnings growth, and other “quality” metrics. |
ROE, ROA, earnings stability, growth, the strength of balance sheet, accruals, cash flows |
|
Volatility |
Captures excess returns to stocks with lower than average volatility, beta, and/or idiosyncratic risk. |
Standard deviation, the standard deviation of idiosyncratic returns, beta |
|
Dividend Yield |
Captures excess returns to stocks that have higher-than-average dividend yields. |
Dividend yield |
Quality – the most challenging factor to define
Quality has its roots in fundamental analysis (Graham, 2006), but recently, it has become popular as a systematic investment style. The Quality factor aims to capture the excess return of “high quality” companies vs junk companies. In theory, high quality (profitable, stable…) firms should perform reasonably well even during stressful periods in the market. This notion is supported by several papers such as Cook et al. (2017) or Lepetit et al. (2021). Hence the quality investing style is popular among practitioners.
On the other hand, from the theoretical point of view, the quality factor is perhaps the hardest to define as there is no consensus on the best way to measure it. Therefore it is one of the most discussed and controversial of all. Moreover, the quality of companies is a highly subjective matter. So how do we define a company’s quality? Quality companies need to have the financial strength to invest for the long term and have higher profitability with a record of stable business performance over a certain period. Furthermore, the best-performing companies have a good record of returning cash flows to their shareholders.
Although the quality definition can vary, the factor in stocks is well-examined in the literature.
The critical question of this research is to examine whether the factor could also be found in the aggregated groups of similar stocks such as industries or sectors. Similar questions puzzled academics in various anomalies and factors, for example, in momentum. While initially, the momentum was found in the individual stocks, researchers have also identified the momentum in industries or sectors.
The research examines the quality factor in the sectors. Additionally, instead of constructing a comprehensive quality metric like other papers, we examine the individual ratios aggregated to the whole sector. The aim is to investigate the fundamental ratios on which quality is based rather than the composite quality score of sectors. As a result, the research is mostly related to examining the individual building blocks of quality investing in sectors and leaves the construction of composite quality strategy (and non-fundamental quality metrics) for further research.
We define a quality stock through ratios based on the following three key characteristics:
Profitability – the main focus is on rates of returns such as return on equity (ROE) and return on assets (ROA), and for comparison, we also take ROE and ROA into account over the last five years. Next, we also analyze the net income ratio, gross profit, and for comparison, gross profit over the previous five years.
Financial strength – Even though the debt is not always indicating a low-quality stock and some debt may be good, it is essential to distinguish between companies expanding via excessive financial leverage. Companies with modest leverage and ample ability to service that debt are more likely to be masters of their destiny. Consequently, quality companies have more opportunities to invest. Long-term debt to assets is a common quality factor that determines financial strength. We also examine the total money market investments ratio and payout ratio.
Stability – Profitability is a significant driver of relative stock returns over time that can be enhanced by focusing upon companies with more stable fundamentals. Analysis of the growth of different aspects is needed to determine the stability of a company. More specifically, we focus on the growth rate, assets growth, and net income growth. For example, it is expected that firms that invest too aggressively underperform firms with more conservative investments.
Definitions of ratios used in the quality stock analysis:
Gross profit is the most fundamental value that reflects what the company does, defined as the Total Revenue – Cost of Revenue. Particularly, what does the company receive for its goods, and what is the cost spent on its production. Companies with a high gross profit ratio have opportunities to make wise decisions on how they want to allocate their capital. Moreover, if a company has a low gross profit ratio, it indicates a low probability of success in the future. Gross profit is null if the cost of revenue is not given. However, the gross profit should be standardized because the standalone value might not be comparable. The Gross Profits to Assets ratio is a common profitability factor (Novy-Marx, 2013) used to assess how well a company utilizes its assets to produce profits. It is calculated as Gross Profits divided by the Total Assets of the company.
Gross profit over the last five years is the annual growth rate of the company’s gross profit over the previous five years.
Return on equity (ROE) is defined as net income divided by average total common equity.
ROE over the last five years is simply the average of the company’s ROE over the previous five years. Return on equity reveals how much profit a company has earned compared to the total amount of shareholders equity found on the balance sheet.
Return on assets (ROA) is calculated by dividing its annual earnings by its average total assets.
ROA over the last five years is again an average of the company’s ROA over the last five years.
Sustainable Growth rate represents the maximal growth rate of a company without additional equity or debt. In our case, the ratio is computed as ROE * (1 – Payout Ratio).
Assets growth is represented as the growth in the total assets on a percentage basis.
The payout ratio is a proportion of a company’s net income that gets distributed to shareholders through regular dividends.
Net income growth rate measures the percentage change – increase or decrease, in net income from one period to the next. It measures the company’s efficiency from an operational point and desirability from an investment point; however, it’s heavily influenced by a company’s goals and challenges.
Total money market investments are the sum of the money market investments held by a bank’s depositors, which are FDIC insured.
Net income is computed as a difference between sales and the cost of goods sold. More specifically, it tells how much revenue exceeds an organization’s expenses and indicates a company’s profitability.
The debt-to-equity ratio is determined by dividing a company’s total liabilities by its shareholder equity to assess its financial leverage.
Data
The daily data, both price and fundamental, for US stocks were obtained from QuantConnect. Morningstar sources the fundamental data in Quantconnect’s database. The dataset is filtered to exclude all stocks with prices below 1$. The backtesting sample spans from January 2005 to August 2021.
Strategy
To begin with, we performed tests for chosen ratios for every sector. After sorting stocks into sectors, we construct the quality measure as the value-weighted quality of stocks that are in the particular sector. Secondly, we find the two sectors with the highest (lowest) quality metrics. The quality measures are tested on two samples. Firstly, for a large-cap sample represented by the top 500 market cap stocks. For comparison, we selected the top 3000 stocks approximately matching the Russel 3000 index, which is broader and includes smaller stocks. Quality sectors through ratios are based on three key characteristics: profitability, financial strength and stability. The examination always utilizes the long-short factor approach, and it goes long two sectors with the highest (lowest) value of the metric and short two sectors with the lowest (highest) values denoted by the abbreviation H-L (L-H).
Ratios
This section will focus on more diversified stocks, approximately matching the Russel 3000 index, which also includes smaller stocks.
Positive yearly performance
Our analysis shows that the Sustainable Growth rate has the highest yearly performance of 6.754%, the most profitable ratio in our research.
After performing tests, we observed that sectors with higher ROE are performing better than sectors with low ROE. In table 1 we can see that the yearly performance of ROE reached 2.204%, which is the fourth-highest among all analyzed ratios with the smallest max drawdown of 30.6%. ROE measures a company’s profitability against the profit it retains and other outside investments. If we look at ROE from a long-term point of view, particularly through ROE over the last five years ratio, we can see that the yearly performance is almost the same: 2.208%. To sum it up, the ROE ratio is one of the most reliable ratios to identify promising quality companies/sectors.
Return on assets (ROA) offers a different point of view of companies’ management effectiveness and reveals how much profit a company earns for every dollar of its assets. The biggest difference between ROE and ROA is financial leverage or debt, as assets are compounds of liabilities and shareholders’ equity. After performing tests, we observed that ROA has a yearly performance of 1.304%. However, looking at figures for the ROA over the five years ratio, we can see that the annual performance slightly increased to 4.732% and is the second-highest value. To sum the observations above, widely recognized ROA as a quality metric also plays a significant role in measuring the quality of sectors.
The positive yearly performance can also be found in the total money market investments with a performance of 1.606%.
Asset growth is widely recognized as a negative stock predictor, suggesting that firms that invest too aggressively underperform more conservative firms. It seems that this metric could also be expanded into sectors, as it has a yearly performance percentage of 1.221%.
Also, the debt-to-equity ratio – a standard safety quality metric performs positively with a yearly performance of 0.799%.
Lastly, looking at the net income growth, the yearly performance is close to zero, 0.434%.
Negative yearly performance
Inspecting the ratios that performed poorly in the sectors, it is interesting to find the Gross profit to Total assets among them since it is a well-established profitability ratio in individual stocks. However, with a performance of -7.536% and 86.3% maximal drawdown, it is clear that this metric does not work in sectors.
Negative performance is also connected with the Payout ratio (-0.464) and Net income (-2.495).
The top 500 market cap
This section will focus on less diversified stocks, approximately matching the top 500 market cap stocks.
In table 1, we can see figures where tests were performed on two sectors and top 500 market cap stocks. As we can see, the ROE ratio is the best performing one with a yearly performance of 3.208%. The second-best performing ratio in our analyses is the Sustainable Growth rate ratio with 3.057% and consequently assets growth with 2.323% and ROA over the last five years period with 2.277%. The total market money investment and ROE over the previous five years have also shown positive yearly performance, reaching 1,638% and 1,626%. Net income growth and payout ratio have yearly performance less than one, but the performance is still on a positive side. These ratios mentioned above are possible indicators for quality factors in sectors with positive performance throughout the sample. On the other hand, several metrics are connected with negative performance: net income, debt-to-equity, ROA, and gross profit to total assets ratio performed relatively poorly, with a negative yearly performance of -4.912%, -1,3%, -1.040%, and -0.86%.
The results are summarized in Tables 1 and 2, and we also provide two equity curves as a visual representation of strategies.
|
Ratio |
Yearly performance |
Volatility |
Sharpe ratio |
Max drawdown |
|
|
ROE |
3.889 |
0.118 |
0.331 |
46.9 |
(H-L) |
|
Growth rate |
3.057 |
0.129 |
0.261 |
34.8 |
(H-L) |
|
Assets growth |
2.323 |
0.114 |
0.225 |
39.4 |
(L-H) |
|
ROA over the last 5 years |
2.277 |
0.127 |
0.212 |
41.7 |
(H-L) |
|
Total market money investment |
1.638 |
0.175 |
0.166 |
42.8 |
(H-L) |
|
ROE over the last 5 years |
1.626 |
0.125 |
0.171 |
33.3 |
(H-L) |
|
Payout ratio |
0.511 |
0.128 |
0.097 |
36.3 |
(H-L) |
|
Net income growth |
0.164 |
0.109 |
0.067 |
36.3 |
(H-L) |
|
Gross profit to Total assets |
-0.86 |
0.119 |
0 |
33.3 |
(H-L) |
|
ROA |
-1.04 |
0.16 |
0.026 |
55.1 |
(H-L) |
|
Debt-to-equity |
-1.3 |
0.124 |
-0.024 |
56.9 |
(L-H) |
|
Net income |
-4.912 |
0.105 |
-0.338 |
65.6 |
(H-L) |
Table 2, 2 sectors, top 3000 market stocks *
|
Ratio |
Yearly performance |
Volatility |
Sharpe ratio |
Max drawdown |
|
|
Growth rate |
6.754 |
0.109 |
0.564 |
29 |
(H-L) |
|
ROA over the last 5 years |
4.732 |
0.097 |
0.449 |
34.5 |
(H-L) |
|
ROE over the last 5 years |
2.208 |
0.105 |
0.226 |
36.4 |
(H-L) |
|
ROE |
2.204 |
0.109 |
0.222 |
30.6 |
(H-L) |
|
Total market money investment |
1.606 |
0.175 |
0.165 |
42.8 |
(H-L) |
|
ROA |
1.304 |
0.126 |
0.149 |
42.9 |
(H-L) |
|
Assets growth |
1.221 |
0.094 |
0.154 |
31.2 |
(L-H) |
|
Debt-to-equity |
0.799 |
0.088 |
0.119 |
41.7 |
(L-H) |
|
Net income growth |
0.434 |
0.07 |
0.086 |
34.6 |
(H-L) |
|
Payout ratio |
-0.464 |
0.11 |
0.02 |
41.6 |
(H-L) |
|
Net income |
-2.495 |
0.083 |
-0.206 |
57.8 |
(H-L) |
|
Gross profit to Total assets |
-7.536 |
0.31 |
-0.051 |
86.3 |
(H-L) |
* Yearly performance and maximum drawdown values are in percentage
Figure 1: Equity curve for Growth rate based on 3000 stocks

Figure 2: Equity curve for ROE based on 500 stocks
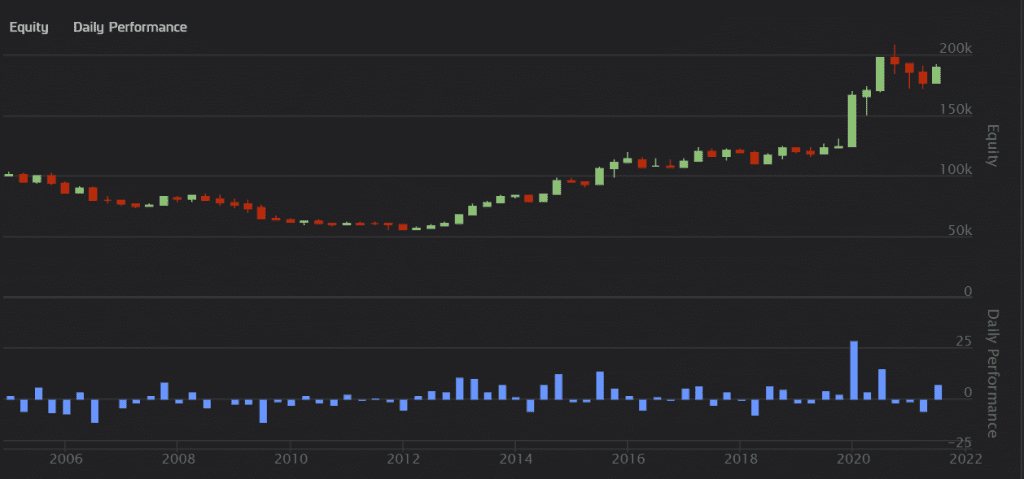
Short conclusion
The quality factor is not universally defined and has been far less researched than other foundation factors. Companies with high-quality factors tend to have high ROE, Sustainable Growth rate, stable earnings, and strong balance sheets with low financial leverage. The examination of the metrics commonly attributed as building blocks of stock quality factors in sectors clearly shows that it might not be as simple as, for example, in momentum, where sector momentum is a strong anomaly. Looking at sectors in two samples (top 500 and 3000 stocks), Growth rate, ROA, ROE, and long-term versions seem to be among the top quality performers in sectors. Several metrics have lower positive performance, but they could perhaps complement the more performing factors as it is common in composite quality factors in stocks. There are also several negative performing quality metrics in sectors, but in this regard, the Gross profit to Total assets is the most shocking one. Although it is a common and widely accepted profitability ratio in stocks, the underlying logic does not seem to hold in sectors.
Author: Paula Tekulova
Are you looking for more strategies to read about? Sign up for our newsletter or visit our Blog or Screener.
Do you want to learn more about Quantpedia Premium service? Check how Quantpedia works, our mission and Premium pricing offer.
Do you want to learn more about Quantpedia Pro service? Check its description, watch videos, review reporting capabilities and visit our pricing offer.
Are you looking for historical data or backtesting platforms? Check our list of Algo Trading Discounts.
Or follow us on:
Facebook Group, Facebook Page, Twitter, Linkedin, Medium or Youtube
Sources
Norges bank investment management: The quality factor (2 December, 2015). Available at: https://www.nbim.no/contentassets/0660d8c611f94980ab0d33930cb2534e/nbim_discussionnotes_3-15.pdf
Larry Swedroe: The quality factor- What exactly it is? (22 October ,2019). Available at: https://alphaarchitect.com/2019/10/22/the-quality-factor-what-exactly-is-it/
MSCI: Factor investing (April, 2017). Available at: https://www.msci.com/documents/1296102/1339060/Factor+Factsheets+Quality.pdf/6fc7e7d6-6719-4f95-9fee-c52fdaf72ca2
MSCI: Focus: Quality (December, 2020). Available at: https://www.msci.com/documents/1296102/8473352/Quality-brochure.pdf
James Chen: Factor investing (26 October 2020). Available at: https://www.investopedia.com/terms/f/factor-investing.asp
Cooper, Gulen, Schill: The Asset Growth Effect in Stock Returns (Januar 31, 2009). Available at SSRN: http://papers.ssrn.com/sol3/papers.cfm?abstract_id=1335524
Lepetit, Frederic and Cherief, Amina and Ly, Yannick and Sekine, Takaya, Revisiting Quality Investing (June 30, 2021). Available at SSRN: https://ssrn.com/abstract=3877161 or http://dx.doi.org/10.2139/ssrn.3877161
Rizova, Savina and Saito, Namiko, Investment and Expected Stock Returns (July 8, 2020). Available at SSRN: https://ssrn.com/abstract=3646575 or http://dx.doi.org/10.2139/ssrn.3646575
Cook, Michael and Hoyle, Edward and Sargaison, Matthew and Taylor, Dan and van Hemert, Otto, The Best Strategies for the Worst Crises (June 15, 2017). Available at SSRN: https://ssrn.com/abstract=2986753 or http://dx.doi.org/10.2139/ssrn.2986753
Novy-Marx, Robert, (2013), The other side of value: The gross profitability premium, Journal of Financial Economics, 108, issue 1, p. 1-28.
Share onLinkedInTwitterFacebookRefer to a friend


