Quantpedia API as an On-Demand Factor Database
Investors often face a simple but important problem. They receive a fund equity curve, a strategy track record, or a portfolio performance series, but they do not know what is actually inside. The manager may provide only a broad description, while the realized return stream may in practice be driven by a mix of momentum, tactical allocation, defensive overlays, cross-asset rotation, or other systematic effects.
One way to approach this type of problem is to use a specialized Multi-Factor Analysis report available in Quantpedia Pro. However, this case study focuses on the second approach: building a custom workflow through the Quantpedia API and AI-assisted methodology design. Instead of treating Quantpedia only as a static library of strategy ideas, the workflow uses it as an on-demand database of factor-like return streams. The unknown curve becomes the object to explain, while the Quantpedia strategy universe becomes the set of candidate explanatory building blocks.
In this test, the unknown equity curve was treated as a blind case. The “correct” answer was not used during the analysis. The task was therefore not to confirm a known decomposition, but to test whether an API-based workflow can identify which known systematic strategies best explain the behavior of a black-box curve.
The Unknown Equity Curve
The starting point was the unknown equity curve itself. Before any matching or decomposition was attempted, the curve was plotted and visually inspected. The profile showed a long-term upward path from 2004 to 2026, with several periods of slower growth, temporary drawdowns, and renewed acceleration. On its own, however, the chart did not reveal whether the return stream came from one strategy or from a blend of several components.
That is precisely why this is a useful case study. In many real due diligence situations, the investor does not have holdings-level transparency. The only thing available is the realized equity curve. The analytical task is then to compare that curve against a structured library of known strategies and determine which exposures are most likely driving the observed performance.

What We Tested
The workflow was built around a simple research question: can the unknown equity curve be explained by one or more Quantpedia strategies retrieved through the API?
The script loaded the unknown curve, normalized it, aligned its dates with available Quantpedia performance series, and compared it against the strategy universe. The comparison was done on daily data, using correlation, R², RMSE, and cumulative equity similarity. In addition to testing individual strategies one by one, the script also attempted a linear combination of top candidates to check whether the unknown curve behaves more like a blend than like a single standalone strategy.
The API test confirmed that the workflow is operational. The Quantpedia catalog contained 1,284 strategies, out of which 545 had downloadable performance data available for this account. That means approximately 42% of the catalog could be used directly in the test.
This result is important because it shows both the strength and the practical limitation of the approach. The method itself works, but its explanatory power depends on the breadth of the accessible return database. Even so, a universe of 545 strategy curves is already large enough to make Quantpedia function as a meaningful factor database for black-box return analysis.

Quantpedia as a Factor Database on Demand
The main value of this workflow is conceptual. Quantpedia is not being used here merely as a research website or strategy encyclopedia. Through the API, it becomes a programmable library of investment return streams. Each available strategy curve can be treated as a candidate alpha, factor proxy, or explanatory sleeve.
That changes the nature of the research process. Instead of manually scanning hundreds of strategy pages and visually comparing charts, the analyst can work with the strategy universe as structured data. The unknown fund curve becomes the dependent variable. Quantpedia strategy return streams become candidate explanatory variables. AI or scripting then helps design the methodology, retrieve the curves, align the data, rank the candidates, and interpret the outcome.
This is exactly what is meant by factor database on demand. The user does not need a predefined benchmark set. They can turn the Quantpedia strategy universe into a custom explanatory library and ask which parts of that library best describe the unknown curve.
Top Single-Strategy Matches
The first pass of the analysis focused on single-strategy matching. Each available Quantpedia strategy was compared individually with the unknown curve in order to identify the closest standalone candidates.
The best single-strategy match in the full corpus was Defense First – Multi-Asset Tactical Model (#1192), which achieved a return correlation of 0.615 and an R² of 0.378. Other strong candidates included Bitcoin ETFs in Multi-Asset Portfolios (#1203), Time Series Momentum Effect (#0118), Gold-Treasury Momentum Strategy (#1235), Adaptive Asset Allocation v.2 (#0851), Refining ETF Asset Momentum Strategy (#1090), and Asset Class Trend-Following (#0001).
This first ranking already says a lot. The unknown curve does not appear to be a very close match to any single strategy. The best standalone R² is below 0.40, which is far from a precise one-to-one explanation. At the same time, the identity of the top candidates is highly informative. The list points consistently toward multi-asset tactical allocation, momentum, trend-following, gold-treasury rotation, and adaptive allocation models.
One candidate also deserves caution. Bitcoin ETFs in Multi-Asset Portfolios (#1203) shows strong correlation, but only over a shorter overlap period. That makes it less convincing as a full-period explanation and highlights the need to control for overlap length in a production implementation.

Interpreting the Unknown Curve
The most important interpretive step came after the single-strategy screen. The evidence suggested that the unknown curve does not fit one strategy with high precision. Instead, it appears to reflect a broader profile that combines several recognizable systematic styles.
Without peeking at the hidden answer, the analysis points most strongly toward a mix of trend-following and time-series momentum, gold plus treasury rotation, adaptive asset allocation models, and defensive or tactical allocation frameworks. In other words, the unknown curve behaves less like a narrow single-rule strategy and more like a diversified systematic portfolio.
This interpretation becomes even stronger once multi-strategy blending is introduced. A linear combination of eight strategies with full overlap achieved an R² of approximately 0.85. That is a materially stronger fit than any individual strategy and strongly suggests that the unknown curve is best understood as a blend or portfolio rather than as a single strategy.
The top contributors to that blend were Time Series Momentum Effect (#0118) with a weight of 26%, Value Factor (#0026) with 19%, Gold-Treasury Momentum Strategy (#1235) with 18%, Asset Class Trend-Following (#0001) with 11%, and Dual Momentum (#0846) with 8%. This blend is fully consistent with the earlier intuition from the single-strategy results: the black-box curve appears to combine tactical, momentum, and defensive allocation characteristics.

What the Case Study Shows
This case study demonstrates that the methodology works in a practical setting. The workflow can download available strategy curves, align them with an unknown equity stream, rank the closest candidates, and test whether a blend of known strategies provides a stronger explanation than a single strategy.
That is a meaningful result for due diligence and portfolio diagnostics. In many real-world cases, the investor does not need a perfect reverse-engineering of exact holdings. What they need is a robust approximation of the underlying style exposures. If a supposedly unique fund behaves like a combination of time-series momentum, dual momentum, value, and gold-treasury rotation, that already tells the investor a great deal about what they are really buying.
Just as importantly, the case study shows how AI and API access complement one another. Quantpedia provides the structured strategy universe. The API provides systematic access to return streams. The analytical script provides the research engine. AI helps define the methodology and automate the process. Together, these components turn the strategy database into a practical tool for black-box curve decomposition.
Files and Reproducibility
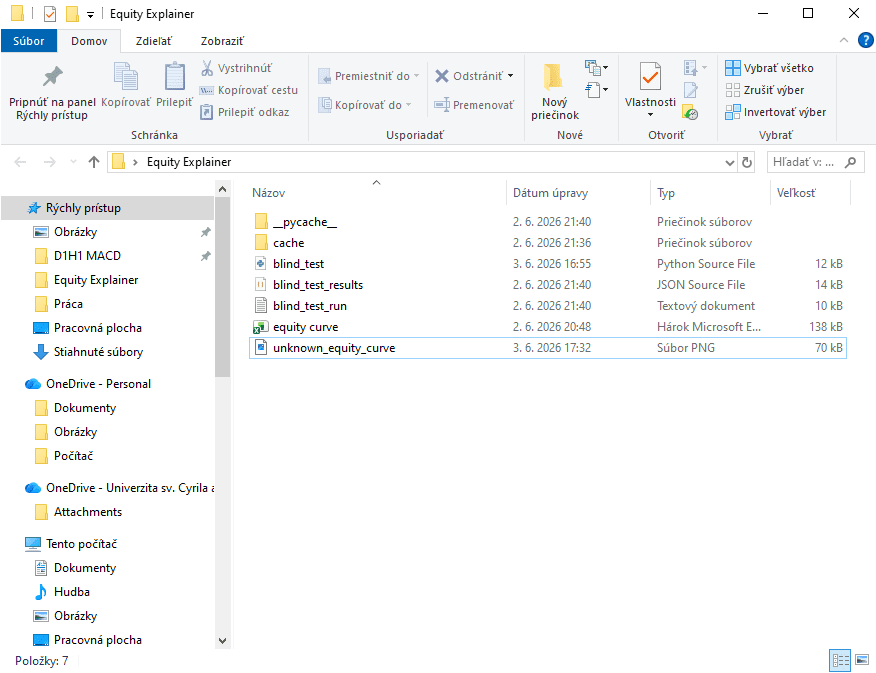
The research was implemented as a simple reproducible workflow. The main script handled the full analysis, the results were saved into a structured output file, and the downloaded performance series were cached locally so that the test could be rerun without repeating every API call.
This matters because the use case is not only conceptual. It is operational. Once the workflow exists, it can be reused for any new unknown curve. A client can provide a different equity series, the script can rerun the same process, and the output can again identify which Quantpedia strategies or strategy families provide the best explanation.
Conclusion
The blind test supports the main thesis of this article. Quantpedia API can be used as an on-demand factor database.
The unknown equity curve was not explained well by any single strategy. The best standalone candidate reached an R² of only about 0.38, which suggests that the curve is not a simple one-strategy clone. However, the strategy matches clearly pointed toward a coherent style profile centered on tactical allocation, momentum, trend-following, and defensive cross-asset rotation. When these ideas were combined in a linear blend, the explanatory power increased substantially, with R² rising to approximately 0.85.
That is the real practical value. Quantpedia is not only a source of strategy ideas. Through the API, it becomes a structured library of return streams that can be queried, compared, and recombined as explanatory factors. In this sense, the platform functions as a factor database on demand. For fund diagnostics, strategy comparison, and black-box equity curve analysis, that is a highly practical and scalable research workflow.
For production use, the next logical improvements would be to penalize short overlap periods more explicitly, test regularized multi-component models such as LASSO or Ridge, and expand access to performance data so that a larger share of the strategy catalog can enter the explanatory universe. Even in its current form, however, the methodology already shows that Quantpedia API can help transform a black-box return stream into an interpretable, research-driven factor decomposition.
Author: David Mesicek, Junior Quant Analyst, Quantpedia
Are you looking for more strategies to read about? Sign up for our newsletter or visit our Blog or Screener.
Do you want to learn more about Quantpedia Premium service? Check how Quantpedia works, our mission and Premium pricing offer.
Do you want to learn more about Quantpedia Pro service? Check its description, watch videos, review reporting capabilities and visit our pricing offer.
Do you want algorithmic access to the full Quantpedia database via the API? Subscribe to Quantpedia Pro, ask for an API key, and explore the in/out-of-sample statistics, source academic papers, and code snippets — ideal for quantitative research, systematic trading workflows, and AI model training.
Are you looking for historical data or backtesting platforms? Check our list of Algo Trading Discounts.
Or follow us on:
Facebook Group, Facebook Page, Telegram, Twitter, Linkedin, Medium or Youtube
Share onLinkedInTwitterFacebookRefer to a friend