Robustness Testing of Country and Asset ETF Momentum Strategies
Introduction
The investment world witnessed a paradigm shift with the introduction of momentum strategies, a concept pioneered by Jagadeesh and Titman in their landmark 1993 study “Returns to Buying Winners and Selling Losers: Implications for Stock Market Efficiency”. Their groundbreaking approach, hinged on the concept of buying stocks with a strong past performance (over 3- to 12-month periods) and selling those with poor past performance, demonstrated the potential to generate significant positive returns. Challenging traditional market efficiency theories, they revealed that these profits were not solely due to systematic risk or delayed reactions to market factors. This in-depth analysis illuminated the influence of investor psychology, particularly the tendency to overreact to information, on market trends. This research not only introduced a novel investment strategy but also provided innovative methods for understanding market dynamics, thereby cementing the role of momentum strategies in modern asset management.
Evolution of Momentum Strategies
Initially, momentum strategies revolved primarily around stocks, as evaluated in the early 1990s by Jagadeesh and Titman’s research. For subsequent decades, researchers expanded their focus, exploring the long-term returns of these strategies across different asset classes, including futures. By the 2000s, a significant shift occurred with the advent of Exchange-Traded Funds (ETFs). ETFs, or Exchange-Traded Funds, are diversified investment vehicles that trade on stock exchanges, tracking indices, commodities, bonds, or asset collections, akin to index funds. These instruments, offering lower commission fees and a broader selection of assets, attracted considerable attention from the investment community. Meb Faber, in his insightful 2010 publication “Relative Strength Strategies for Investing,” showcased how risk-adjusted returns could be enhanced in U.S. equity sectors and global asset portfolios. Faber’s approach notably emphasized minimizing risk through strategic hedging and the integration of non-correlated asset classes.
Momentum Strategies: Performance and Challenges
The efficacy of momentum strategies, while robust until around 2010, began to show signs of waning in subsequent years. This observation raised questions about the sustainability and adaptability of these strategies in varying market cycles. The challenge thus shifted towards establishing a credible benchmark for long-only momentum strategies. An equally weighted portfolio of ETFs, from which the momentum strategy selects top performers, emerged as a potential benchmark. This shift in benchmarking paradigm is critical to understanding whether these strategies can sustainably generate alpha over this new standard.
Research Focus and Hypothesis
Central to this research is the exploration of how various factors/parameters—such as the ranking period, the selection quantity of assets, and the liquidity of ETFs—impact the performance of momentum strategies. Categorizing these strategies into two distinct types—country, and asset universe—allows for a nuanced analysis. The guiding hypothesis posits that strategic adjustments in these variables might significantly enhance the performance of momentum strategies. The aim is to uncover whether these refined strategies can deliver sustainable alpha in the complex and ever-evolving market landscape of the 2020s.
Methodological Approach
The research employs QuantConnect, an online Python coding environment, to conduct thorough backtesting. This choice of platform offers the advantage of access to high-quality, well-organized data. The QuantConnect code for the Momentum Algorithm is designed to operate on a universe of selected Exchange-Traded Funds (ETFs), which represent various segments of the market. Our goal is to test different variants of the benchmark Country Momentum and Asset Momentum strategies.
To better test the different strategy variants, we use the modified momentum strategy with a slightly different code from the codes available in Quantpedia’s Screener.
The Momentum Algorithm, as described in the QuantConnect code, operates under a set of defined trading rules and considers multiple variables to execute its strategy. We have multiple variables to modify for the strategy.
- Roc Period(rate of change period). The rate of change is calculated over a chosen period, equivalent to the number of months multiplied by 21 trading days, which indicates the strategy’s sensitivity to medium-term price movements. The default value is 12 months when we change other variables.
- Symbol Count Variable. This variable determines the number of ETFs to hold in the long position. This number can be adjusted to control the diversification of the portfolio. We set it to default value of three ETFs hen we change other variables.
- Trading Fees: Can be modified to include or exclude transaction costs from the simulation, affecting the net return of the strategy.
- Long and Short Universes: The strategy currently considers the same universe for potential long and short positions. The short portfolio works as benchmark against the long momentum strategy and therefore our analysis shows “alpha” – the outperformance of the momentum strategy against its natural benchmark. The short and long legs of our portfolios are changed in different robustness tests.
Here are the initial rules for our strategy to work:
- Rebalancing Schedule: The algorithm is programmed to rebalance its portfolio on a monthly basis, which involves liquidating existing positions and entering new ones based on the updated momentum rankings.
- Selected Symbol Count: The top three ETFs, as determined by their rate of change (ROC) over a rolling period, are selected for long positions. If the ROC is not ready for at least three ETFs, indicating insufficient momentum data, the algorithm will liquidate all positions to avoid trading on incomplete information.
- Position Sizing: When entering new positions, the strategy evenly divides the portfolio’s total value among the selected ETFs, ensuring an equal weight approach that mitigates concentration risk.
- Fee Model: A custom fee model is employed, which, in this case, has been set to simulate a no-fee environment. This allows for the evaluation of the strategy’s performance without the impact of trading costs. To be noticed, in reality we need to deal with the trading cost problem.
The combination of these rules and variables creates a systematic approach to momentum investing, where decisions are driven by data rather than intuition. The algorithm’s design aims to capitalize on trends by dynamically adjusting the portfolio to concentrate on the strongest performers, as indicated by the ROC metric, while maintaining a disciplined structure to manage risk and execution costs.
Robustness Testing Results
What is Robustness Tests and its importance in strategies?
In our study, robustness testing was conducted to assess the resilience and consistency of the momentum strategy across various market conditions and parameters. This involved systematically altering key strategy variables, such as the number of selected ETFs, their liquidity or the length of the sorting periods, to evaluate their impact on strategy performance and reliability.
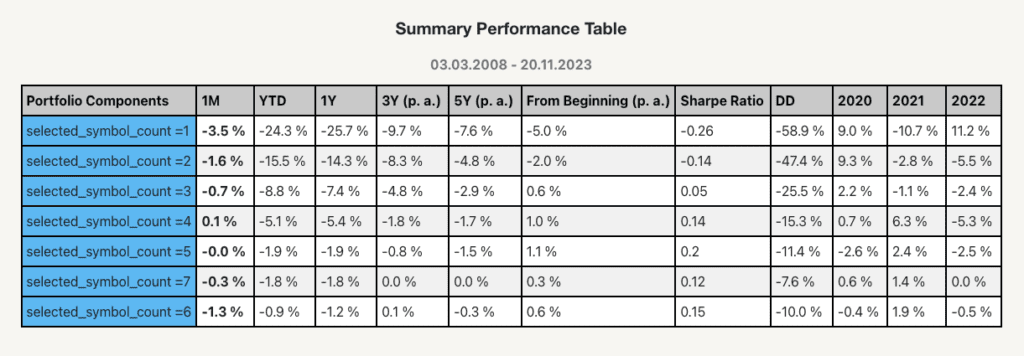
Tests Using the Highly Liquid Country ETFs
Our first battery of tests was done using the highly liquid country ETFs. Our goal was to assess the alpha of the momentum strategies (outperformance against their natural equally-weighted benchmark) and compare if there is a difference in the performance compared to strategies that use country ETFs with low liquidity. To ensure a diverse and representative analysis, we incorporated ETFs from key international markets such as Japan, China, Canada, and Brazil. We omitted the U.S. market for the same reason as stated in the article Analysis of Price-Based Quantitative Strategies for Country Valuation – the United States is around 50 % of the global market cap; therefore, it would make better sense to make a model that evaluates the U.S. vs. the rest of the world and not just include the U.S. market in the sample (and we already did that in our article Why Do US Stocks Outperform EM and EAFE Regions?).
| Ticker | Fullname |
| EWJ | iShares MSCI Japan ETF |
| FXI | iShares China Large-Cap ETF |
| EWC | iShares MSCI Canada ETF |
| EWZ | iShares MSCI Brazil ETF |
| EWU | iShares MSCI United Kingdom ETF |
| EWY | iShares MSCI South Korea ETF |
| EWT | iShares MSCI Taiwan ETF |
| EWA | iShares MSCI-Australia ETF |
| EWW | iShares MSCI Mexico ETF |
| EWL | iShares MSCI Switzerland ETF |
| EWQ | iShares MSCI France ETF |
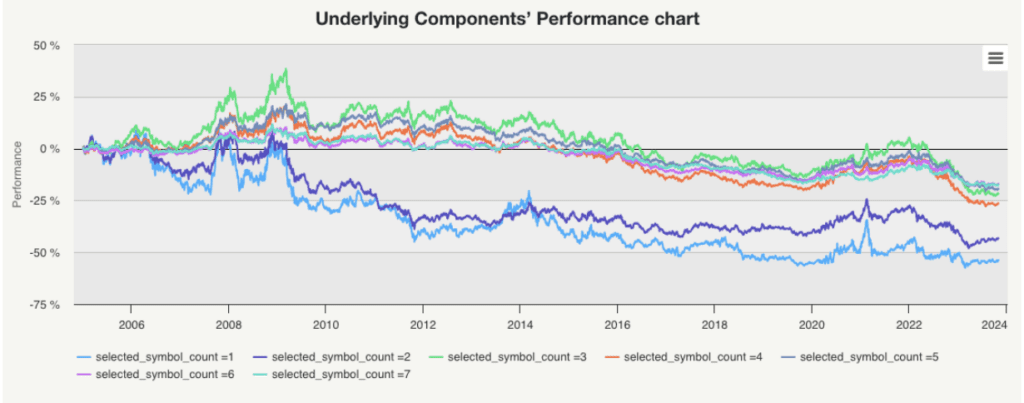
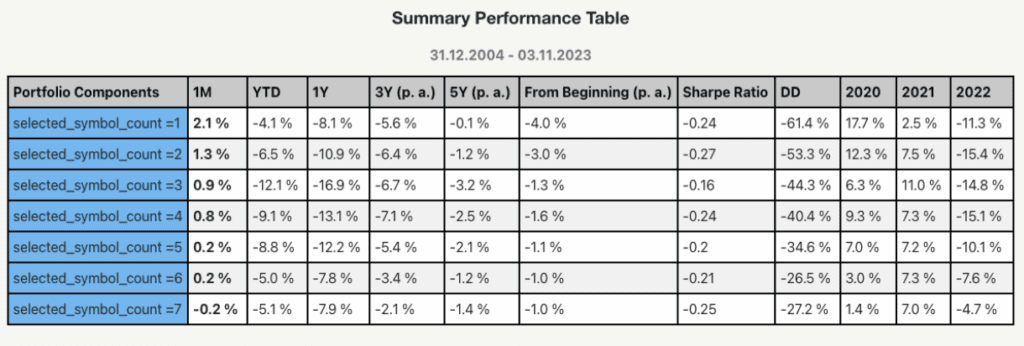
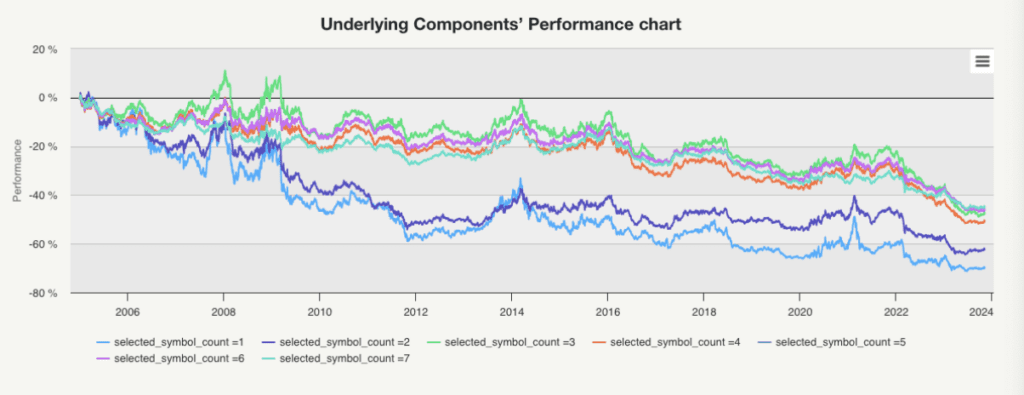
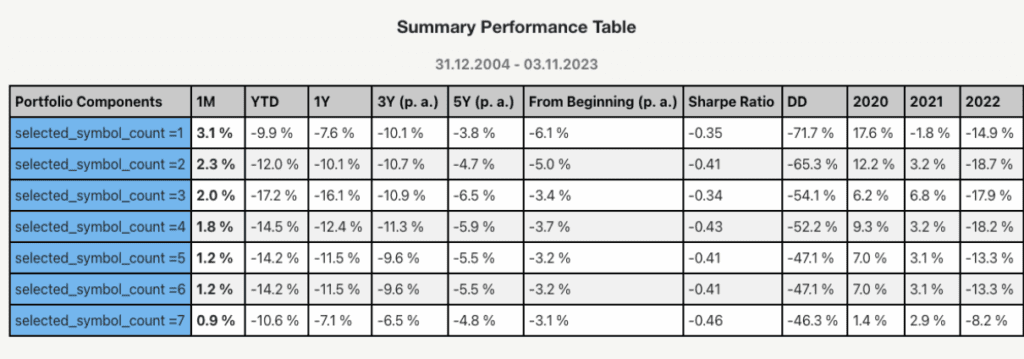
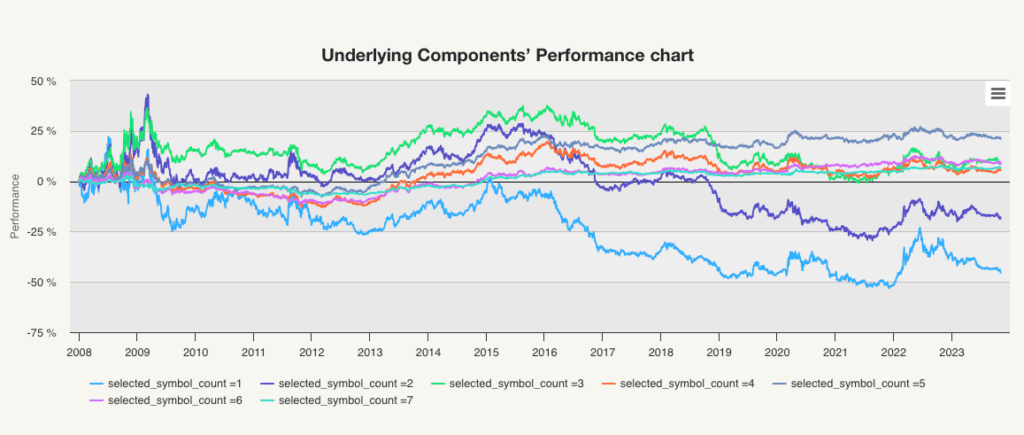
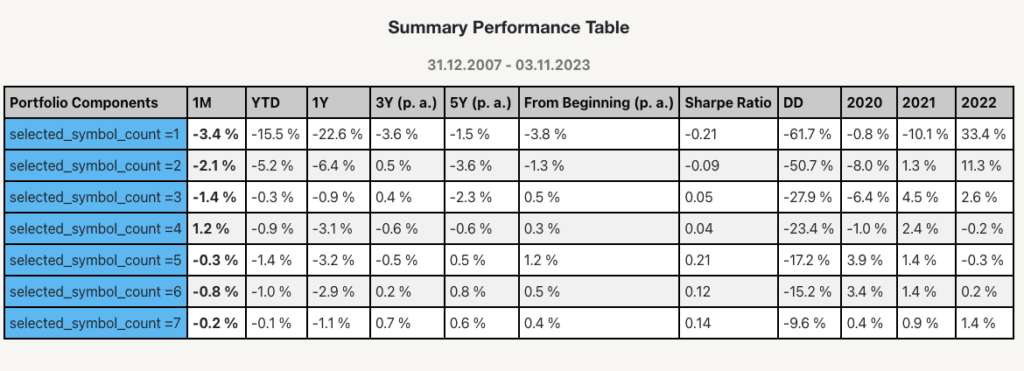
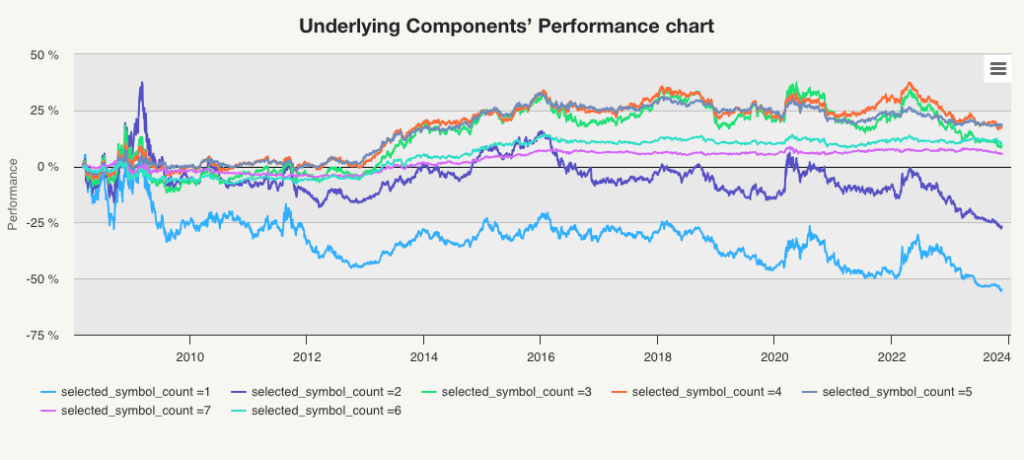
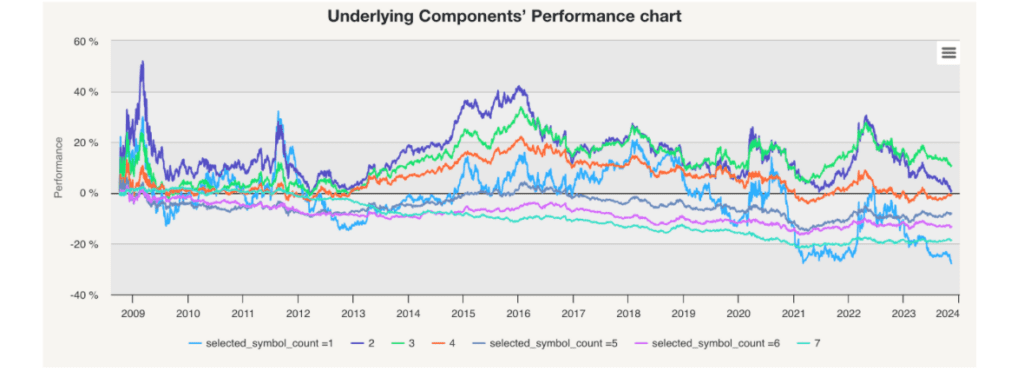
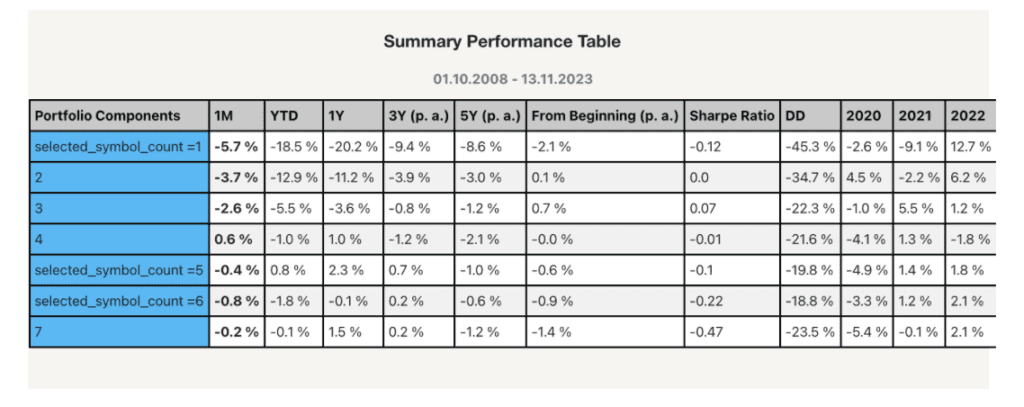
Effect of Varying Selected Symbols of Highly Liquid Country ETFs
This part of the study concentrated on altering the number of selected symbols in the momentum strategy. We experimented with portfolios comprising different numbers of ETFs, ranging from a single ETF to a maximum of seven (1, 2, 3, 4, 5, 6, 7 ETFs). This allowed us to observe the strategy’s performance across varying degrees of diversification.
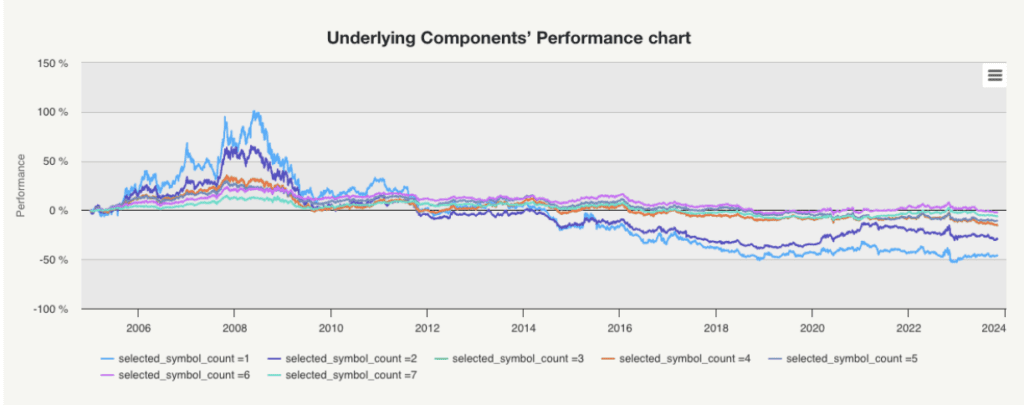
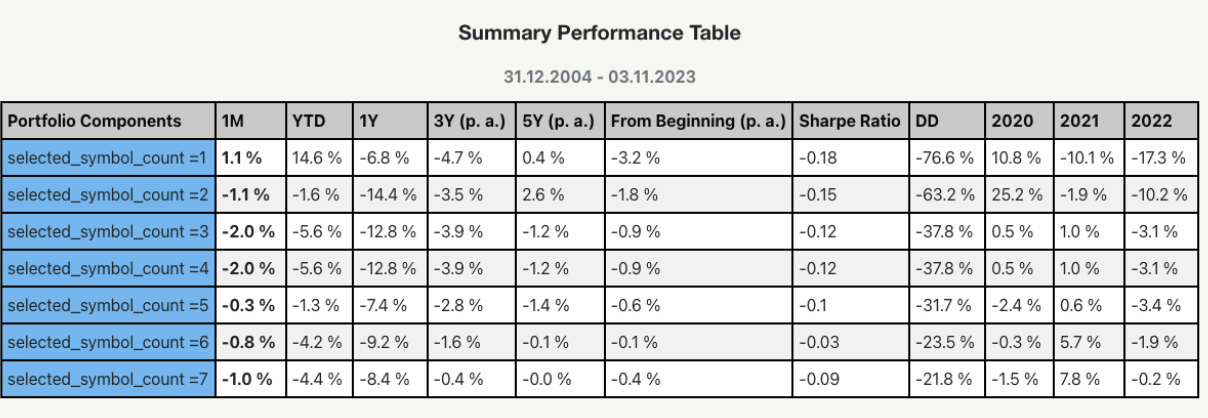
Performance Trends: The findings revealed that alphas of the momentum strategies built using the highly liquid country ETFs and shorting the benchmark equally weighted universe of constituent ETFs were positive until around 2008/2009. However, post-2008/2009, there was a marked underperformance across all variations in the number of selected symbols.
Alpha Generation: Despite the changes in the number of ETFs selected, the strategy did not consistently generate alpha after the 2008/2009 period, suggesting a decrease in the effectiveness of the momentum strategy in these high-liquidity markets.
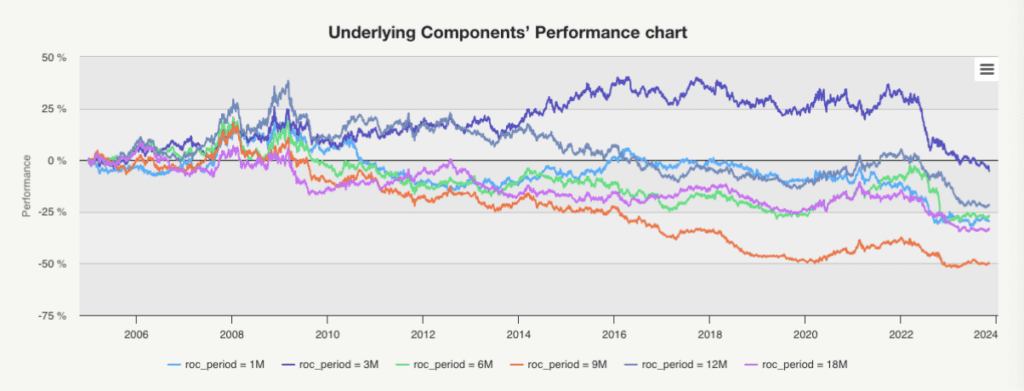
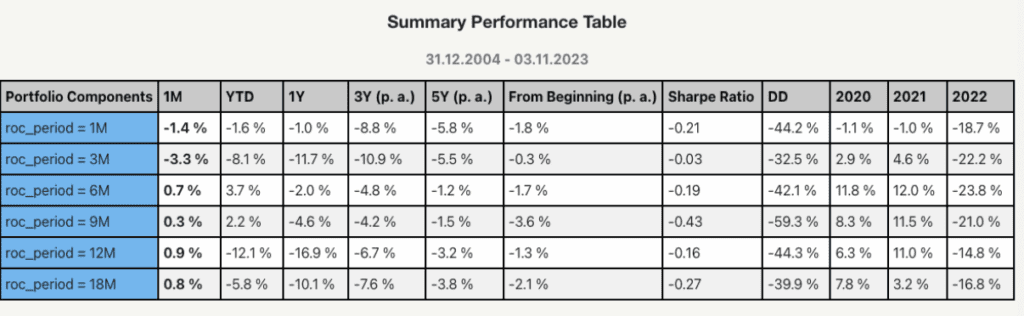
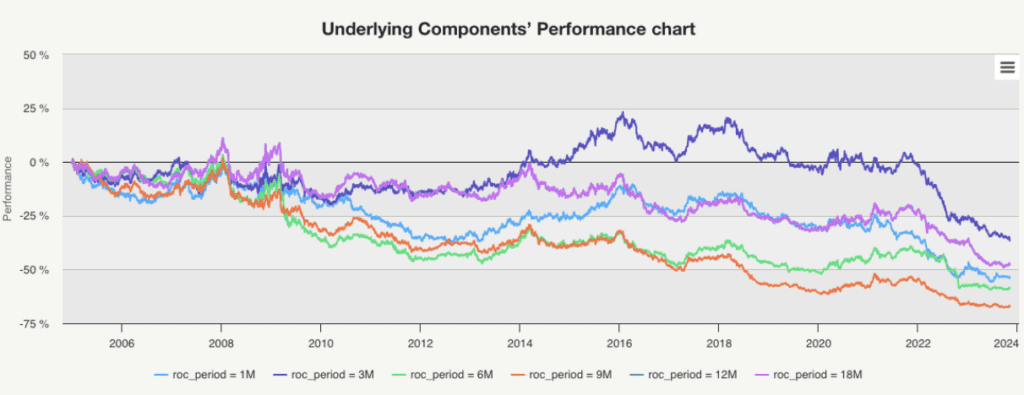
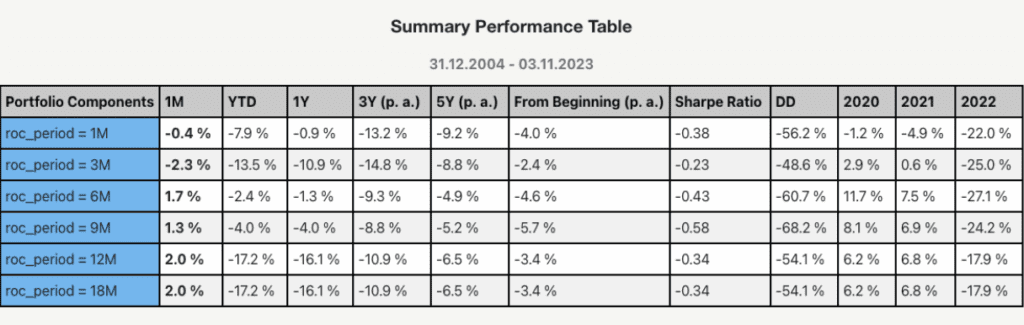
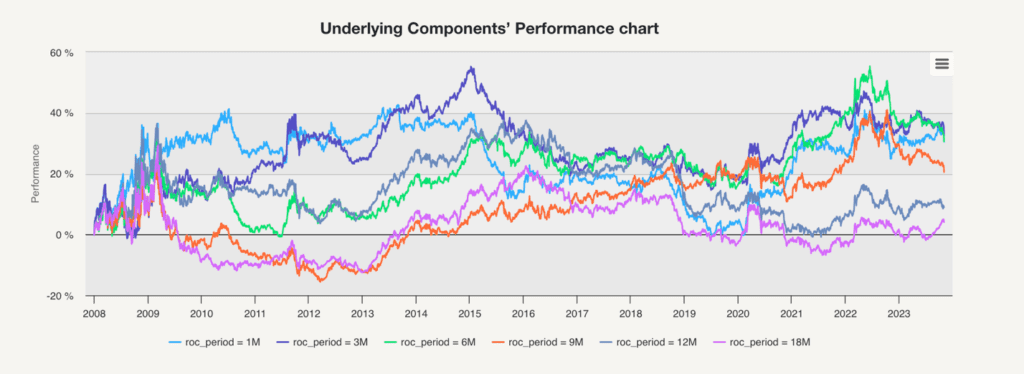
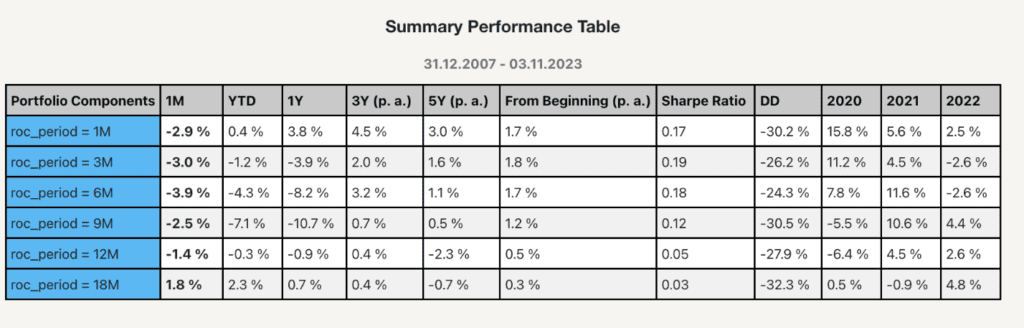
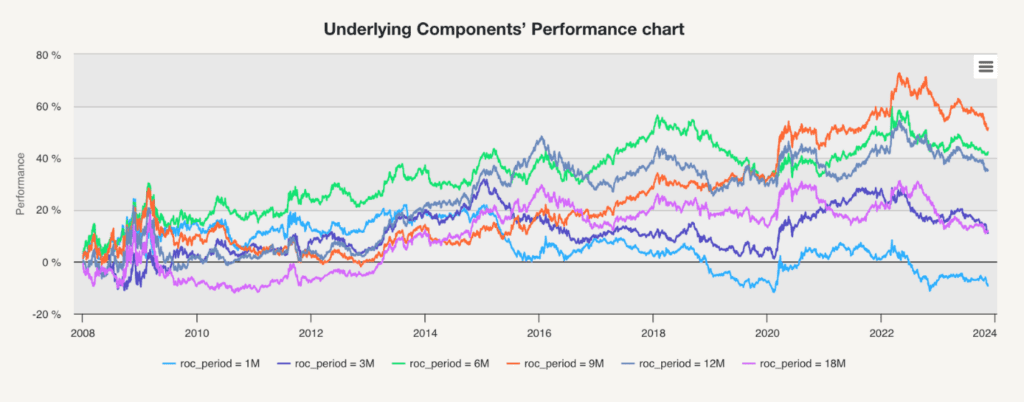
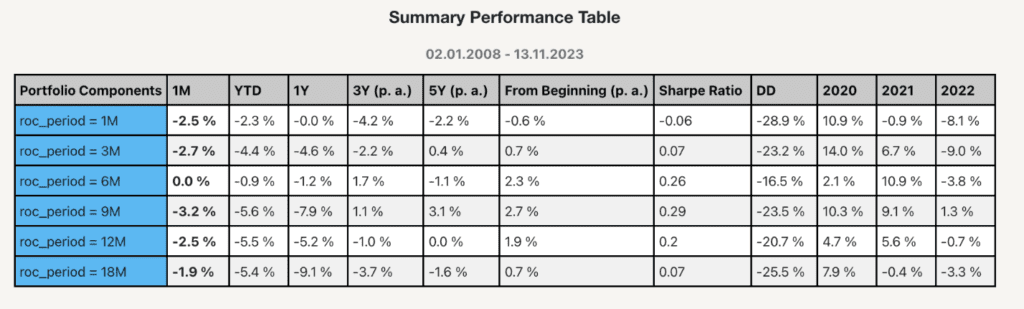
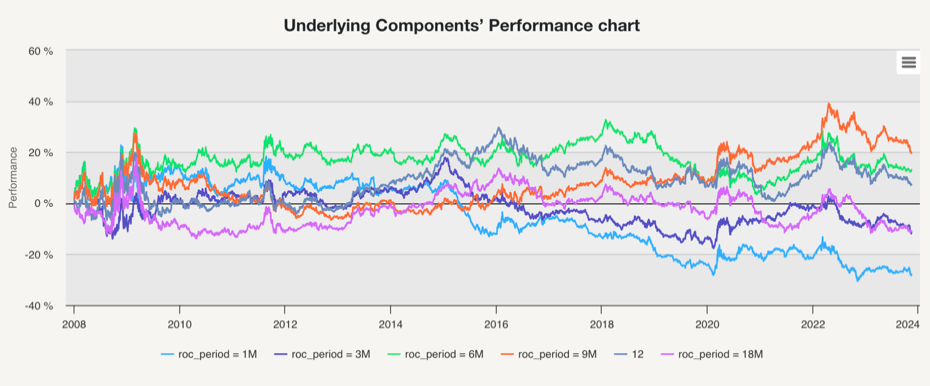
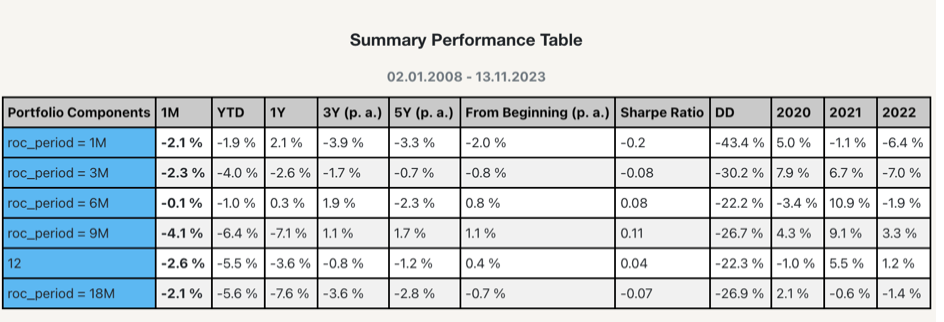
Effect of Varying Sorting Periods of Highly Liquid Country ETFs
Changing the Period Variable: In this analysis, we altered the sorting period for the momentum strategy, testing periods of 1 month (1M), 3 months (3M), 6 months (6M), 9 months (9M), 12 months (12M), and 18 months (18M). This allowed us to compare the effectiveness of faster versus slower signals in identifying momentum.
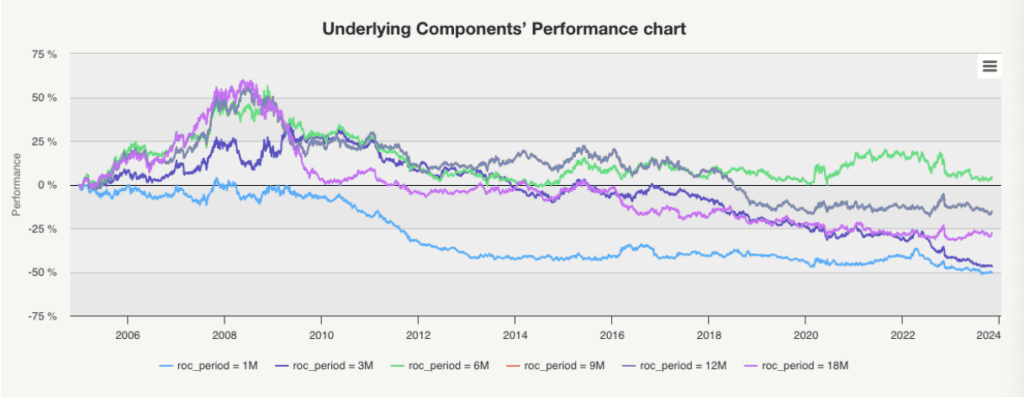
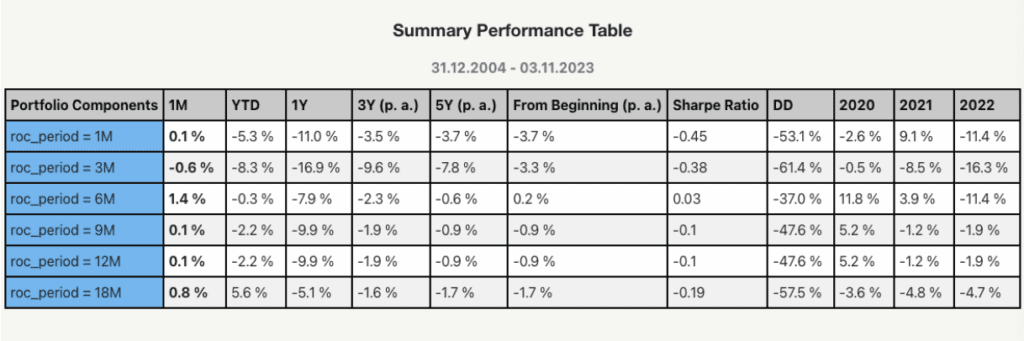
Performance and Alpha Trends: Similar to the first study, these ETFs initially displayed alpha generation until around 2008/2009. After this point, regardless of the length of the sorting period, the strategies consistently underperformed and failed to generate significant alpha.
The results from both studies suggest an obvious shift in the performance of momentum strategies applied to high-liquidity country ETFs in post-2008/2009. The lack of significant alpha after this period regardless of the variations in selected symbols or sorting periods indicates a potential change in market dynamics that has impacted the efficacy of these strategies.
Momentum Strategies Using Country ETFs with Low Liquidity
In our investigation into ETFs with low liquidity, we initially hypothesized that reduced liquidity might enhance the alpha generated by momentum strategies.
| Ticker | Fullname |
| JPXN | iShares JPX-Nikkei 400 ETF |
| PGJ | Invesco Golden Dragon China ETF |
| EWH | iShares MSCI Hong Kong ETF |
| EWS | iShares MSCI Singapore ETF |
| EWI | iShares MSCI Italy ETF |
| EWD | iShares MSCI Sweden ETF |
| EZA | iShares MSCI South Africa ETF |
| EWN | iShares MSCI Netherlands ETF |
| EWK | iShares MSCI Belgium ETF |
| EWM | iShares MSCI Malaysia ETF |
| EWO | iShares MSCI Austria ETF |
Effect of Varying Selected Symbols of Low Liquid Country ETFs
Changing the count_number variable: we varied the number of selected symbols for the momentum strategy, experimenting with 1, 2, 3, 4, 5, 6, and 7 ETFs. The objective was to observe how the concentration and diversification within low-liquidity ETFs affected the performance of the momentum strategy.
Performance and Alpha Trends: Contrary to our expectations, the results indicated that momentum strategies applied to low-liquidity ETFs underperformed even when compared to strategies using highly liquid ETFs. This was a surprising outcome, as lower liquidity is often thought to contribute to higher price inefficiencies, which momentum strategies could potentially exploit.
Effect of Varying Sorting Periods Low Liquid Country ETFs
Changing the Period Variable: For this analysis, we modified the period variable of the momentum strategy, testing different lengths of 1M, 3M, 6M, 9M, 12M, and 18M. The aim was to determine if shorter or longer momentum signals had different impacts on the performance of low-liquidity ETFs.
Performance and Alpha Trends: Again, the results were unexpected. Irrespective of the sorting period, the momentum strategies on low-liquidity ETFs yielded poorer returns than their high-liquidity counterparts. This challenges the conventional wisdom that that using the lower liquidity underlyings might boost trading strategies performance.
These findings suggest that lower liquidity does not necessarily lead to increased alpha in momentum strategies. This realization underscores the complexity of momentum strategies and the importance of liquidity considerations in their implementation.
Longing Low Liquid Country ETFs and Shorting High Liquid Country ETFs
In our subsequent test, we shifted our focus to an innovative approach: selecting the best-performing ETFs from the universe of relatively low-liquidity country ETFs and benchmarking them against a passive portfolio of high-liquidity ETFs, essentially shorting the high-liquidity ETFs. The country universe for both low-liquidity and high-liquidity ETFs is the same as before.
Unfortunately, the results were not favorable, but let’s dive into the details.
Effect of Varying Selected Symbols of Longing Low Liquid Country ETFs and Shorting High Liquid Country ETFs
The methodology involved varying the number of selected symbols for the momentum strategy within the low-liquidity ETF universe, experimenting with selections of 1, 2, 3, 4, 5, 6, and 7 ETFs. The goal was to understand how different levels of portfolio concentration within momentum strategy that is using low liquidity ETFs would perform against a benchmark of high-liquidity ETFs. The results were even more disappointing than previous strategies. The momentum strategy involving low-liquidity ETFs consistently underperformed when benchmarked against the passive portfolio composed of high-liquidity ETFs.
Effect of Varying Sorting Periods of Longing Low Liquid Country ETFs and Shorting High Liquid Country ETFs
In this part of the study, we altered the period variable for the momentum strategy, testing time frames of 1M, 3M, 6M, 9M, 12M, and 18M. This allowed us to assess the impact of different momentum signals on the performance of the momentum strategy using the low liquidity ETFs against high-liquidity ETF benchmarks. The results remained consistently unfavorable across all time frames. The strategy did not yield better outcomes, regardless of whether faster or slower momentum signals were used.
One hypothesis that could explain these disappointing results of comparing low-liquidity ETF momentum strategies against high-liquidity ETF benchmarks is the potential presence of survivorship bias in our selection of ETFs. Survivorship bias can occur when only successful or surviving entities are considered in an analysis, while those that have failed or ceased to exist are ignored. Our investment universe, selected in 2023, focused on high-liquidity country ETFs but did not account for their performance in earlier years, like 2006-2008. This approach likely favored “lucky survivors,” ETFs that thrived over time, increasing in liquidity due to past success. In contrast, the small or illiquid “unlucky survivors” might have persisted without significant performance. This inclination potentially skewed the results focusing on longing the “unlucky survivors,” struggling to outperform a benchmark of “lucky survivors.”
Future research should consider annually adjusting the investment universes for liquid and illiquid ETFs to mitigate this bias, a concept not explored in the current article but vital for further investigation.
Tests Using the Asset ETFs
Asset ETFs are investment funds traded on stock exchanges offer investors exposure to a wide array of underlying assets. Unlike country ETFs that track national markets, asset ETFs may focus on specific sectors, commodities, real estate, bonds, or a mix of assets. These ETFs can range from broad-based funds encompassing large segments of the financial markets to more niche funds focusing on specific industries or investment themes. Therefore, asset ETFs allow for flexible, liquid, and cost-effective ways for investors to diversify their portfolios.
Highly Liquid Asset ETFs
The momentum strategies applied to highly liquid asset ETFs exhibit a different performance trend compared to country ETFs. While country ETFs’ momentum strategies almost consistently showed negative alpha post-2008/2009, asset ETFs presented a different picture.
| Ticker | Full name |
| SPY | SPDR S&P 500 ETF Trust (large cap US stocks) |
| EEM | iShares MSCI Emerging Markets ETF (emerging market stocks) |
| EFA | iShares MSCI EAFE ETF (EAFE stocks) |
| VNQ | Vanguard Real Estate Index Fund ETF (real estate, REITs) |
| AGG | iShares Core U.S. Aggregate Bond ETF (fixed income ETF) |
| GLD | SPDR Gold Shares (GLD) (gold) |
| DBC | Invesco DB Commodity Index Tracking Fund (broad commodity index) |
| IWM | iShares Russell 2000 ETF (small cap US stocks) |
Effect of Varying Selected Symbols of Highly Liquid Country ETFs
This part of the study concentrated on altering the number of selected symbols in the momentum strategy. We experimented with portfolios comprising different numbers of ETFs, ranging from a single ETF to a maximum of seven (1, 2, 3, 4, 5, 6, 7 ETFs). This allowed us to observe the strategy’s performance across varying degrees of diversification.
Performance and Alpha Trends: The findings revealed that alphas of the momentum strategies built using the high liquidity Asset ETFs and shorting the benchmark equally weighted universe of constituent ETFs were negative for N=1 or 2 ETFs. But more diversified momentum strategies that picked more ETFs (3-7) started to have positive alphas, albeit small ones. That’s a significant difference compared to the investment universe that consisted of country ETFs.
Effect of Varying Sorting Periods Highly Liquid Asset ETFs
Changing the Period Variable: In this analysis, we altered the sorting period for the momentum strategy, testing periods of 1 month (1M), 3 months (3M), 6 months (6M), 9 months (9M), 12 months (12M), and 18 months (18M). This allowed us to compare the effectiveness of faster versus slower signals in identifying momentum.
Performance and Alpha Trends: These studies demonstrate that momentum strategies on assets can, in some instances, maintain positive alpha. The contrast in performance between asset and country momentum strategies might be attributed to the intrinsic nature of both groups.Macroeconomic factors influence Asset ETFs, and Country ETFs are influenced, too. What’s the difference is that country ETFs are influenced as a group, as they are all sensitive to the same macro factors at the same time. On the other hand, the Asset ETFs universe is more diversified. Asset ETFs are also influenced by macro factors, but individually, at different times, they are not strongly correlated. Therefore, momentum strategy can better distinguish between winners and losers. In the Country ETFs universe, all countries often go up or down simultaneously. On the other hand, the Asset ETFs universe is less correlated; sometimes, some ETFs go down, and others go up. This helps momentum to retail its alpha. Therefore, for varying sorting periods of highly liquid asset ETFs, the momentum strategy has alpha.
Low Liquid Asset ETFs
In our investigation into ETFs with low liquidity, we initially hypothesized that reduced liquidity might enhance the alpha generated by momentum strategies.
| Ticker | Fullname |
| IYY | iShares Dow Jones U.S. ETF |
| PXH | Invesco FTSE RAFI Emerging Markets ETF |
| DWM | WisdomTree International Equity Fund |
| RWR | SPDR Dow Jones REIT ETF |
| GBF | iShares Government/Credit Bond ETF |
| DBP | Invesco DB Precious Metals Fund |
| DJP | iPath Bloomberg Commodity Index Total Return ETN |
| EES | WisdomTree US SmallCap Fund |
Effect of Varying Selected Symbols of Low Liquid Asset ETFs
Changing the count_number variable: we varied the number of selected symbols for the momentum strategy, experimenting with 1, 2, 3, 4, 5, 6, and 7 ETFs. The objective was to observe how the concentration and diversification within low-liquidity ETFs affected the performance of the momentum strategy.
Performance and Alpha Trends: The momentum strategies applied to low-liquidity ETFs have approximately the same alpha as in the highly liquid asset ETFs. The same is also true for alpha distribution – non-diversified momentum portfolios (those that select 1 or 2 assets) have negative alpha, while diversified portfolios retain alpha.
Effect of Varying Sorting Periods Low Liquid Asset ETFs
Changing the Period Variable: The performance chart for the Effect of Varying Sorting Periods on Low Liquid Country ETFs shows momentum strategy effectiveness. Across the range of sorting periods from 1 month to 18 months, shorter sorting periods such as 1M and 3M display higher volatility in performance, suggesting a more reactive strategy to market changes. However, as we move towards longer periods like 12M and 18M, the performance lines tend to smooth out, indicating a less reactive, more steady approach to momentum. Overall, the momentum strategy on low-liquidity Asset ETFs yielded significant alpha comparing to the benchmark.
Longing Low Liquid Asset ETFs and Shorting High Liquid Asset ETFs
In our subsequent research, we shifted our focus once again to an innovative approach: selecting the best-performing ETFs from the asset universe of relatively low-liquidity assets and benchmarking them against a passive portfolio of high-liquidity ETFs, essentially shorting the high-liquidity ETFs. The asset universe for both low liquidity and high liquidity ETFs are the same as before.
Effect of Varying Selected Symbols of Longing Low Liquid Asset ETFs and Shorting High Liquid Asset ETFs
Here, we can notice that surprisingly, using the low liquid asset ETFs in a long leg while benchmarking with the high liquid asset ETFs does not generate alpha. So we will look at the case where we vary our rebalancing period.
Effect of Varying Sorting Periods of Longing Low Liquid Asset ETFs and Shorting High Liquid Asset ETFs
Changing the Period Variable: For the short sorting periods (1-3-months), the alpha is not positive, and also, for a very long term (18 months). But for mid-term periods (6-, 9-, 12-), the momentum strategies built with low-liquid ETFs have a small positive alpha against the portfolio of high-liquid ETFs. But alpha is definitely not strong.
What conclusion can we draw from the liquidity robustness tests? There isn’t a significant difference between the alpha of momentum strategies employed on low-liquid vs. high-liquid ETFs. Some momentum strategies using low liquidity ETFs have higher alpha, but there are also a lot of cases when versions of momentum strategies using highly liquid ETFs have higher alpha. So, from our analysis, we can’t conclude there is a direct link between the ETF liquidity and the subsequent asset momentum strategy’s performance.
This drives into question why there exists a difference between the same strategies varying rebalancing time but using different ETFs such as asset ETFs and country ETFs. The difference in alpha between country and asset momentum strategies is intriguing and likely stems from the distinct correlation structures within these two universes. Country ETFs often change due to their high correlation, reacting almost simultaneously to global macroeconomic shocks. This similarity limits the potential for a momentum strategy to capitalize on other movements instead of global market shocks, resulting in a predominance of negative alpha.
In contrast, asset ETFs, spanning commodities, bonds, and equities, present a less correlated, more heterogeneous landscape. Their diverse nature means that they are influenced by various market drivers, providing a diversified ground for momentum strategies. Assets react differently to market stimuli, allowing positive alpha generation as momentum strategies can exploit these varied responses. The diversity in the asset universe provides multiple opportunities for a momentum strategy to capture alphas.
This fundamental difference in market behavior underscores why asset momentum can retain alpha across liquidity levels while country momentum often cannot.
Conclusion
This research aims to provide a thorough and insightful evaluation of momentum strategies within the broader context of asset management. By examining the influence of strategic variables and comparing performances against a carefully constructed benchmark, the study seeks to determine the current relevance and potential optimization of momentum strategies in today’s rapidly evolving financial markets. The performance of momentum strategies varies significantly across ETF types, with asset ETFs outperforming due to their lower correlation and diverse drivers compared to the more homogenous country ETFs. Moving forward, we will dive even more into the structural intricacies of ETFs to unravel the underlying factors driving their performance, guiding more informed and effective investment strategies.
Author: Jiang Du, Autumn Internship Program in Quantpedia, Columbia University, 2023
Are you looking for more strategies to read about? Sign up for our newsletter or visit our Blog or Screener.
Do you have an idea for systematic/quantitative trading or investment strategy? Then join Quantpedia Awards 2024!
Do you want to learn more about Quantpedia Premium service? Check how Quantpedia works, our mission and Premium pricing offer.
Do you want to learn more about Quantpedia Pro service? Check its description, watch videos, review reporting capabilities and visit our pricing offer.
Are you looking for historical data or backtesting platforms? Check our list of Algo Trading Discounts.
Or follow us on:
Facebook Group, Facebook Page, Twitter, Linkedin, Medium or Youtube
Reference:
[1] N. JEGADEESH and S. TITMAN, “Returns to buying winners and selling losers: Implications for Stock Market Efficiency,” The Journal of Finance, vol. 48, no. 1, pp. 65–91, 1993. doi:10.1111/j.1540-6261.1993.tb04702.x
[2] M. T. Faber, “Relative strength strategies for investing,” SSRN Electronic Journal, 2010. doi:10.2139/ssrn.1585517
Share onLinkedInTwitterFacebookRefer to a friend


