Size Factor vs. Monetary Policy Regime
We have brought attention to the importance of evaluating factors models in different market regimes, and now, we will take a closer look at the size factor. Size [SMB (small minus big)] factor is a popular investment choice for asset investigation by many portfolio managers worldwide. The Size earned prominence in Fama and French‘s three and five-factor models and enjoy the continued discussion about its place in today’s portfolio construction.
In their paper, Simpson and Grossmann (Sep 2022) make many calls to the research of Asness et al. (2018). They use the classification of subsamples for evaluation of size factors as the “Golden Age” (1957-1979), the “Embarrassment” period (1980-1999), and the “Resurrection” period (2000-2012), which helps to bring some light into when the Size is performing the best. Basically, they find that without controlling for Quality, there is a size effect in the Golden Age and the Resurrection period but not in the Embarrassment period. After controlling for firm Quality, however, they document a significant Size premium in all three periods. But is that really? And what may be the underlying forces behind these occurrences?
While nodding to previous research and acknowledging it, the authors challenge it and partly disagree while offering a demonstration that the size premium re–emerges whether or not one controls for Quality if one examines the monetary policy stance and stringency being followed by the Federal Reserve. Functions of monetary policy and liquidity in markets are the most important for these smaller companies that enjoy loosened financial conditions, cheap capital, and credit. In every period and subperiod, they find significant premiums for the SMB factor during periods of monetary easing with and without controlling for firm Quality; while there are no observations of significant premiums for the SMB factor during any period of monetary tightening, even if one controls for Quality.
We can conclude that choosing Quality among smaller firms during restrictive monetary periods and conditions will probably not contribute to and secure fine results. It would be crucially important for investors seeking to capture the Size premium to realize that it is dependent on the monetary policy being pursued by the Federal Reserve, as the monetary easing seems to induce a Size premium.
Authors: Marc William Simpson and Axel Grossmann
Title: The Resurrected Size Effect Still Sleeps in the (Monetary) Winter
Link: https://papers.ssrn.com/sol3/papers.cfm?abstract_id=4228692
Abstract:
Asness et al. (2018) demonstrate the reemergence of the size premium (SMB) once one controls for firm quality within time series regressions. We demonstrate that the size premium disappears during periods of monetary tightening and is present during periods of monetary expansion; whether or not one controls for quality. Meaning that the effect is dormant in periods of monetary tightening even after one controls for firm quality. Among the channels that easing monetary policy is likely to influence small firms differently than large firms are: a) a stock market liquidity effect, b) a firm-level (balance sheet) liquidity effect, and c) increased access to credit. In addition, we show that the size effect is not only present during business cycle troughs (as in Ahn et al., 2019), but is present in monetary easing periods outside of trough periods. Investors seeking to capture this premium would be well served to consider the Fed’s policy stance and the stringency with which the Fed is pursuing its policy.
As always, we present several interesting figures and tables:
Notable quotations from the academic research paper:
“We investigate the size effect by bifurcating subperiods further into periods of monetary easing and monetary tightening. We control for several variables that the literature relates to the size effect including quality, liquidity, and business cycle troughs. We show that the size premium is only present during monetary easing periods and is never present during monetary tightening periods, regardless if one controls for quality or not, further we show that monetary easing plays a role in the size premium, beyond the periods of business cycle troughs.
It has also been noted in the literature that small firms may more greatly benefit from an increase in firm-level (balance sheet) liquidity or in greater access to funds during monetary easing periods than do large firms. Jensen, Johnson, and Mercer (1997) postulate that smaller firms have a more nuanced relationship with creditors and, therefore, benefit more from freer monetary policy than do big firms. Furthermore, Gertler and Gilchrist (1993, 1994) show that monetary tightening periods disproportionately impact credit flows to small firms as compared to large firms.
We find that stock market liquidity cannot explain a large amount of the size premium, during monetary easing periods, and therefore it is more likely that ease of access to capital may be responsible for the improved performance of small firms relative to large firms, in these periods. Further, there is a large size premium present during easing periods, even in the presence of controls for monetary troughs.
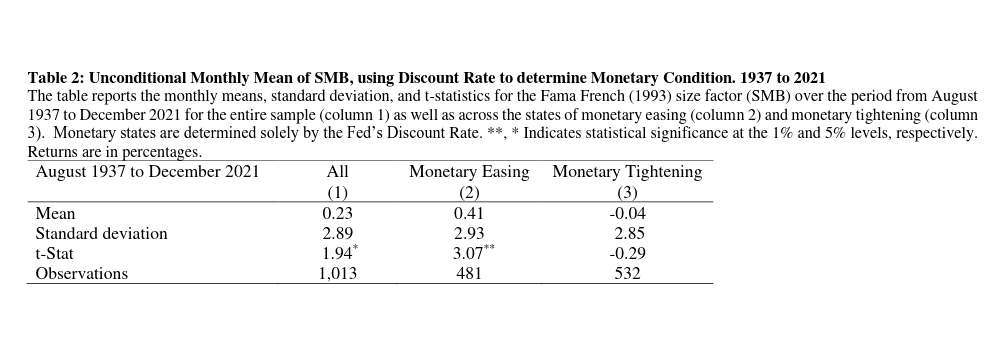
Preliminarily, we examine the size premium using only the Fed’s Discount Rate changes to classify periods. This gives us the longest time period over which we can examine the unconditional monthly means of the SMB: 1937 to 2021. These results are reported in Table 2. Due to data availability from the Fed we are not able to incorporate information about the Effective Fed Funds Rate until August 1954. In Table 3 we explore using one or the other measures independently to classify monetary conditions. From this empirical analysis we move forward using the classification scheme already established in the literature.
Table 2 reports the monthly means, standard deviation, and t-statistics for the Fama-French (1993) size factor (SMB) over the period from August 1937 to December 2021 for the entire sample (column 1) as well as across the states of monetary easing (column 2) and monetary tightening (column 3). Column 1 shows a significant SMB premium of 23 basis points over the entire period from 1937 to 2021. The finding is in line with Branz (1981), who found higher returns for small stocks versus large stocks for the period from 1936 to 1975.
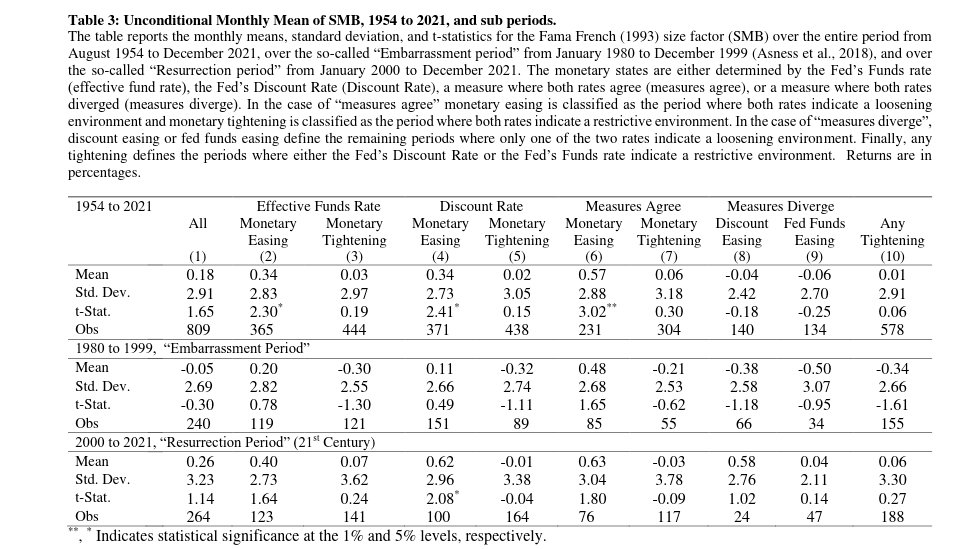
In Table 3, we measure the monetary periods using the Fed’s Funds rate and the Discount Rate, in isolation, and in combination with one another. The sample starts in 1954 since the Fed’s Funds Rate is not available at an earlier date. Using the time periods and nomenclature of Asness et al. (2018), we test for the size effect over different time periods. The periods under investigation are the “Embarrassment period” from January 1980 to December 1999, and the “Resurrection period (21st Century)” from January 2000 to December 2021. We want to note that the resurrection period in this paper, as opposed to the study by Asness et al. (2018), includes the period after the global financial crisis (GFC), the European sovereign debt crisis, as well as the period of the COVID pandemic.
Table 3 reports the monthly unconditional means, standard deviations, and t-statistics for the Fama and French (1993) size factor (SMB) over the period from August 1954 to December 2021. Column 1 shows an insignificant SMB premium over the entire period from 1954 to 2021, over the “Embarrassment period,” and over the “Resurrection period” (21st Century).
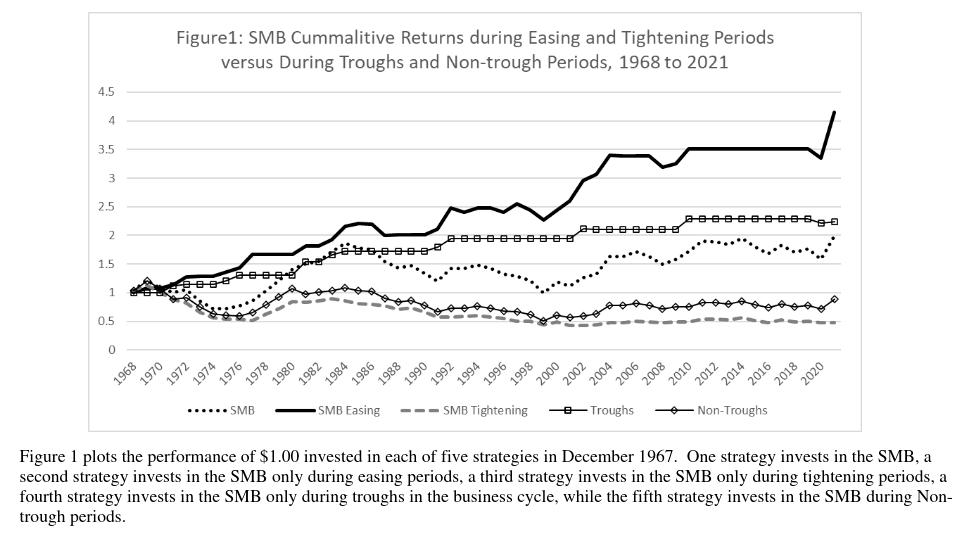
Figure 1 plots the performance of $1.00 invested in each of five strategies in December 1967. One strategy invests in the SMB, a second strategy invests in the SMB only during easing periods, a third strategy invests in the SMB only during tightening periods, a fourth strategy invests in the SMB only during troughs in the business cycle, while the fifth strategy invests in the SMB during non-trough periods. The highest performance is achieved by the strategy that invests in the SMB only during periods of monetary easing, followed by the strategy that invests only in business cycle troughs. While 70% of the trough periods are also easing periods, only 20% of the easing periods are designated as trough periods. Given the differences in the plots, one can deduce that there is a positive relation between easing periods and the SMB that goes beyond being at the trough of the business cycle.
In the context of varying monetary policy states, theory suggests that during downturns that are likely to induce the monetary authority to switch to an easing regime, small firms are more likely to face significantly higher costs of external capital than large firms, and as a result, they are likely to be more heavily affected by adverse credit market conditions. However, small firms benefit more from improving credit market conditions when the central bank is pursuing an easing of credit. If the market anticipates an improvement in credit market conditions as the central bank moves from a restrictive to an expansionary policy state, the prices of small stocks will rebound more rapidly than those of large stocks. The significant, positive performance of the SMB strategy detected during easing monetary policy states is influenced by the greater sensitivity of small stocks to changing credit market conditions.”
Are you looking for more strategies to read about? Sign up for our newsletter or visit our Blog or Screener.
Do you want to learn more about Quantpedia Premium service? Check how Quantpedia works, our mission and Premium pricing offer.
Do you want to learn more about Quantpedia Pro service? Check its description, watch videos, review reporting capabilities and visit our pricing offer.
Do you want algorithmic access to the full Quantpedia database via the API? Subscribe to Quantpedia Pro, ask for an API key, and explore the in/out-of-sample statistics, source academic papers, and code snippets — ideal for quantitative research, systematic trading workflows, and AI model training.
Are you looking for historical data or backtesting platforms? Check our list of Algo Trading Discounts.
Or follow us on:
Facebook Group, Facebook Page, Telegram, Twitter, Linkedin, Medium or Youtube
Share onLinkedInTwitterFacebookRefer to a friend


