The End-Of-Month Effect in Value–Growth and Real‑Estate–Equity Spreads
Introduction
Background
The clustering of excess returns on the final trading days of the month constitutes a robust empirical regularity with significant implications for portfolio construction. We document a month-end premium that is both statistically and economically significant, distinct from the canonical turn-of-the-month (ToM) effect. Our strategy highlights systematic style rotations—particularly shifts in value versus growth exposures, as proxied by the IVE–IVW spread—and documents parallel contemporaneous dislocations between real-estate and broad-equity benchmarks, as measured by the IYR–SPY spread.
Existing Literature
Extensive literature has documented pronounced return elevations around monthly and semiannual boundaries in both Treasury and equity markets, attributing these patterns to flight-to-safety, institutional rebalancing, reporting-window flows, window-dressing, and transient liquidity provisioning. Hartley and Schwarz (2019) demonstrate that Treasury securities yield predictable, economically significant excess returns in narrow windows around month-ends, indicating that institutional flow timing and microstructure frictions drive spike-and-revert profiles that trading strategies can exploit.
Quantitative‐practitioner reports emphasize that implementing EOM Treasury strategies entails navigating high turnover, skewed volatility, and business‐day conventions. Lynch and Mendenhall (1997) further frame these phenomena through institutional flow timing and liquidity shortages, demonstrating how aggregate demand surges at reporting dates generate short‐lived price pressure.
Motivation
Building on these antecedents, our study investigates whether monthly-end effects also affect style-based rotations. In doing so, we connect to the broader literature on pervasive style momentum and valuation effects across asset classes, drawing particularly on the framework of Asness, Moskowitz, and Pedersen (2012), who show that systematic shifts between value and growth strategies manifest globally and across multiple asset universes.
The canonical end-of-month (EOM) return anomaly has been robustly documented across fixed-income (and Turn of the Month in equity markets), yet its temporal structure remains insufficiently disentangled. In practice, the EOM premium may conflate two distinct signals: a pure monthly turn effect that recurs every calendar month and an additive quarterly boundary premium that amplifies at March, June, September, and December closes. Therefore, our motivation is also to decompose the aggregate EOM spike into orthogonal components, isolating a latent quarter-end uplift from the baseline monthly cycle.
We test whether style-rotation signatures at quarter-ends are consistent with three competing microfoundations—flight-to-safety, window dressing, and valuation-driven rebalancing—by examining directional shifts in ETF spreads caused by cross-sectional factor loadings. Our hypothesis posits that monthly-ends and quarter-ends produce a contemporaneous increase in value-minus-growth and real-estate-minus-broad-equity spreads, driven primarily by transient de-risking and benchmark alignment. Real-estate (REITs) and value stocks may exhibit pronounced sensitivity to the interest-rate term structure and mortgage-market conditions, implying that bond-market driven repricing at monthly closes can transmit into the style ETF versus the broad-equity spread.
Research Question
Based on the presented findings, evaluate the persistence of the following cross-sectional mechanism: Do factor and style exposures, particularly value versus growth (and REITs versus broad market), systematically shift around month-ends (quarter-ends) in a manner consistent with fight to safety, window-dressing, or valuation-driven rebalancing?
Hypotheses
IVE represents a value‑tilted ETF and IVW a growth‑tilted ETF; their net asset values reflect underlying balance‑sheet holdings whose market prices are interest‑rate sensitive. Consequently, if intermediate‑duration Treasury ETFs (e.g., IEF) exhibit end‑of‑month drift due to rate or liquidity effects, that drift propagates into equity style spreads so that the IVE–IVW spread displays comparable month‑end and quarter‑end movement.
Real-estate securities, and by extension IYR ETF, are mechanically more rate- and leverage-sensitive than the broad (stock) market because their cash-flow valuations embed longer-duration leases, higher embedded leverage, and direct exposure to mortgage-financing conditions; upward pressure on term yields or transient reductions in mortgage liquidity at reporting dates compress REIT valuations relative to growth-sensitive secular names in SPY, while episodic demand for defensive, income-producing assets conversely supports real-estate during flight-to-safety episodes. These structural sensitivities imply that month-end spikes in yields or concentrated ETF flows (creation/redemption imbalances) can generate outsized contemporaneous dislocations in IYR–SPY as market-makers absorb asymmetric order flow, producing exploitable short-window premia whose persistence is modulated by subsequent bond-market stabilization.
Data
The empirical design employs daily-return event windows around month- and quarter-ends, utilizing ETF-based proxies for style exposures (e.g., value and growth ETF pairs) to track cross-sectional dynamics.
Data were pulled from EODHD.com – the sponsor of our blog. EODHD offers seamless access to +30 years of historical prices and fundamental data for stocks, ETFs, forex, and cryptocurrencies across 60+ exchanges, available via API or no-code add-ons for Excel and Google Sheets. As a special offer, our blog readers can enjoy an exclusive 30% discount on premium EODHD plans. The following securities were involved in the final analysis and reporting:
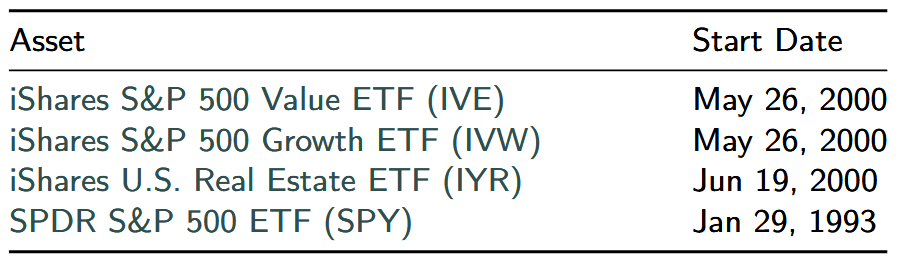
Data sample for all assets ends in August 2025. The longest possible dataspan was chosen to get the most reliable results.
Methodology
We begin by evaluating the spread between value and growth ETFs. Distributions of daily returns (returns per day) for the last three days of each month (D-3 to D-1) are shown in the histogram below.
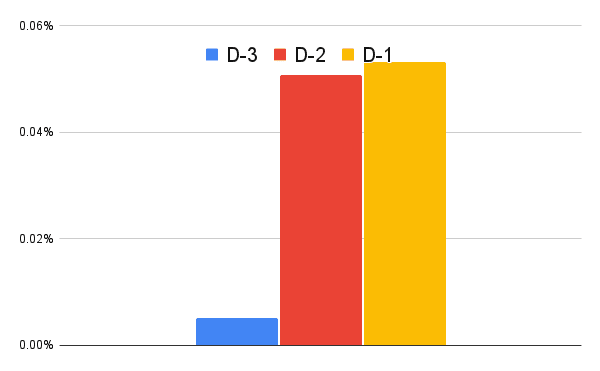
Histogram of IVE–IVW daily returns for the last three days of each month (for the whole year)
All three days yield positive returns, with the best results on the last day of the quarter, which further supports our hypothesis.
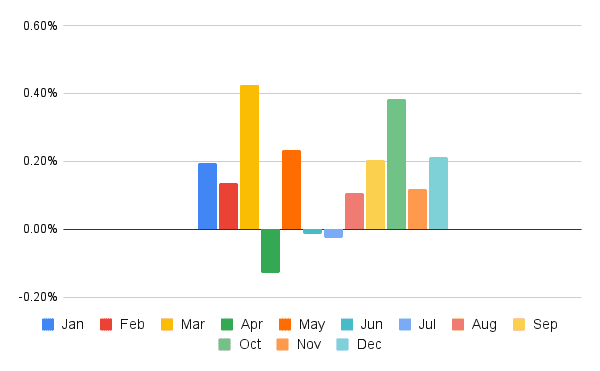
The following analysis presents another type of distribution of returns, for each calendar month, on the last trading day of the month (D-1).
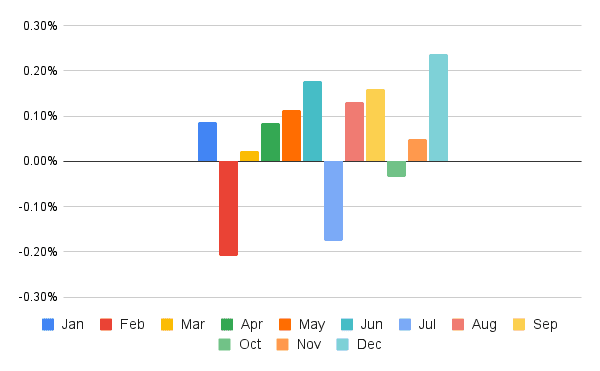
Histogram of IVE–IVW returns for the last (one) days of the month (for each month)
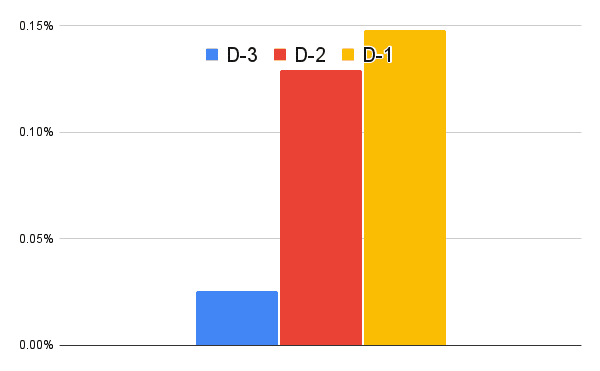
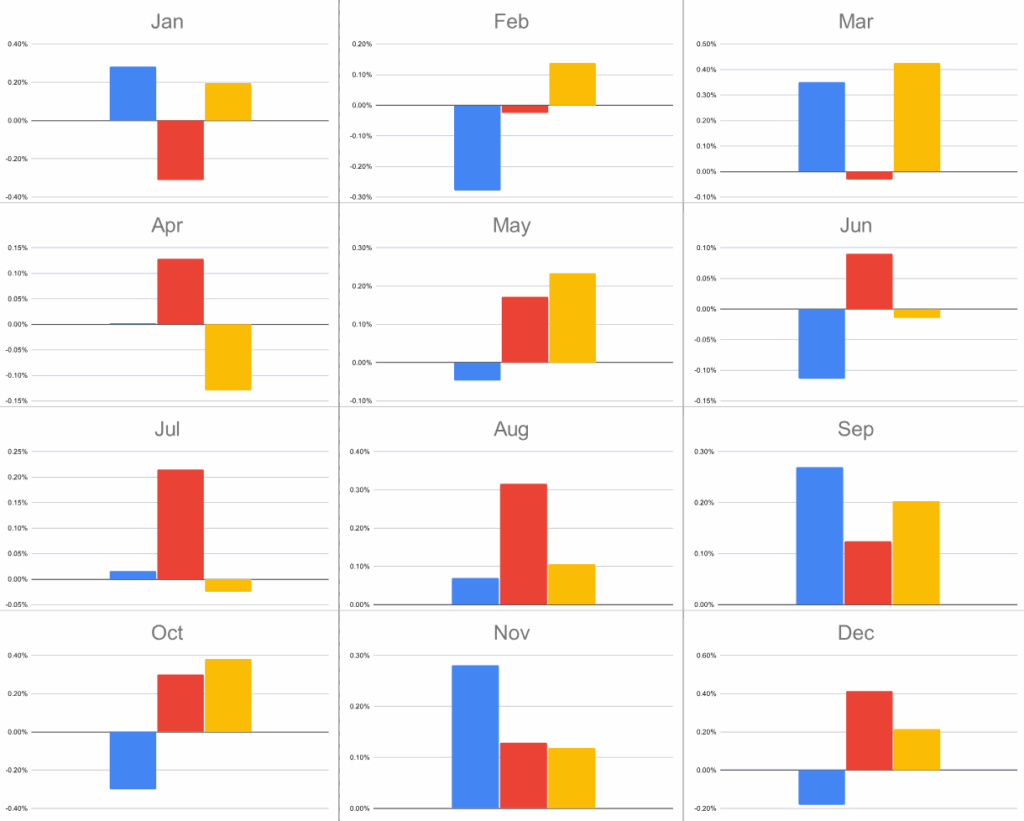
Lastly, from our distribution returns analysis, a combination of both approaches yields daily returns for the last three days of each calendar month.

Histogram of IVE–IVW daily returns for the last three days of each month (for each month separately)
That brings us to form several points in the form of synthesized facts directly flowing from the done-on analysis:
Profitability of the EoM signal: Decomposition across the 12 calendar months reveals only 3 months with the negative spread performance (February, July, October). On average, the performance of the spread in the last 2 days of the month is economically and statistically positive.
Quarter-end concentration: The final trading days of the quarter (March, June, September, December) exhibit visually conspicuous return spikes if we compare the pattern to the last days of the months at the beginning of the quarter (January, April, July, October).
The following illustrates the same trend for real estate (buying long) versus the broad U.S. stock market (sold short), in the form of ETFs, specifically IYR–SPY.
Histogram of IYR–SPY daily returns for the last three days of each month (for the whole year)
Histogram of IYR–SPY returns for the last (one) days of the month (for each month)
Histogram of IYR–SPY daily returns for the last three days of each month (for each month separately)
Existence of premia on the last days of the quarter in the case of IYR–SPY is even more pronounced than in the case of IVE–IVW, and that makes it a prime case to build some trading strategy on top of it.
Trading Strategy of IYR-SPY Spread
While we provided a descriptive and appealing argument in the previous section to support our case for hypothesis validation, we also formed a simple trading strategy for the other mentioned spread pair.
Strategy description
Buy (long) IYR, short (sell) SPY during the last 3 trading days of each calendar month, with positions opened at the end of the day on the fourth-to-last trading day and closed at the close of the last trading day.
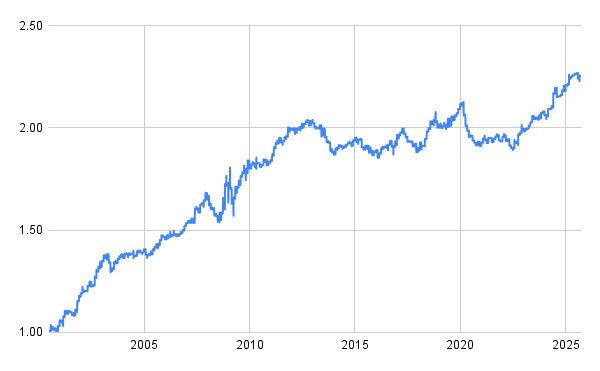
Equity Curve for Trading Strategy of IYR-SPY Spread
The IYR–SPY calendar strategy yields a positive equity curve, driven by outsized realized returns on month- and quarter-closing windows.
Performance and risk characteristics (all annualized) are to be found in the following table:
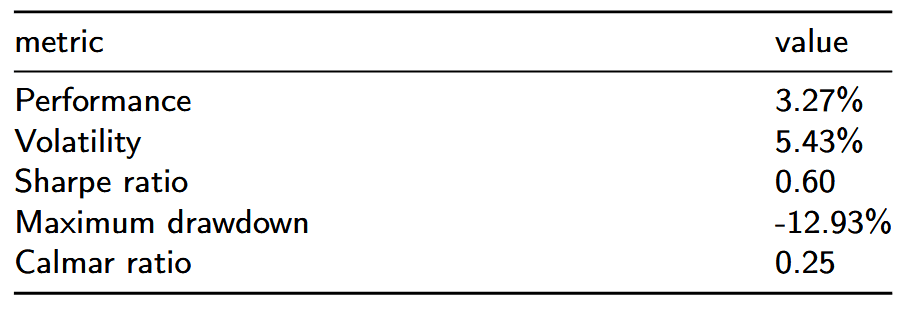
Given the relatively small number of days involved in the trading year, the strategy delivers a satisfactory return with minimal elevated volatility. It may be an interesting choice for diversification in a wide variety of hedge fund strategies. The ease of use of ETFs makes them a considerable candidate for both retail and professional traders.
Conclusion & Discussion
From an implementation and factor-perspective, the profitability of a last-three-days IYR–SPY (and IVE-IVW) trade arises from the confluence of
- predictable calendar clustering of institutional rebalancing and window-dressing flows into or out of interest rate sensitive ETFs (value IVE, real-estate IYR),
- transient liquidity externalities in the mortgage and swap markets that transiently alter discount rates applied to property cash flows, and
- ETF-specific mechanics that exacerbate price impact when arbitrage channels are strained at month- and quarter-ends.
Together, these forces create a temporally localized positive expected return for a long-real-estate/short-broad-equity position and long-value/short-growth around month- and quarter-closes, with realized excess returns that are sufficiently large to survive conservative transaction-cost and slippage assumptions when executed with disciplined intraday timing and capacity-aware sizing.
Author: Cyril Dujava, Quant Analyst, Quantpedia
Are you looking for more strategies to read about? Sign up for our newsletter or visit our Blog or Screener.
Do you want to learn more about Quantpedia Premium service? Check how Quantpedia works, our mission and Premium pricing offer.
Do you want to learn more about Quantpedia Pro service? Check its description, watch videos, review reporting capabilities and visit our pricing offer.
Do you want algorithmic access to the full Quantpedia database via the API? Subscribe to Quantpedia Pro, ask for an API key, and explore the in/out-of-sample statistics, source academic papers, and code snippets — ideal for quantitative research, systematic trading workflows, and AI model training.
Are you looking for historical data or backtesting platforms? Check our list of Algo Trading Discounts.
Or follow us on:
Facebook Group, Facebook Page, Telegram, Twitter, Linkedin, Medium or Youtube
Share onLinkedInTwitterFacebookRefer to a friend


