Time-Varying Equity Premia with a High-VIX Threshold
Financial markets have always been fascinating places of modern warfare where bears and bulls fight over the price, which is the only objective value of an asset at any time since it is when the buyer finds the seller and vice versa. During times of high stress and uncertainty of any kind, market volatility rises, and prices of different instruments tend to move to unbelievable highs or lows, defining any gravity (meme stocks going to the moon) or, on the other hand, literally having no bottom (crude oil futures for a brief time during coronavirus outbreak). It really looks like financial markets are driven by fear and greed. It will always be interesting to think if computer algorithms utilizing some almost magical machine learning AI feel these emotions as well (however, imagining them market-making a few meters from exchanges in New York and feeling happy or sad arbitraging high-frequency opportunities is hilarious).
What does one of the most popular and well-known metrics, VIX, tell us about future returns? Are we able somehow to verify sayings such as “Buy when there’s blood in the streets, even if the blood is your own.“ (attributed to Baron Rothschild) or (more mildly put) “to be fearful when others are greedy and to be greedy only when others are fearful.“ (variations Warren Buffett).
A recent academic paper presents an interesting finding. It shows, that a common, intuitive 20/80 thumb rule may be introduced: most of the excess returns earned from market-level exposure are realized 20% of the time following the highest VIX values.
From 1990 to 2022, scientists show that time-variation in the returns earned from equity-market exposure can be explained well by a simple 2-term risk-return specification, which predicts (1) much higher returns after VIX exceeds a high threshold at around its 80th percentile and (2) lower excess returns following a high market sentiment. Bansal and Stivers (July 2023) argue that VIX and market sentiment tend to measure complementary aspects of risk: the level of risk (VIX) and the price of risk or risk appetite (sentiment), and that, thus, both terms should be accounted for when evaluating time variation in the equity market’s risk premium.
To evaluate systematic risk, they primarily investigate subsequent excess returns for the aggregate stock market (primarily). For a beta-based position, that is long high-beta stocks and short low-beta stocks. As a result, they consistently found optimal thresholds near the 80th to 85th VIX percentile.
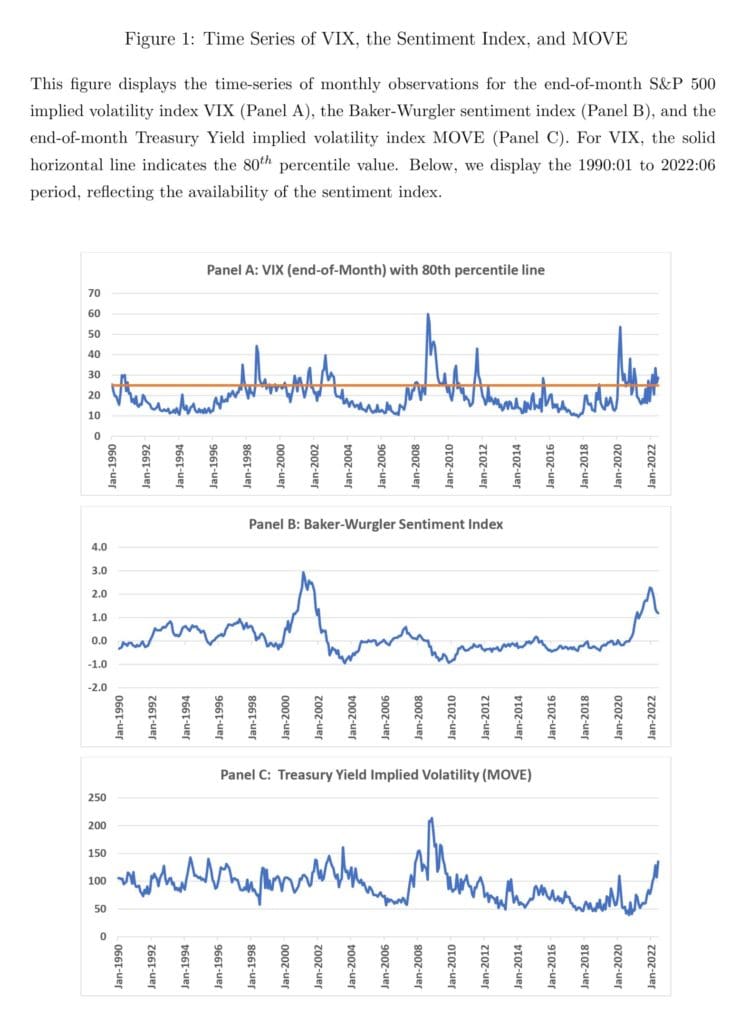
Mounting evidence indicates that the VIX threshold and sentiment have complementary, substantial roles in predicting subsequent excess stock returns. The model that includes the lagged Treasury implied-volatility index (MOVE) as an additional explanatory term adds appreciable explanatory power in the post-1997 period. That can be nicely seen from the figures below.
In closing, our recommended paper for reading is a nice example that shows that the high VIX-threshold pattern fits with the intuition that the equity risk premium can increase dramatically in periods of high economic stress and low liquidity, along with the nonlinear behavior of equity premium in the previous literature.
Authors: Naresh Bansal and Chris T. Stivers
Title: Time-varying Equity Premia with a High-VIX Threshold and Sentiment
Link: https://papers.ssrn.com/sol3/papers.cfm?abstract_id=4477652
Abstract:
Over the 1990 to 2022 period, we show that time-variation in the returns earned from equity-market exposure can be explained well with a simple specification, which predicts: (1) much higher excess returns after the implied volatility from equity-index options exceeds a high threshold at around its 80th percentile; and (2) lower excess returns following a high market sentiment. Our results are robustly evident for 1-, 3-, 6-, and 12-month returns; in subperiod analysis; and for both excess aggregate stock-market returns and beta-based long/short portfolio positions. The predictive R-squared values are substantial at about 20% and 30% for 6-month and 12-month returns, respectively. Comparatively, we show that the VIX-threshold in our specification outperforms other risk explanatory terms suggested by the literature; including the recent high-frequency realized volatility, the equity volatility risk premium, a risk-aversion index measure, stock-market illiquidity, and macroeconomic uncertainty. Our findings remain strongly evident when controlling for the default yield spread and term yield spread. Our findings indicate that the VIX-threshold and sentiment importantly capture complementary risk aspects, suggesting an interpretation where VIX largely indicates the level of risk and sentiment is informative about the market’s risk appetite or price of risk.
As always, we present several interesting figures and tables:

Notable quotations from the academic research paper:
“We argue that VIX and sentiment intuitively measure complementary aspects of market risk; in the sense of the level of risk (VIX) and the price of risk or risk appetite (sentiment). Hence, it is important to account for both effects when studying the predictive power of these variables for stock returns. In this paper, over the 1990 to 2022 VIX-available period, we show that time-variation in the returns earned from equity-market exposure can be explained well with a simple 2-parameter risk-return specification, which predicts: (1) much higher excess returns after the implied volatility from equity-index options (VIX) exceeds a high threshold in a non-linear fashion; and (2) lower excess returns following a high market sentiment.
Specifically, we estimate an optimal high-VIX threshold indicator variable, at around the 80th VIX percentile over our sample, as an explanatory term for the subsequent excess equity-market returns. We show that a simple VIX-threshold approach strongly outperforms a specification with a linear VIX explanatory relation. We then combine this high-VIX- threshold predictive term with sentiment. Following from Lochstoer and Muir (2022) and others, our specifications skip a month between the explanatory terms and subsequent excess market returns. This temporal gap allows some separation between the negative price impact of increasing risk (a largely contemporaneous influence) and the higher premia suggested by elevated risk (a predictive or intertemporal relation).
Figure 1 displays the time-series of monthly observations for VIX (end-of-month) and the Baker-Wurgler sentiment index. As depicted, VIX and sentiment are essentially uncorrelated over our sample period. The two measures have a correlation of 0.038 over our full sample. Approximate one-half subperiod correlations are also quite modest, at +0.150 over 1990:01- 2006:06 and -0.027 over 2006:07 to 2022:06. Further, we highlight that sentiment has prominent local peaks in each one-half subperiod. Sentiment peaked at 2.93 in February 2001 and at 2.28 in December 2021.
Overall, our results in this section demonstrate the impressive explanatory power of our simple 2-parameter model, which includes a high-VIX threshold and a sentiment term, in explaining the time-variation in market-level returns. Our results remain robust, regardless of whether we estimate the high-VIX threshold from optimal threshold regressions or use an adhoc 80th percentile threshold.
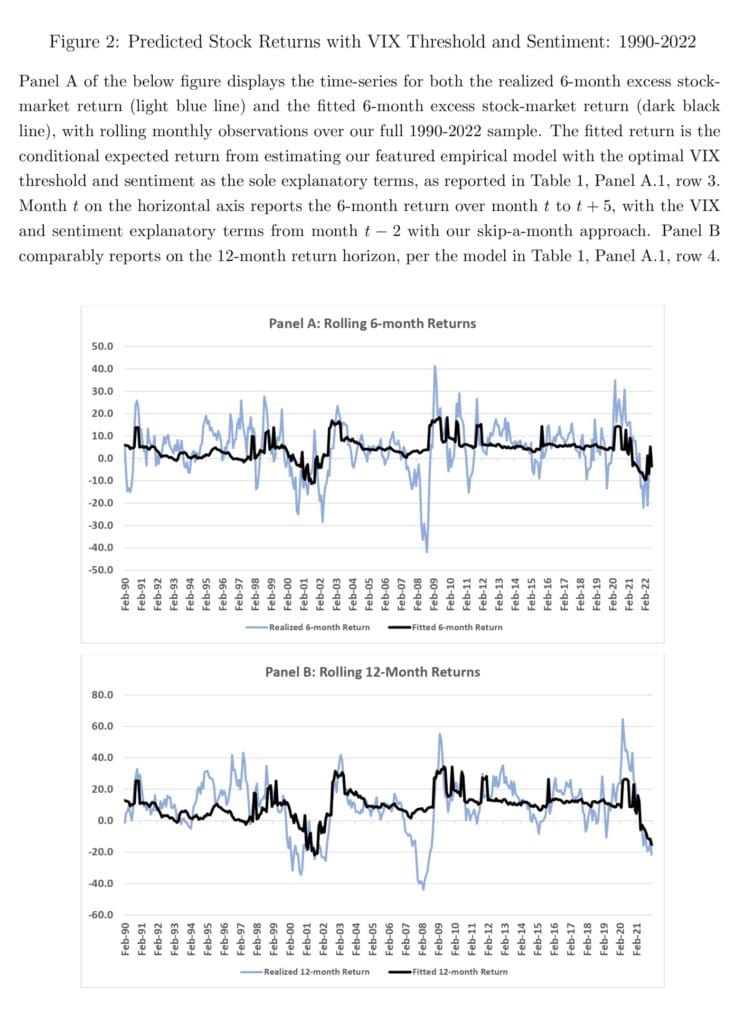
To present our results in a different way, Figure 2 graphically presents our primary model estimation results. The figure plots the time-series of the fitted (or conditional) predicted 6-month return over the subsequent six months (the darker, thicker line) from our primary model estimation in Table 1, Panel A.1, row-3. It also plots the actual realized 6-month excess returns (the lighter, thinner line). Since we analyze rolling 6-month returns, observed monthly, the data periodicity is monthly.
In summary, our findings suggest that the implied volatility of Treasury yields can also assist in explaining the risk-return relation in the equity market, particularly in the post-1997 period. However, our two-parameter ‘high-VIX-sentiment and sentiment’ model remains robust to controlling for MOVE, indicating that VIX and sentiment jointly capture complementary aspects of the market’s risk and risk appetite.”
Are you looking for more strategies to read about? Sign up for our newsletter or visit our Blog or Screener.
Do you want to learn more about Quantpedia Premium service? Check how Quantpedia works, our mission and Premium pricing offer.
Do you want to learn more about Quantpedia Pro service? Check its description, watch videos, review reporting capabilities and visit our pricing offer.
Do you want algorithmic access to the full Quantpedia database via the API? Subscribe to Quantpedia Pro, ask for an API key, and explore the in/out-of-sample statistics, source academic papers, and code snippets — ideal for quantitative research, systematic trading workflows, and AI model training.
Are you looking for historical data or backtesting platforms? Check our list of Algo Trading Discounts.
Or follow us on:
Facebook Group, Facebook Page, Telegram, Twitter, Linkedin, Medium or Youtube
Share onLinkedInTwitterFacebookRefer to a friend


