Trend-Following in the Times of Crisis
When someone mentions a financial crisis, most people immediately think of the global financial crisis of 2007-2008. Even though this is the most significant economic crisis in recent years, there have been many more significant crisis periods in the past 100 years. This article examines the biggest crises in three asset classes: stocks, bonds, and commodities, during the past century. Additionally, we analyze the behavior of our trend-following strategy during each of the crisis periods and propose it as a hedge for the stock, bond, and/or commodity markets.
Our Trend-Following Strategy
Trend-following is a strategy based on various momentum filters. The filters allow for gaining exposure to an asset only when there is a higher probability of outperformance of the simple buy-and-hold strategy. We examined how to obtain 100-year history for this strategy in one of our previous articles.
To quickly summarize the strategy, it consists of nine equally-weighted sub-strategies. Three of the nine sub-strategies used 12-month momentum, three used 6-month momentum, and three used 3-month momentum.
Each month we looked at the 12- (/6- /3-) month momentum of bonds, stocks, and commodities and went long if it was positive or short if negative. Then we weighted the assets according to our weighting scheme based on naïve risk parity.
All strategies were rebalanced on a monthly basis. However, to avoid the so-called “timing luck bias”, each strategy was rebalanced on a different day. We utilized 3-different rebalancing points during the month, thus arriving at 3×3 = 9 different sub-strategies.
So, of the three strategies that used 12-month (/6-month/ 3month) momentum, one was rebalanced on the 1st trading day of every month, the second on the 8th trading day of every month, and the third was rebalanced on the 15th trading day of every month.
This article focuses on how a multi-asset trend following strategy would have behaved in various crisis periods, and examines whether the strategy would have provided a useful hedge for the stock, bond, and/or commodity market. So, if you are interested in the full methodology behind the strategy, please see 100-Years of Multi-Asset Trend-Following.
Stocks, Bonds, and Commodities
As mentioned above, we analyzed the development of stocks, bonds, and commodities during the past century. So, the figure below shows the underlying data and the Multi-Asset Trend-Following strategy.
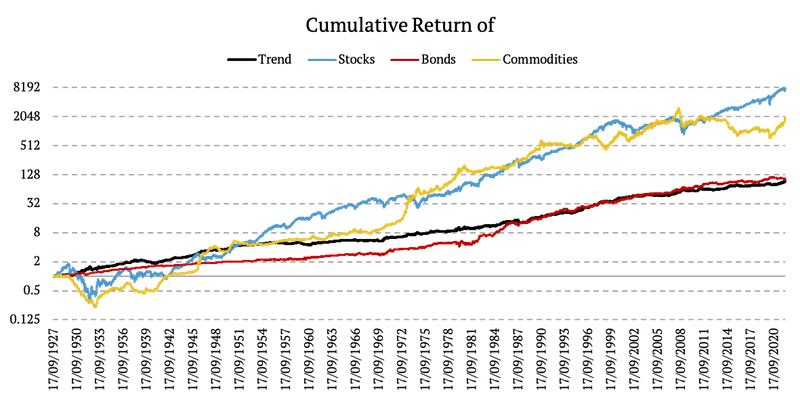
The process of obtaining 100-years of stock data is fairly simple. However, acquiring 100-year history of bonds and commodities is not as straightforward. For this reason, we dedicated full articles to Extending Historical Daily Commodities Data to 100 Years and Extending Historical Daily Bond Data to 100 Years.
Stock Crisis Periods
Stocks are a volatile asset class, with many bull markets and bear markets. For this reason, we had to distinguish between an actual crisis (/significant bear market) and a correction in the market. So, we defined the crisis as the period during which the drawdown breaks the 20% threshold. Applying this criterium, we got 13 crisis periods between 1927 – 2022. The following chart shows the performance of the stock during the crisis periods. Further, the chart also marks the average length and the average performance of the 13 bear markets (black square).
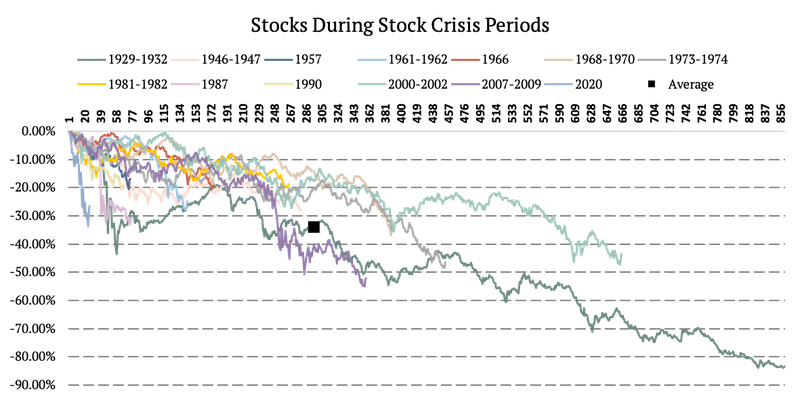
The longest and most significant bear market started in September 1929 and ended in July 1932. The stocks fell by 83.90% during the period also known as The Great Depression. The second most significant crisis was The Global Financial Crisis of 2007-2009, during which the stocks fell by 55.19%. The average length of a stock market crisis is 295 days, with an average performance of -33.88%. Additionally, we present the performance of the trend-following strategy during the same periods.
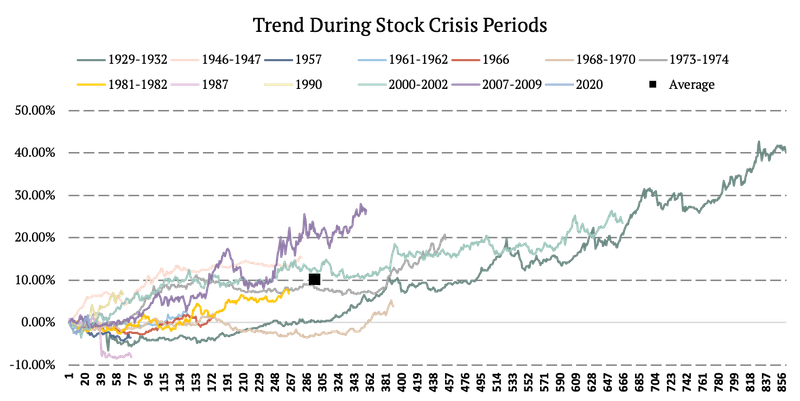
As the figures show, investing in the multi-asset trend-following strategy during the stock market crisis periods would be very profitable. The multi-asset trend-following strategy produces positive returns during almost every period, making it an excellent hedge with the average performance of 10.21%.
Bond Crisis Periods
Similarly to the stocks, we analyzed the bond market. This time, we defined the crisis as the period during which the drawdown breaks the 10% threshold. The threshold for bonds is lower because of their low volatility. Applying this criterium, we got 8 crisis periods between 1927 – 2022. The following figure shows the performance of bonds during the crisis periods. Further, the chart also marks the average length and the average performance of the 8 bear markets (black square).
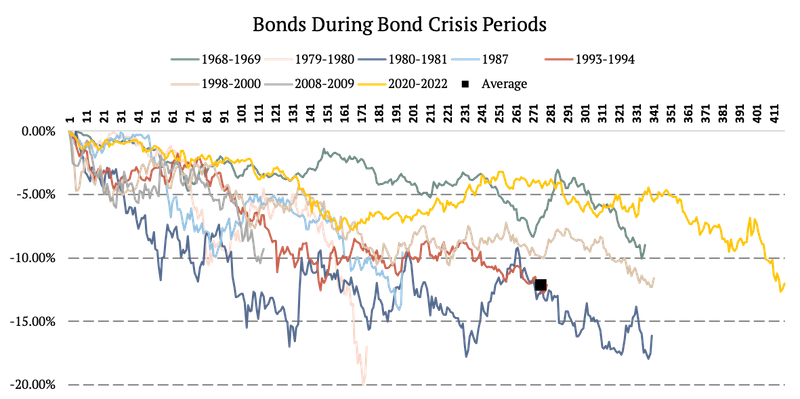
The longest crisis period in bonds is also the most recent one. The crisis is closely linked to the Covid-19 pandemic and happened between August 2020 and March 2022. The bonds fell by 12.63% during this period. However, the most significant crisis is not as recent. The greatest fall in the past century of 20.04% occurred between July 1979 and February 1980. The average length of a bond bear market is 274.5 days, with an average performance of -12.08%. Additionally, we present the performance of the trend-following strategy during the same periods.
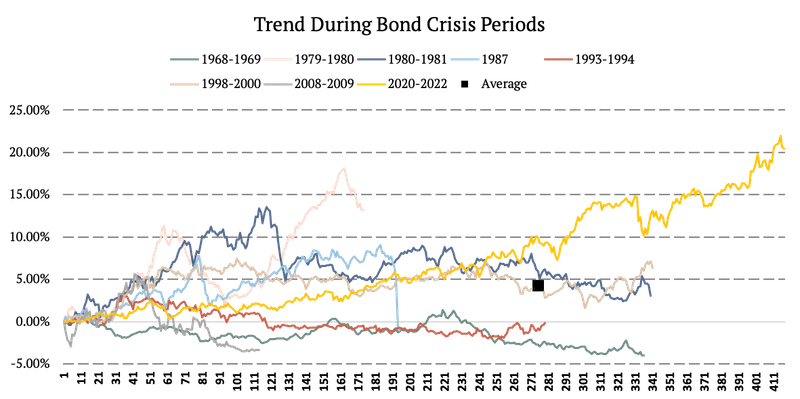
Investing in the multi-asset trend-following strategy during the bond market crisis periods would not be as profitable as during the stock market crisis periods. However, if we look at it from a hedging perspective, the multi-asset trend-following strategy still seems like a good hedge against fixed income crisis. The strategy produces positive returns during most crisis periods, with an average performance of almost 5% (4.31%).
Commodity Crisis Periods
Lastly, we examined the commodity market. Similarly to stocks, we defined the crisis as the period during which the drawdown breaks the 20% threshold. Applying this criterium, we got 13 crisis periods between 1927 – 2022. The following figure shows the performance of commodities during the crisis periods. Further, the chart also marks the average length and the average performance of the 13 bear markets.
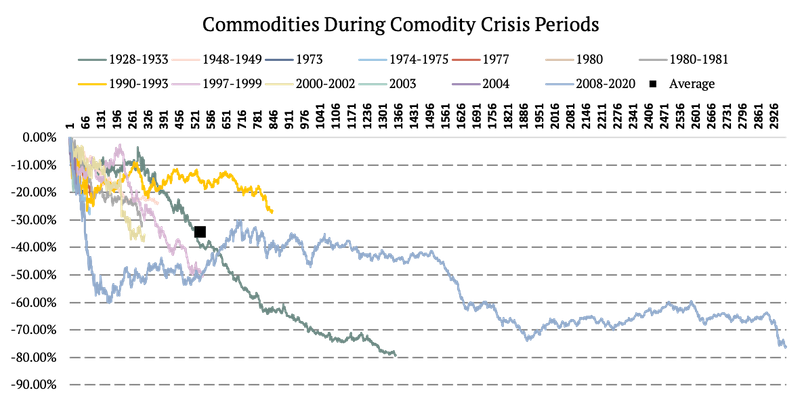
The most significant crisis in commodities started almost a century ago, in September 1928, and ended in March 1933. The commodities fell by 79.42% during the crisis, also known as The Great Depression. On the other hand, the longest crisis started during The Global Financial Crisis in July 2008 and did not end until April 2020. The commodities fell by 76.36% during the period. The average length of a commodity bear market is 543 days, with an average performance of -34.33%. Additionally, we present the performance of the trend-following strategy during the same periods.
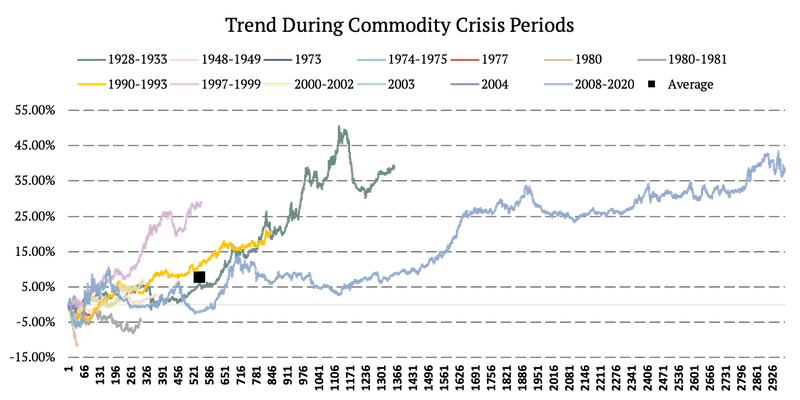
As the figures show, investing in the multi-asset trend-following strategy during the commodity market crises would be profitable. The multi-asset trend-following strategy produces positive returns almost every period, making it an excellent hedge with an average performance of nearly 8% (7.79%).
Conclusion
This article examined the biggest crises in three asset classes: stocks, bonds, and commodities, during the past century. Specifically, we analyzed 13 periods in stocks where the drawdown exceeded 20%, 8 periods in bonds where the drawdown exceeded 10%, and 13 periods in commodities where the drawdown exceeded 20%. Additionally, we analyzed the multi-asset trend-following strategy during each of these crisis periods. We predicted that the strategy would make a great hedge for the stock, bond, and/or commodity market. The prediction was confirmed, as the average performance of the multi-asset trend-following strategy during the stock market crises was 10.21%, during bond crises 4.31%, and 7.79% during commodity crises.
Author:
Daniela Hanicova, Quant Analyst, Quantpedia
Are you looking for more strategies to read about? Sign up for our newsletter or visit our Blog or Screener.
Do you want to learn more about Quantpedia Premium service? Check how Quantpedia works, our mission and Premium pricing offer.
Do you want to learn more about Quantpedia Pro service? Check its description, watch videos, review reporting capabilities and visit our pricing offer.
Do you want algorithmic access to the full Quantpedia database via the API? Subscribe to Quantpedia Pro, ask for an API key, and explore the in/out-of-sample statistics, source academic papers, and code snippets — ideal for quantitative research, systematic trading workflows, and AI model training.
Are you looking for historical data or backtesting platforms? Check our list of Algo Trading Discounts.
Or follow us on:
Facebook Group, Facebook Page, Telegram, Twitter, Linkedin, Medium or Youtube
Share onLinkedInTwitterFacebookRefer to a friend


