Understanding Investment Products Through Factor Analysis and Replication
Factor-based portfolio analysis provides a structured framework for understanding the drivers of investment performance, risk, and long-term behavior. This article applies a set of complementary methods to decompose portfolios into their underlying exposures, evaluate their statistical and economic significance, and assess their behavior across different market regimes.
The analysis is conducted using Quantpedia Pro tools, specifically The Multi Factor Analysis, Factor Analysis Models, The 100-year Portfolio Analysis and The ETF Replication. Together, these methods form a unified factor-based framework that connects decomposition, validation, and replication of portfolio returns. This approach allows for a more robust understanding of portfolio structure and highlights the extent to which observed performance can be explained through systematic factor exposures.
Introduction
Investment products such as ETFs, funds, or systematic strategies are often perceived as standalone and unique. In reality, most of them represent a combination of underlying exposures that jointly determine their performance. Similar to how a final product is composed of underlying ingredients, investment products are built from fundamental factors that define their behavior. Understanding these underlying components is essential for evaluating diversification, risk sources, and long term behavior.
Quantpedia Pro provides a set of analytical tools that allow users to decompose investment products, analyze their structure, estimate long term performance, and construct replication portfolios. A detailed overview of these reports is available in the Quantpedia Pro Reports section.
In this article, we demonstrate four key reports:
-
- Multi Factor Analysis
- Factor Analysis Models
- 100yrs Portfolio Analysis
- ETF Replication
Multi Factor Analysis
The Multi Factor Analysis report decomposes an investment product into its underlying components using Quantpedia internal factor database.
As an example, we analyze the iShares Core Moderate Allocation ETF AOM, a diversified multi-asset ETF representing a moderate-risk allocation across equities and bonds. By setting AOM as a 100% portfolio allocation, the report identifies the combination of factors that best explain its return profile and presents how each factor contributes to overall return.
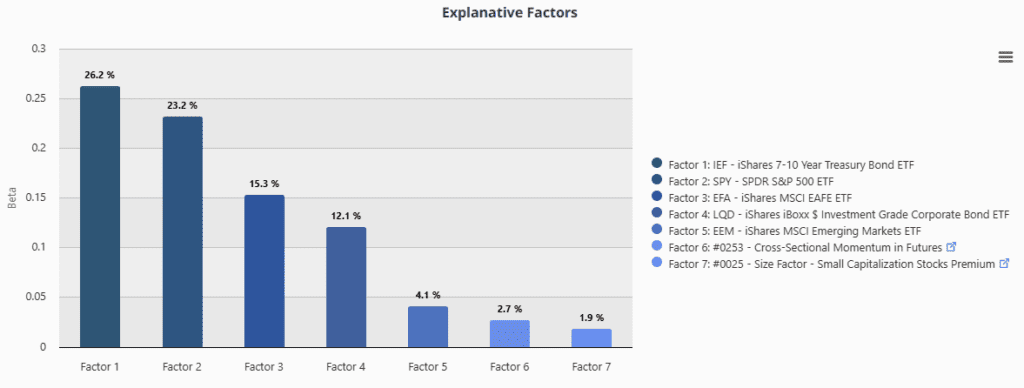
The factor decomposition shows that the portfolio is primarily driven by equity exposure, complemented by bond and international components, with smaller contributions from additional factors.
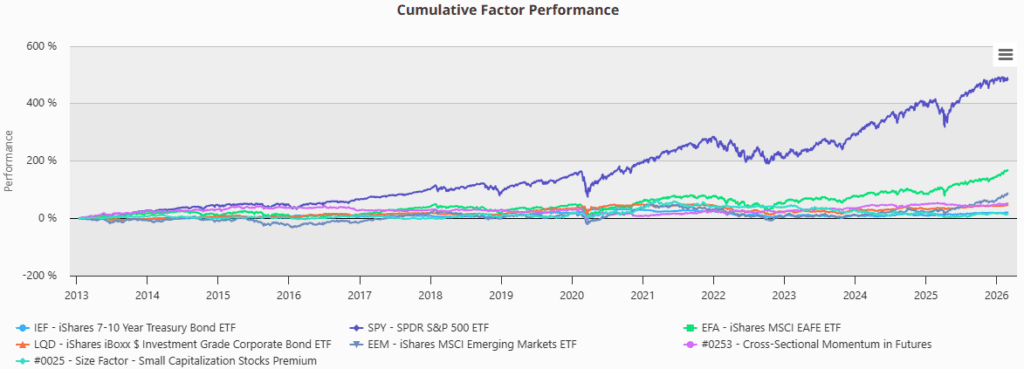
The cumulative factor performance chart illustrates how individual factors evolved over time and contributed to overall returns.
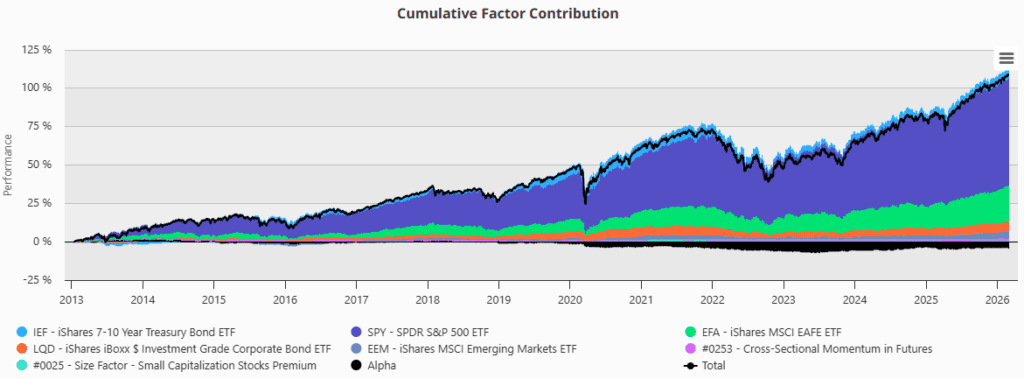
The contribution chart highlights how different factors contributed across time, including periods of market stress.
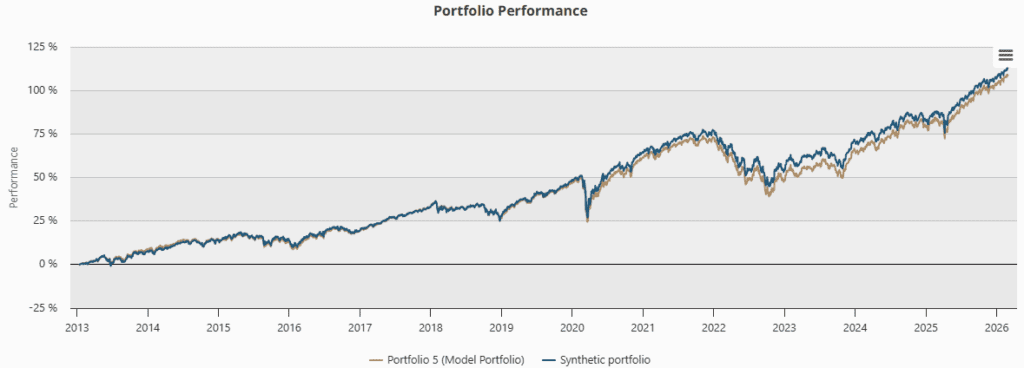
The synthetic portfolio constructed from identified factors closely tracks the original ETF, confirming that the selected factors provide a strong explanatory framework.
100yrs Portfolio Analysis
The 100yrs Portfolio Analysis extends the factor decomposition into a long term perspective to show how the analyzed portfolio would have performed if it had been applied 100 years ago. Using this product, you can test your portfolio under extreme historical market conditions or simply extend the analyzed period to achieve more robust results. All results are also presented relative to the selected benchmark. For the period where portfolio data is available, investors can additionally compare this synthetic portfolio with the actual realized portfolio performance.
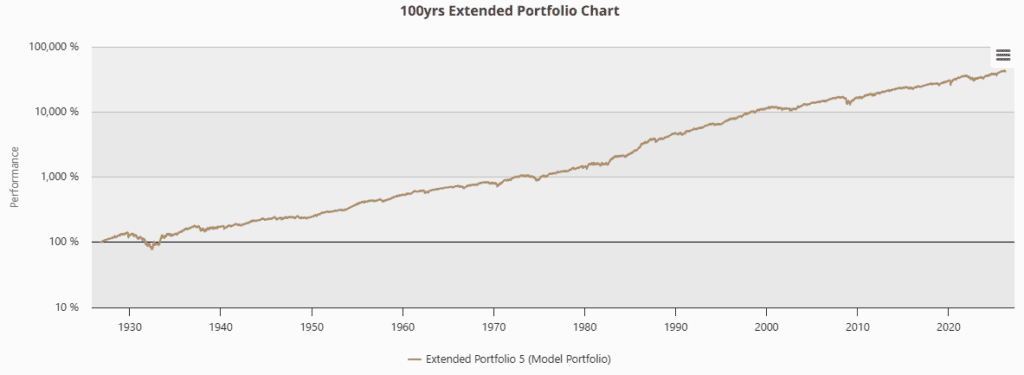
Based on identified exposures, the portfolio is mapped onto long term historical data to simulate performance over extended periods.

The extended results provide additional insight into long term return expectations, volatility, and drawdown characteristics across multiple market regimes.
This methodology has been discussed in detail in our previous article and serves here as a complementary extension to factor analysis.
Factor Analysis Models
The Factor Analysis Models report applies standardized academic factor models to explain portfolio behavior. This tool can be used for comparison of several different factors and exploration of their statistical significance.
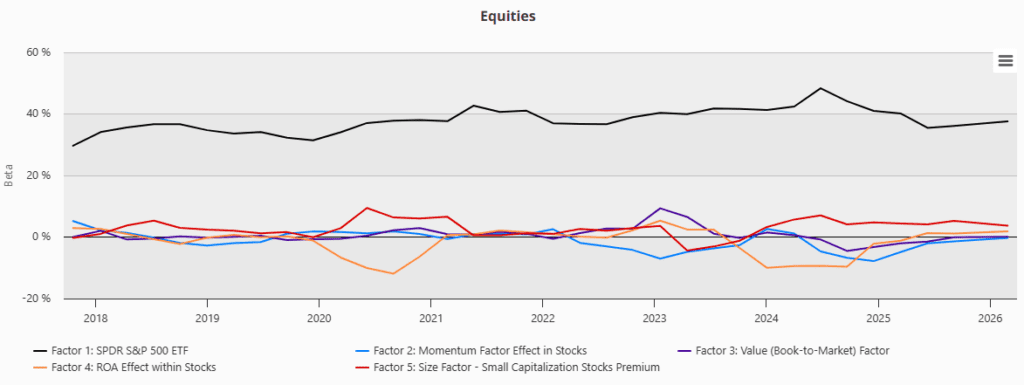
Equity model decomposes returns into commonly used factors such as market, value, size, momentum, and quality, typically based on frameworks such as Fama French.

The results indicate that the portfolio is primarily driven by market exposure, with smaller contributions from size and other style factors, while some factors are not statistically significant. Similar analyses can be extended to commodities, FX markets, bonds, and multi-asset portfolios.
This provides an alternative perspective to the internal factor decomposition and enables validation against widely accepted academic factor models.
ETF Replication
The ETF Replication report focuses on constructing portfolios that replicate the behavior of a selected investment. Decomposition of the portfolio into elementary investment factors allows you to find which ETFs you can use if you want to passively replicate mutual fund, hedge fund, trading strategy, or custom portfolio.
The analysis consists of two approaches – Replication Using Quantpedia ETF Universe and Custom Benchmark Replication.
Replication Using Quantpedia ETF Universe

In the first approach, the system selects ETFs from the Quantpedia database and constructs a portfolio that approximates the behavior of the target investment. The resulting factor loadings represent exposures derived from predefined ETF components.
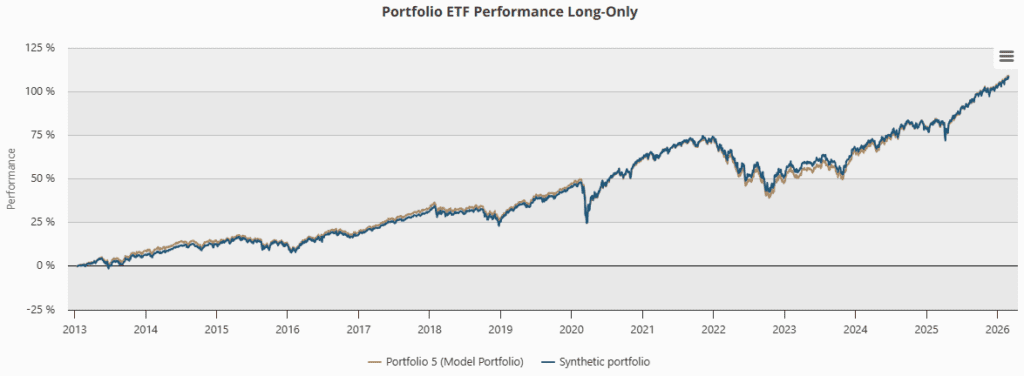
The ETF based replication shows that a combination of selected ETFs is able to closely track the original portfolio.
Custom Benchmark Replication

The second approach lets the user define a custom benchmark composed of selected assets, strategies, or equity curves.
For example, let’s select the following 5 assets:
- ACWI
- LQD
- DBC
- IWM
- SHY
The system then determines how these components can be combined to replicate the target portfolio.

Compared to the predefined ETF approach, the custom benchmark allows greater flexibility and enables users to define their own explanatory factors.
This difference is visible not only in factor exposures but also in the resulting portfolio performance. In some cases, custom factors provide a more accurate explanation and improved replication of the target investment, as they better reflect its underlying structure.
Conclusion
The Quantpedia Pro reports provide complementary perspectives on portfolio analysis, each focusing on a different aspect of investment structure and behavior. Together, these tools form a coherent framework that connects explanation, validation, and replication of investment strategies. This integrated approach allows investors not only to understand what drives portfolio performance but also to test its robustness over time and reconstruct its behavior using transparent, factor-based components.
Overall, the results confirm that a factor-based perspective is essential for both understanding and improving portfolio construction. Instead of treating ETFs as final products, they should be viewed as building blocks that can be analyzed, modified, and optimized.
Author: David Mesicek, Junior Quant Analyst, Quantpedia
Are you looking for more strategies to read about? Sign up for our newsletter or visit our Blog or Screener.
Do you want to learn more about Quantpedia Premium service? Check how Quantpedia works, our mission and Premium pricing offer.
Do you want to learn more about Quantpedia Pro service? Check its description, watch videos, review reporting capabilities and visit our pricing offer.
Do you want algorithmic access to the full Quantpedia database via the API? Subscribe to Quantpedia Pro, ask for an API key, and explore the in/out-of-sample statistics, source academic papers, and code snippets — ideal for quantitative research, systematic trading workflows, and AI model training.
Are you looking for historical data or backtesting platforms? Check our list of Algo Trading Discounts.
Or follow us on:
Facebook Group, Facebook Page, Telegram, Twitter, Linkedin, Medium or Youtube
Share onLinkedInTwitterFacebookRefer to a friend


