What’s the Key Factor Behind the Variation in Anomaly Returns?
In a game of poker, it is usually said that when you do not know who the patsy is, you’re the patsy. The world of finance is not different. It is good to know who your counterparties are and which investors/traders drive the return of anomalies you focus on. We discussed that a few months ago in a short blog article called “Which Investors Drive Factor Returns?“. Different sets of investors and their approaches drive different anomalies, and we have one more paper that helps uncover the motivation of investors and traders for trading and their impact on anomaly returns.
The authors (Tamoni, Sokolinski, and Li (2023)) propose a novel approach to decompose the variation in anomaly returns into the effects of different investors’ trading and various motives behind their trades. Their methodology builds on the demand-based asset pricing framework, where the demand of a heterogeneous set of investors determines stock prices.
The paper by draws two main conclusions:
- The demand for stock characteristics and the latent demand are the most important factors in explaining variation in anomaly returns. The narrow set of well-known observed stock characteristics is a good proxy for the features that matter to investors since it explains as much variation as all the unobserved characteristics combined.
- These findings favor the theories of anomalies that feature fundamental-based or sentiment-based direct trading, as opposed to mechanical flow-induced trading.
- Small non-13F investors drive most of the variation in anomaly returns. The effects of direct trading by this group are not only much larger on average, relative to the effects of large institutional investors, but they also remain remarkably persistent despite the increase in holdings by institutions over time.
- Scientists’ results set a new benchmark for theories of anomalies, suggesting that direct trading by small investors should be a key ingredient in such theories.
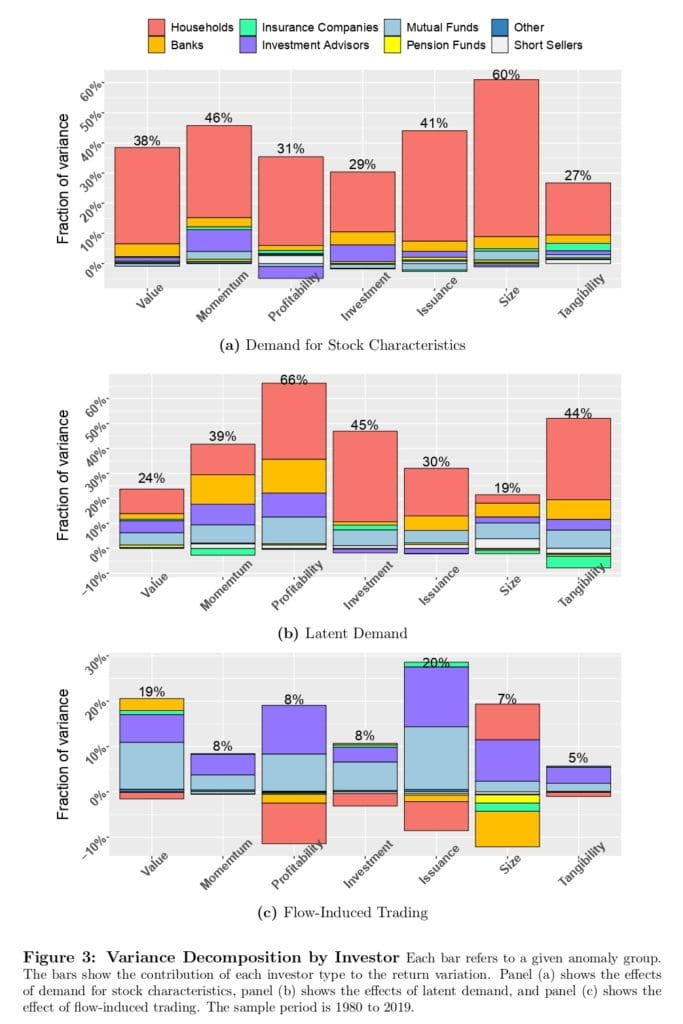
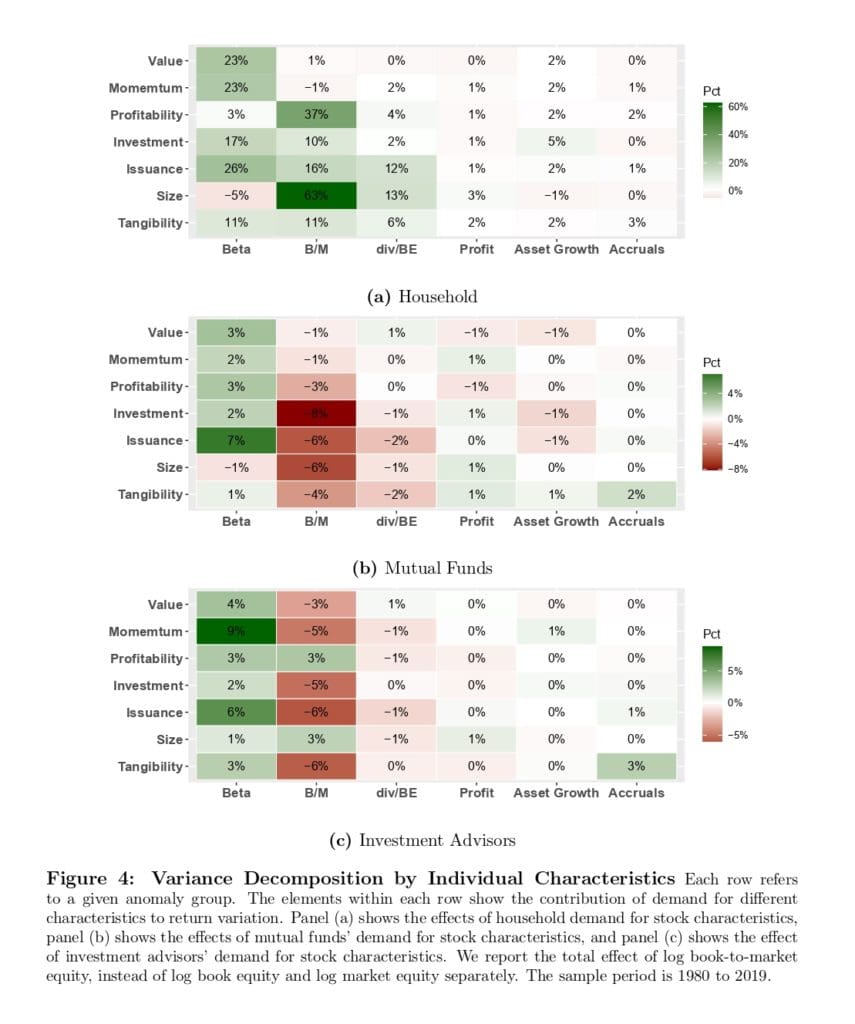
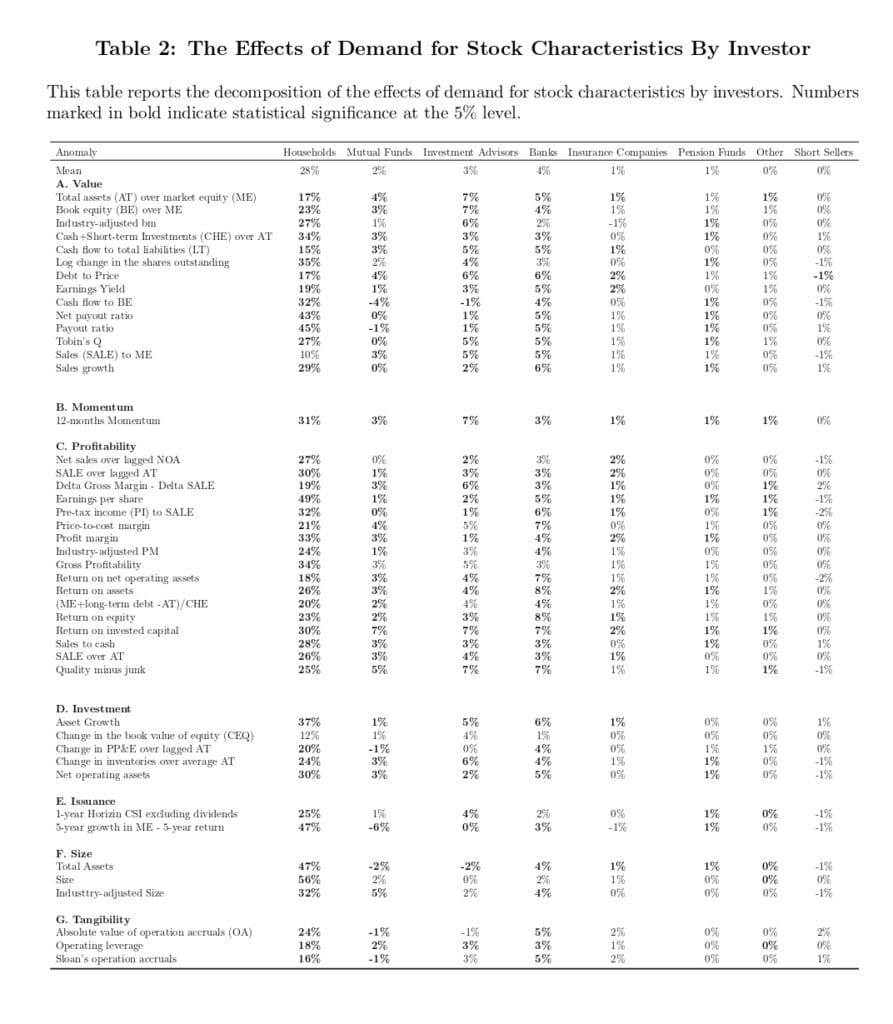
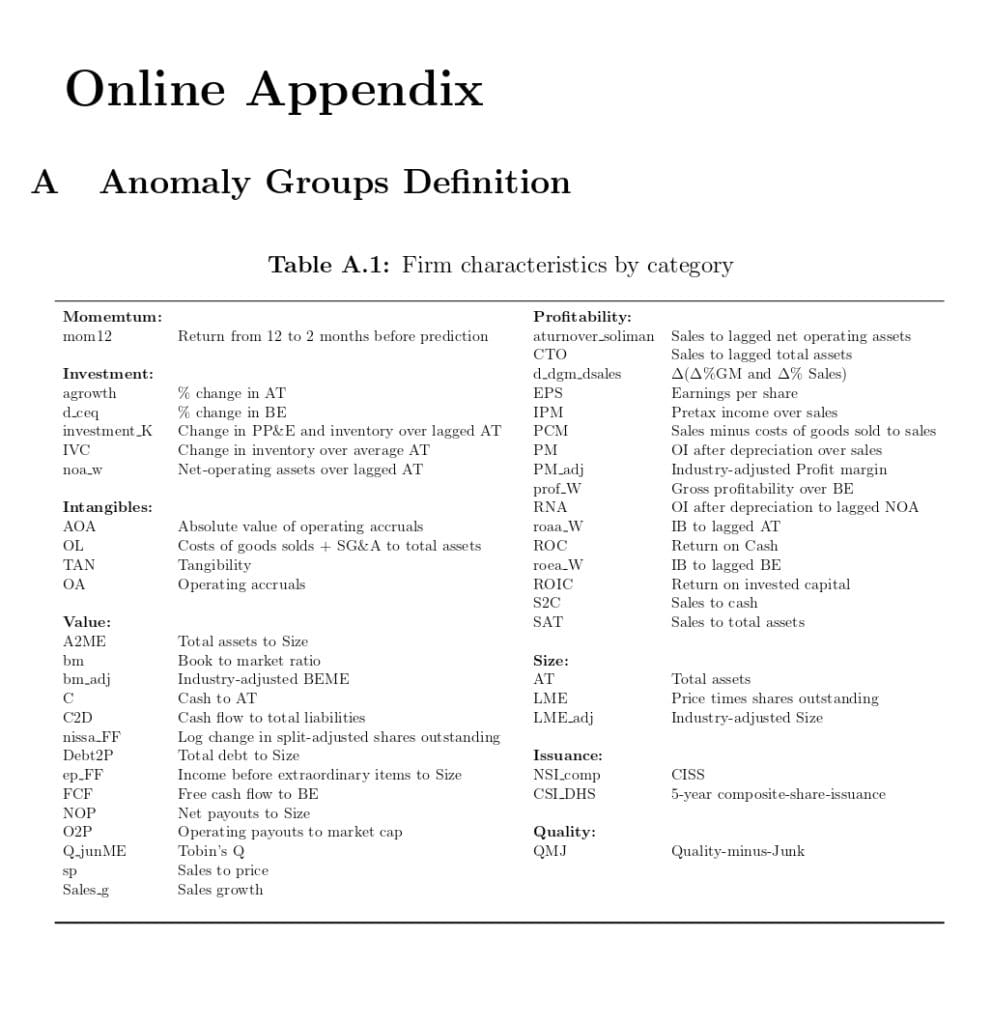
The variation in the demand of households represents the key driving factor behind the variation in anomaly returns. The decomposition of the demand for stock characteristics in panel (a) of Figure 3 shows that the effects of households are not only vastly larger than the effects of the institutions but also remarkably stable across anomaly groups. Table 2 presents the results for individual anomaly portfolios, confirming that the contribution of households’ demand for stock characteristics is large and statistically significant for almost all of the anomalies considered. The focus on households, mutual funds, and investment advisors is nicely depicted in Figure 4 (panels (a), (b), and (c), respectively). Furthermore, a full list of consistent anomalies and firm characteristics can be found in Tables A in Online Appendix.
Authors: Andrea Tamoni and Stanislav Sokolinski and Yizhang Li
Title: Which Investors Drive Anomaly Returns and How?
Link: https://papers.ssrn.com/sol3/papers.cfm?abstract_id=4242745
Abstract:
We investigate the sources of time-variation in returns on anomaly portfolios, specifically examining the role of different investor types and their trading motives. Our analysis reveals that 39% of the return variation can be attributed to changes in investor demand for common stock characteristics. Flow-induced trading explains an additional 12%, while the remainder is accounted for by random demand shocks. Notably, households and small non-13F institutions have the most significant impact, whereas large 13F institutions exhibit smaller effects. These findings provide strong support for theories that underscore the role of small non-professional investors in generating anomalies, thus challenging theories that prioritize flow-induced or discretionary trading by large institutional investors.
And; as always, we present several interesting figures and tables:
Notable quotations from the academic research paper:
“Asset pricing anomalies are patterns in asset returns which cannot be explained by the standard models of risk like the CAPM. A rich literature has documented a variety of persistent anomalies, generating a major dispute among researchers regarding their sources. The existing theories put forward several explanations which include exposure to non-standard sources of time-varying risk (Bansal and Yaron (2004); Gabaix (2012); Wachter (2013)), biased beliefs (Barberis et al. (1998), Hong and Stein (1999)), or institutional frictions (Shleifer and Vishny (1997), Lou (2012)). While some of these explanations have found empirical support, financial economists strongly disagree on which theories better fit the evidence.
[T]wo main results[:] First, we uncover three major trading motives that drive anomaly returns: demand for stock characteristics, demand shocks which are unrelated to observed stock characteristics (“latent demand”), and flow-induced trading. The demand for characteristics and latent demand represent the dominant forces, each accounting for about 38% of the return variation. The flow-induced trading explains only 11% of it. The remaining variation, driven by supply-side effects (e.g. changes in shares outstanding) and model estimation errors, is minor. These findings are consistent across the anomaly groups and individual anomaly portfolios, suggesting that returns of many distinct anomalies are actually driven by common trading motives.
We also show that the effects of trading motives significantly vary over time. The de-mand for characteristics is more important during “normal” times while the latent demand become highly consequential in more “turbulent” times. For example, the demand for stock characteristics increases the variation in returns of the value anomaly though early 1990s, including the initial stage of the dot-com bubble (1995-1997). However, during the more explosive stage of the bubble (1997-2000), the volatility of value strategies and inflated prices of growth stocks are mostly driven by the latent demand.
We next ask which stock characteristics are more important by decomposing the total effect of the demand for characteristics into the effects of individual characteristics. We find that the variation in demand driven by the stock’s market beta explains a large fraction of the total effect. These results hold across investors, consistent with stock market beta being an important driver of demand for both institutions and individual investors (e.g. Frazzini and Pedersen (2014), Baker et al. (2011), Buffa et al. (2022), Christoffersen and Simutin (2017)). Interestingly, the effect of market beta also consistently appears across many anomalies where the underlying portfolio stocks are sorted on other stock characteristics.
[R]esults provide a novel perspective on explanations behind anomaly returns. First, our findings are inconsistent with flow-induced trading being a major driving factor.5 They also do not support explanations which emphasize the direct role of stock characteristics (e.g., Liu et al. (2009)). In our analyses, changes in stock characteristics themselves explain only 3% of the variation in returns on the average anomaly portfolio.
Instead, our results are mostly consistent with two broad sets of theories. The importance of demand for stock characteristics supports theories where investors trade on the information about stock fundamentals. This set of anomaly theories includes: 1) behavioral theories where investors underreact or overreact to news (e.g., Hong and Stein (1999), Barberis et al. (1998) and Daniel et al. (2001)); 2) theories where investors rationally respond to new information such as productivity shocks (Kogan and Papanikolaou, 2013) or other determinants of price of risk (Lettau and Wachter, 2007).
Additionally, our results emphasize a dominant role of direct trading by households relative to trading by institutional investors.6 If small non-13F investors are viewed as less sophisticated, this finding further reinforces the behavioral theories. Moreover, this result is in line with the idea that many institutional investors are limited by benchmarking, which may discourage pursuing arbitrage-based strategies (Lewellen (2011), Baker et al. (2011)). Our findings are also less supportive of the view that more sophisticated investors such as short-sellers play a major role in determining anomaly returns. While trading by sophisticated investors weakens anomalies (e.g. Hanson and Sunderam (2014), Chen et al. (2019)), it appears to make a very modest contribution to their overall returns’ variation.
[H]ouseholds’ demand for characteristics explains 55% of the return variation in the size anomaly. This effect is also large for value (32%), momentum (31%), profitability (30%), and issuance (37%). While the effect is smaller for investment and tangibility anomalies (20% and 17%), it still remains sizable and larger than the analogous effect from other institutional investors. For comparison, the demand for characteristics by banks explains only 3%-5% of the variation in anomaly returns, and the effects of mutual funds and investment advisors are the largest for momentum anomaly at 3% and 7%, respectively. Table 2 presents the results for individual anomaly portfolios, further confirming that contribution of households’ demand for stock characteristics is large and statistically significant for almost all of the anomalies considered. This effect is the largest for payout ratio (45%) and earnings per share (49%), as well as for anomalies in the size and issuance groups.”
Are you looking for more strategies to read about? Sign up for our newsletter or visit our Blog or Screener.
Do you want to learn more about Quantpedia Premium service? Check how Quantpedia works, our mission and Premium pricing offer.
Do you want to learn more about Quantpedia Pro service? Check its description, watch videos, review reporting capabilities and visit our pricing offer.
Do you want algorithmic access to the full Quantpedia database via the API? Subscribe to Quantpedia Pro, ask for an API key, and explore the in/out-of-sample statistics, source academic papers, and code snippets — ideal for quantitative research, systematic trading workflows, and AI model training.
Are you looking for historical data or backtesting platforms? Check our list of Algo Trading Discounts.
Or follow us on:
Facebook Group, Facebook Page, Telegram, Twitter, Linkedin, Medium or Youtube
Share onLinkedInTwitterFacebookRefer to a friend


