An Analysis of PIMCO’s Bill Gross’ Alpha

4.May 2019

Bill Gross is probably the most known fixed income fund manager. A new academic paper sheds more light on his track record and sources of his stellar performance …

Authors: Dewey, Brown

Title: Bill Gross' Alpha: The King Versus the Oracle

Link: https://papers.ssrn.com/sol3/papers.cfm?abstract_id=3345604

Abstract:

We set out to investigate whether ''Bond King" Bill Gross demonstrated alpha (excess average return after adjusting for market exposures) over his career, in the spirit of earlier papers asking the same question of ''Oracle of Omaha," Warren Buffett. The journey turned out to be more interesting than the destination. We do find, contrary to previous research, that Gross demonstrated alpha at conventional levels of statistical significance. But we also find that result depends less on the historical record than on whether we take the perspective of academics interested in market efficiency, investors picking a fund or someone (say a potential employer) asking whether a manager has skill or is throwing darts to pick positions. These are often thought to be overlapping or even identical questions. That's not completely unreasonable in equity markets, but in fixed income these are distinct. We also find quantitative differences, mainly that fixed-income securities have much higher correlations with each other than equities, make alpha 4.5 times as hard to measure for Gross than Buffett. We don't think our results will have much practical effect on attitudes toward Gross as an investor, but we hope they will advance understanding of what alpha means and appropriate ways to estimate it.

Notable quotations from the academic research paper:

"Superstar bond portfolio manager Bill Gross announced his retirement last week. From 1987 to 2014, his PIMCO Total Return fund generated 1.33% per year of alpha versus the Barclays US Credit index, with a t-statistic of 3.76. For many years his fund was the largest bond fund in the world, and was generally considered to be the most successful. This track record inspired us to take a closer quantitative look along the lines of Frazzini, Kabiller and Pedersen's Buff ett's Alpha (FKP). Gross, like Bu ffett, often publicly discussed what he perceives as the drivers of his returns. At the Morningstar Conference in 2014 and in a 2005 paper titled "Consistent Alpha Generation Through Structure" Gross highlighted three factors behind his returns: more credit risk than his benchmark, more 5-year and less 30-year exposure, and long mortgages and other securities with negative convexity.

We present five main fi ndings:

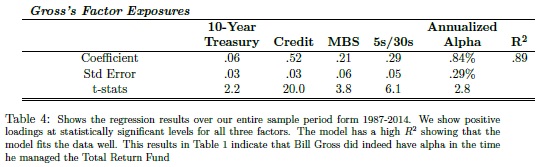
1. We con firm that those three factors, plus one for the general level of interest rates, explain 89% of the variance in Gross' monthly return over the 27-year period. We further estimate that Gross outperformed a passive factor portfolio by 0.84% per year, which is signi ficant at the 5% level. Gross' compounded annual return over the period was 7.52%, versus 6.44% for the Barclay's Aggregate US Index. So we find that most of his 1.08% annual outperformance of the index was alpha.

Bill Gross' Alpha

2. The FKP paper mentioned above considered one of the best-known track records in the equity asset class, Warren Buff ett's. We compliment this work by examining one of the best-known track records in the fixed-income asset class. Fixed-income investing o ffers a di erent set of challenges and opportunities than equity. We o ffer a novel discussion on the concept of manager alpha including important qualitative and quantitative di fferences in the concept of alpha with Gross versus Bu ffett.

3. The main qualitative di fference is that Gross exploited well known sources of risk and potentially excess return in the fixed-income market, exposures that investors rationally demand additional yield to accept. Bu ffett's performance, for the most part, correlates with factors uncovered long after he began investing and were still not accepted as fully as factors like credit risk or mortgage prepayment risk. Moreover Buff ett's factors probably result from behavioral biases and institutional constraints rather than rational investor preferences.

4. The main statistical di fference is the much higher r2 value in Gross' regression versus Buff ett's (about 0.9 versus 0.3) makes the alpha signi ficance estimate 4.5 times as sensitive to the observed returns on the factor portfolios. Since it is nearly impossible to estimate expected returns – there is considerable debate about the level of the equity premium even with 150 years or more of data – this makes it important to select factors that conform as closely as possible to what Gross actually did, rather than factors that merely have a high return correlation to Gross' results. The closer the factors conform to Gross' practice, the better the chance that any deviations in factor performance from expectation over the period are reflected equally in both Gross' actual results and the factor portfolio results.

5. Gross earned essentially all of his alpha in favorable markets for his factors and had a signi ficantly negative timing ability in the sense that his factor exposures were greater in months the factor had negative returns than in months the factor had positive return. This latter feature could be unfortunate timing decisions or negative convexity in the factor exposures. We discuss whether this can shed light on the source of Gross' alpha, speci fically whether it relates to preferential access to new issues and leverage."


Are you looking for more strategies to read about? Check http://quantpedia.com/Screener

Do you want to see performance of trading systems we described? Check http://quantpedia.com/Chart/Performance

Do you want to know more about us? Check http://quantpedia.com/Home/About


Follow us on:

Facebook: https://www.facebook.com/quantpedia/

Twitter: https://twitter.com/quantpedia


Continue reading

Case Study: Quantpedia’s Composite Seasonal / Calendar Strategy

26.April 2019

Despite the fact that the economic theory states that financial markets are efficient and investors are rational, a large amount of research is about anomalies, where the result is different from the theoretical expectation. At Quantpedia, we deal with anomalies in the financial markets and we have identified more than 500 attractive trading systems together with hundreds of related academic papers.

This article should be a case study of some strategies that are listed in our Screener, with an aim to present a possible usage of strategies in our database. Moreover, we have extended the backtesting period and we show that the strategies are still working and have not diminished. This blog also should serve as a case study how to use the Quantpedia’s database itself; therefore the choice of strategies was not obviously random and strategies were filtered by given criteria, however, every strategy is listed in the “free“ section, and therefore no subscription is needed.

Continue reading

Momentum In International Government Bonds Can Be Explained By Currency Momentum

18.April 2019

A new academic paper related to:

#8 – Currency Momentum Factor

Authors: Zaremba, Kambouris

Title: The Sources of Momentum in International Government Bond Returns

Link: https://papers.ssrn.com/sol3/papers.cfm?abstract_id=3332942

Abstract:

This study aims to offer a new explanation for the momentum effect in international government bonds. Using cross-sectional and time-series tests, we examine a sample of bonds from 22 countries for the years 1980 through 2018. We document significant momentum profits that are not attributable to bond-specific risk factors, such as volatility or credit risk. The global bond momentum is driven by the returns on underlying foreign exchange rates. Controlling for currency movements fully explains the abnormal returns on momentum strategies in international government bonds. The results are robust to many considerations including alternative sorting periods, portfolio construction methods, as well as subperiod and subsample analysis.

Notable quotations from the academic research paper:

"The various types of momentum effects have also been documented in government bonds, implying that the fixed-income winners outperform fixed-income losers. Although the finance literature extensively discusses the sources of momentum in an equity universe, the specific explanations for momentum in government bonds are rather scarce.

This paper aims to contribute in two ways. First, we provide new evidence on the momentum effect in international government bond markets. Using cross-sectional and time-series tests, we investigate a sample of government bonds from 22 countries for the years 1980 through 2018.

Second, and more importantly, we offer and test two new explanations of momentum. Our first hypothesis builds on Conrad and Kaul (1998): we conjecture that the momentum in bonds may simply capture the cross-sectional variation in long-run returns. In other words, the top performing assets continue to deliver higher returns because they exhibit excessive risk exposure. In particular, we assume that the winner (loser) bonds may display high (low) exposure to duration and credit risks, which drive the excessive long-run returns. The second hypothesis is that the momentum in bonds might be driven by the returns on underlying currencies.

Fund flows

The primary findings of this study can be summarized as follows. We document a strong and robust momentum effect in government bonds. An equal-weighted portfolio of past winners tends to outperform past losers by 0.24–0.35% per month. The effect is not fully attributable to the risk factors in government bonds, which explain 38–55% of the abnormal profits. Nevertheless, the phenomenon is entirely explained by the momentum in underlying foreign exchange rates, which is consistent with our second hypothesis. Once we control for the currency returns in cross-section or time-series tests, the momentum alphas disappear. The results are robust to many considerations, including alternative sorting periods and portfolio implementation methods, as well as subperiod and subsample analyses."


Are you looking for more strategies to read about? Check http://quantpedia.com/Screener

Do you want to see performance of trading systems we described? Check http://quantpedia.com/Chart/Performance

Do you want to know more about us? Check http://quantpedia.com/Home/About


Follow us on:

Facebook: https://www.facebook.com/quantpedia/

Twitter: https://twitter.com/quantpedia


Continue reading

Can We Explain Abudance of Equity Factors Just by Data Mining? Surely Not.

11.April 2019

Academic research has documented several hundreds of factors that explain expected stock returns. Now, question is: Are all this factors product of data mining? Recent paper by Andrew Chen runs a numerical simulation that shows that it is implausible, that abudance of equity factors can be explained solely by p-hacking …

Author: Chen

Title: The Limits of P-Hacking: A Thought Experiment

Link: https://papers.ssrn.com/sol3/papers.cfm?abstract_id=3358905

Abstract:

Suppose that asset pricing factors are just p-hacked noise. How much p-hacking is required to produce the 300 factors documented by academics? I show that, if 10,000 academics generate 1 factor every minute, it takes 15 million years of p-hacking. This absurd conclusion comes from applying the p-hacking theory to published data. To fit the fat right tail of published t-stats, the p-hacking theory requires that the probability of publishing t-stats < 6.0 is infinitesimal. Thus it takes a ridiculous amount of p-hacking to publish a single t-stat. These results show that p-hacking alone cannot explain the factor zoo.

Notable quotations from the academic research paper:

"Academics have documented more than 300 factors that explain expected stock returns. This enormous set of factors begs for an economic explanation, yet there is little consensus on their origin. A p-hacking (a.k.a. data snooping, data-mining) offers a neat and plausible solution. This cynical explanation begins by noting that the cross-sectional literature uses statistical tests that are only valid under the assumptions of classical single hypothesis testing. These assumptions are clearly violated in practice, as each published factor is drawn from multiple unpublished tests. In this well-known explanation, the factor zoo consists of factors that performed well by pure chance.

In this short paper, I follow the p-hacking explanation to its logical conclusion. To rigorously pursue the p-hacking theory, I write down a statistical model in which factors have no explanatory power, but published t-stats are large because the probability of publishing a t-stat ti follows an increasing function p(ti). I estimate p(ti ) by fitting the model to the distribution of published t-stats inHarvey, Liu, and Zhu (2016) and Chen and Zimmermann (2018). The p-hacking story is powerful: The model fits either dataset very well.

p-hacking model

Though p-hacking fits the data, following its logic further leads to absurd conclusions. In particular, the pure p-hacking model predicts that the ratio of unpublished factors to published factors is ridiculously large, at about 100 trillion to 1. To put this number in perspective, suppose that 10,000 economists mine the data for 8 hours per day, 365 days per year. And suppose that each economist finds 1 predictor every minute. Even with this intense p-hacking, it would take 15 million years to find the 316 factors in theHarvey, Liu, and Zhu (2016) dataset.

This thought experiment demonstrates that assigning the entire factor zoo to p-hacking is wrong. Though the p-hacking story appears logical, following its logic rigorously leads to implausible conclusions, disproving the theory by contradiction. Thus, my thought experiment supports the idea that publication bias in the cross-section of stock returns is relatively minor."


Are you looking for more strategies to read about? Check http://quantpedia.com/Screener

Do you want to see performance of trading systems we described? Check http://quantpedia.com/Chart/Performance

Do you want to know more about us? Check http://quantpedia.com/Home/About


Follow us on:

Facebook: https://www.facebook.com/quantpedia/

Twitter: https://twitter.com/quantpedia


Continue reading

Three Insights from Academic Research Related to Momentum Strategy

4.April 2019

What are the main insights?

– momentum is not an anomaly in a risk-based asset pricing framework. Riskier assets tend to be in the loser portfolios after (large) increases in the price of risk. The risk of momentum portfolios usually decreases with the prevailing price of risk, and their risk premiums are approximately negative quadratic functions of the price of risk (and the market premium) theoretically truncated at zero.

– changes to market liquidity adds to the explanation of momentum crashes along with the market rebounds, this relationship is driven by the asymmetric large return sensitivity of short-leg of momentum portfolio to changes in market liquidity that flares the tail risk of momentum strategy in panic states

– momentum returns are highly related to market risk arising from return dispersion (RD) as momentum risk loadings and RD risk loadings are similarly priced in momentum portfolios

1/

Author: Souza

Title: A Critique of Momentum Anomalies

Link: https://papers.ssrn.com/sol3/papers.cfm?abstract_id=3341275

Abstract:

This paper offers theoretical, empirical, and simulated evidence that momentum regularities in asset prices are not anomalies. Within a general, frictionless, rational expectations, risk-based asset pricing framework, riskier assets tend to be in the loser portfolios after (large) increases in the price of risk. Hence, the risk of momentum portfolios usually decreases with the prevailing price of risk, and their risk premiums are approximately negative quadratic functions of the price of risk (and the market premium) theoretically truncated at zero. The best linear (CAPM) function describing this relation unconditionally has exactly the negative slope and positive intercept documented empirically.

2/

Authors: Butt, Virk

Title: Momentum Crashes and Variations to Market Liquidity

Link: https://papers.ssrn.com/sol3/papers.cfm?abstract_id=3314095

Abstract:

We document that the variation in market liquidity is an important determinant of momentum crashes that is independent of other known explanations surfaced on this topic. This relationship is driven by the asymmetric large return sensitivity of short-leg of momentum portfolio to changes in market liquidity that flares the tail risk of momentum strategy in panic states. This identification explains the forecasting ability of known predictors of tail risk of momentum strategy such that the contemporaneous increase in market liquidity predominantly sums up the trademark negative relationship between predictors and future momentum returns. Our results are robust using a different momentum portfolio and alternative measures of market liquidity that make a substantial part of the common source of variation in aggregate liquidity.

3/

Authors: Kolari, Liu

Title: Market Risk and the Momentum Mystery

Link: https://papers.ssrn.com/sol3/papers.cfm?abstract_id=3280559

Abstract:

This paper employs the ZCAPM asset pricing model of Liu, Kolari, and Huang (2018) to show that momentum returns are highly related to market risk arising from return dispersion (RD). Cross-sectional tests show that momentum risk loadings and RD risk loadings are similarly priced in momentum portfolios. Comparative analyses find that zero-investment momentum portfolios and zero-investment return dispersion portfolios earn high returns relative to other risk factors. Further regression tests indicate that zero-investment momentum returns are very significantly related to zero-investment return dispersion returns. We conclude that the momentum mystery is explained by market risk associated with return dispersion for the most part.


Are you looking for more strategies to read about? Check http://quantpedia.com/Screener

Do you want to see performance of trading systems we described? Check http://quantpedia.com/Chart/Performance

Do you want to know more about us? Check http://quantpedia.com/Home/About


Follow us on:

Facebook: https://www.facebook.com/quantpedia/

Twitter: https://twitter.com/quantpedia


Continue reading

Three Insights from Academic Research Related to Carry Trade Strategy

27.March 2019

What are the main insights?

– carry trade profitbility depends on the positive order-flow of sophisticated financial customers (hedge funds and asset managers)

– carry trade strategy is profitable, but it is hard to pick correct trading rules ex-ante

– future alpha of a high interest rate currency carry portfolio increases in a trough in a business cycle and in a state of high market uncertainty

1/

Authors: Burnside, Cerrato, Zhang

Title: Foreign Exchange Order Flow as a Risk Factor

Link: https://papers.ssrn.com/sol3/papers.cfm?abstract_id=3275356

Abstract:

This paper proposes a set of novel pricing factors for currency returns that are motivated by microstructure models. In so doing, we bring two strands of the exchange rate literature, namely market-microstructure and risk-based models, closer together. Our novel factors use order flow data to provide direct measures of buying and selling pressure related to carry trading and momentum strategies. We find that they appear to be good proxies for currency crash risk. Additionally, we show that the association between our order-flow factors and currency returns differs according to the customer segment of the foreign exchange market. In particular, it appears that financial customers are risk takers in the market, while non-financial customers serve as liquidity providers.

2/

Authors: Hsu, Taylor, Wang

Title: The Profitability of Carry Trades: Reality or Illusion?

Link: https://papers.ssrn.com/sol3/papers.cfm?abstract_id=3158101

Abstract:

We carry out a large-scale investigation of the profitability of carry trades, using foreign exchange data for 48 countries spanning a period from 1983 to 2016 and employing a stepwise test to counter data-snooping bias. We find that, while we can confirm previous findings that the carry trade is profitable over this long period when a specific carry-trade strategy is selected based on the whole data set, even after controlling for data snooping, when we split the sample into sub-periods, the best carry-trade strategy in one sub-period is generally not profitable in the next sub-period. This finding holds true even when we include learning strategies and stop-loss strategies. Our findings thus highlight the instability of carry trades over long periods and their limitation in the sense that it is hard to predict their performance based on several years of data and therefore to choose a profitable carry-trade strategy ex ante.

3/

Author: Sakemoto

Title: Currency Carry Trades and the Conditional Factor Model

Link: https://papers.ssrn.com/sol3/papers.cfm?abstract_id=3210768

Abstract:

This study employs a conditional factor model in order to investigate the time-varying profitability of currency carry trades. To that end, I estimate conditional alphas and betas on the popular dollar and carry factors through the use of a nonparametric approach. The empirical results illustrate that the alphas and betas vary over time. Furthermore, I find that the alpha of a high interest rate currency portfolio increases in a trough in a business cycle and in a state of high market uncertainty. However, the beta on the dollar factor decreases in these market conditions, suggesting that investors reduce the foreign currency risk exposure.


Are you looking for more strategies to read about? Check http://quantpedia.com/Screener

Do you want to see performance of trading systems we described? Check http://quantpedia.com/Chart/Performance

Do you want to know more about us? Check http://quantpedia.com/Home/About


Follow us on:

Facebook: https://www.facebook.com/quantpedia/

Twitter: https://twitter.com/quantpedia


Continue reading

Subscribe for Newsletter

Be first to know, when we publish new content


    logo
    The Encyclopedia of Quantitative Trading Strategies

    Log in

    MORE INFO
    We boasts a total prize pool of $15,000
    Gain a Share of a Total Prize Pool of $15.000
    MORE INFO
    $15.000
    Gain a Share of a Total Prize Pool