Enhanced Factor Portfolios

30.August 2018

Authors: Blitz, Vidojevic

Title: The Characteristics of Factor Investing

Link: https://papers.ssrn.com/sol3/papers.cfm?abstract_id=3206798

Abstract:

We dissect the performance of factor-based equity portfolios using a characteristics-based multi-factor expected return model. We show that generic single-factor portfolios, which invest in stocks with high scores on one particular factor, are sub-optimal, because they ignore the possibility that these stocks may be unattractive from the perspective of other factors. We also show that differences in performance between (i) integrated and mixed-sleeve multi-factor portfolios, (ii) small-cap and large-cap factor portfolios, and (iii) equal and value-weighted factor portfolios can be fully attributed to the differences in their factor characteristics. We conclude that efficient factor investing requires a recognition and understanding of how factor characteristics drive portfolio returns.

Notable quotations from the academic research paper:

"We show that generic single-factor portfolios, which are strategies that invest in stocks which score highly on one particular factor are generally sub-optimal, because they ignore the possibility that these stocks may be unattractive from the perspective of other factors. The negative contributions from other factors cause these strategies to have a substantial weight in stocks with negative expected and ex-post realized market-relative returns. We also show that some stocks have such poor factor characteristics that their expected returns end up being lower than returns on Treasuries. By simply removing those stocks from the market portfolio ex-ante, the realized market return increases by 16%, in relative terms, over the sample period that spans more than five decades.

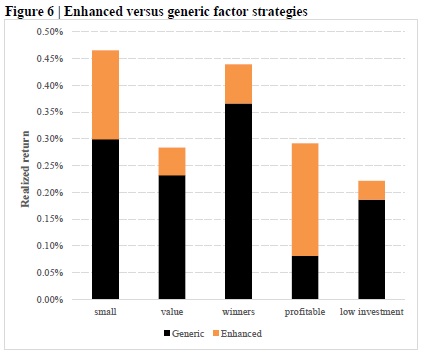
We examine what happens to performance if, each month, we simply remove stocks that have a negative predicted market-relative return from generic factor portfolios. The performance of such enhanced factor strategies is shown in Figure 6. Compared to the generic factor strategies from which they are derived, the performance improvements are about 20% for the value, momentum and investment strategies and about 50% for the small-cap strategy. For the profitability strategy, performance more than triples, from 0.08% to 0.29% per month. This large improvement is not surprising, because a much bigger adjustment is made to this portfolio than to the other factor portfolios. These results imply that generic factor strategies are sub-optimal, and that, even when targeting one particular factor premium, investors should not ignore other established factor premiums.

enhanced premiums

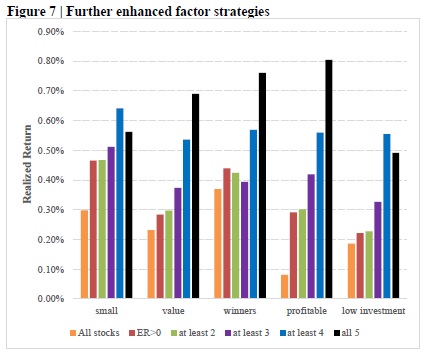
Excluding stocks with expected underperformance helps to enhance a single-factor strategy, but the resulting portfolios can still have stocks with negative exposures to other factors that detract from their performance. We next examine how performance changes if in addition to removing stocks with expected underperformance, we also require stocks to have a non-negative exposure (z-score) to at least one, two, three or four other, non-targeted premiums. Figure 7 shows that realized, full-sample returns of each single factor strategy tend to increase as we require stocks in the portfolios to have non-negative exposures to more factors. For instance, our raw value strategy has a return of 0.23% a month, which increases to 0.28% per month if we ex-ante exclude stocks with negative expected excess returns. If in addition, at the time of portfolio formation, we require that stocks have non-negative exposures to at least two, three, four, and all five factor premiums, the strategy returns increase to 0.30%, 0.37%, 0.54%, and 0.69%, respectively. The number of stocks in the portfolio decreases as we impose more constraints from, on average, 302 with no constraints to 276, 273, 223, 96, and only 13. A similar pattern is observed for other factors, albeit not always monotonic.

enhanced factor premiums 2

Our model is also able to attribute performance differences between integrated and mixed-sleeve multi-factor portfolios to differences in their factor characteristics, and thus resolve the heated discussion in the literature over which approach is better for construction of portfolios with exposures to multiple factors. We further show that return differences between factor portfolios in the small-cap and the large-cap space, and between equally-weighted and value-weighted factor portfolios can also be explained by our model."


Are you looking for more strategies to read about? Check http://quantpedia.com/Screener

Do you want to see performance of trading systems we described? Check http://quantpedia.com/Chart/Performance

Do you want to know more about us? Check http://quantpedia.com/Home/About


Follow us on:

Facebook: https://www.facebook.com/quantpedia/

Twitter: https://twitter.com/quantpedia

Continue reading

What Works (and Doesn’t Work) in Cryptocurrencies

23.August 2018

Authors: Yang

Title: Behavioral Anomalies in Cryptocurrency Markets

Link: https://papers.ssrn.com/sol3/papers.cfm?abstract_id=3174421

Abstract:

If behavioral biases explain asset pricing anomalies, they should also materialize in cryptocurrency markets. I test more than 20 stock return anomalies based on daily cryptocurrency data, and document strong evidence of price momentum. Unlike stock markets, price reversal and risk-based anomalies are weak, controlling for market and size. Cryptocurrency anomalies can be explained by behavioral theories that place more emphasis on the role of speculators than fundamental traders.

Notable quotations from the academic research paper:

"The speculative and hard-to-value nature makes the cryptocurrency market a novel environment that facilitates the study of behavioral impacts on asset prices. Because speculators account for the vast majority of cryptocurrency market participants, the behavioral impact can be stronger than traditional markets. Aside from this, cryptocurrency markets enjoy some good properties: the overall level of investor sophistication in cryptocurrency markets are much lower; there are only a few institutional investors until recently. Thus, mispricing can be severe. Above stylized facts of cryptocurrency markets fit well into many behavioral theories that particularly emphasize investor irrationality. Thus, if asset pricing anomalies can be explained by behavioral theories, they shall also be reflected in cryptocurrency markets.

Having this in mind, I test more than 20 stock price anomalies based on cryptocurrency data.

List of anomalies


Interestingly, anomalies that are commonly recognized as behavior-driven, in particular, price momentum, are also observed in cryptocurrency markets. Price momentum describes the phenomenon that past winner (loser) assets may continue to outperform (underperform) in the future. The momentum effect turns out statistically significant and robust in various aspects. In contrast, risk-based anomalies, for example, return moment risks, are insignificant. The results are not surprising, as if the incentive for holding cryptocurrencies is largely speculative, it is not expected that exposure to certain form of risk earns a premium.

Unlike stock markets, short-term price reversal in cryptocurrency markets is very weak at a daily frequency. No evidence of long-term price reversal is revealed. This empirical finding makes cryptocurrency anomalies distinct from stock market anomalies.

What works

The most plausible explanation of cryptocurrency momentum is given by De Long, Shleifer, Summers, and Waldmann (1990). Their model implies that overconfident noise traders push up the price and create risk that makes fundamental traders reluctant to combat mispricing. If noise traders dominate, overpricing can be even more severe, as is the case of cryptocurrency markets, where speculators play the role of overconfident noise traders. Further, their model does not predict a long-term reversal as long as noise traders remain overconfident. This situation is analogous to cryptocurreny markets and consistent with the empirical findings of this paper. Moreover, their model implies an excessive volatility, another empirical stylized fact of cryptocurrency markets."


Are you looking for more strategies to read about? Check http://quantpedia.com/Screener

Do you want to see performance of trading systems we described? Check http://quantpedia.com/Chart/Performance

Do you want to know more about us? Check http://quantpedia.com/Home/About


Follow us on:

Facebook: https://www.facebook.com/quantpedia/

Twitter: https://twitter.com/quantpedia

Continue reading

Size, Value and Equity Premium Waves

14.August 2018

A new financial research paper has been published and is related to:

#25 – Small Capitalization Stocks (Size) Premium
#26 – Value (Book-to-Market) Anomaly

Author: Herskovic, Kind, Kung

Title: Size Premium Waves

Link: https://papers.ssrn.com/sol3/papers.cfm?abstract_id=3220825

Abstract:

This paper examines the link between microeconomic uncertainty and the size premium across different frequencies in an investment model with heterogeneous firms. We document that the observed time-varying dispersion in firm-specific productivity can account for a large size premium in the 1960's and 1970's, the disappearance in the 1980's and 1990's, and reemergence in the 2000's. Periods with a large (small) size premium coincide with high (low) microeconomic uncertainty. During episodes of high productivity dispersion, small firms increase their exposure to macroeconomic risks. Our model can also explain the strong positive low-frequency co-movement between size and value factors, but a negative relation with the market factor.

Notable quotations from the academic research paper:

"The relation between firm size and expected stock returns has varied signifi cantly over time in waves. Banz (1981) documented a size premium whereby firms with small market capitalizations earn higher expected returns than large ones before 1975, and that this size e ffect cannot be explained by market betas. The size e ffect subsequently vanished starting in the early 1980s to the late 1990s, before reemerging after 2000.

We also observe that measures of microeconomic uncertainty, such as the cross-sectional dispersion in plant- and firm-level total factor productivity (TFP), sales, and payouts, exhibit similar low-frequency patterns as the size premium.

size premium waves

Figure 1 illustrates that microeconomic uncertainty is strongly positively correlated with the size premium. In this paper, we demonstrate how persistent variation in microeconomic uncertainty can potentially rationalize the observed size premium waves.

To this end, we build a dynamic partial equilibrium production model with heterogeneous firms. The model has several distinguishing features. First, firms are subject to persistent idiosyncratic and aggregate TFP shocks with time-varying second moments. The second moment shocks to the idiosyncratic component capture time-varying cross-sectional dispersion in idiosyncratic productivity (microeconomic uncertainty) while the second moment shocks to the aggregate component capture fluctuations in macroeconomic uncertainty. Second, firms face quadratic adjustment costs and operating costs. Third, the representative household has recursive utility de fined over aggregate streams of consumption.

We find that our calibrated model produces a realistic size premium and captures the salient dynamics of the size premium across diff erent frequencies. Namely, the model generates a countercyclical size premium and reproduces the low-frequency wave patterns, including a large spread during 1960-1980, a disappearance between 1980-2000, and resurgence post-2000. The mean-reverting idiosyncratic TFP shocks helps to generate a negative relation between firm market capitalization and expected returns in the stationary distribution.

Small firms are those that have received a recent history of negative idiosyncratic shocks. Due to mean reversion, the shorter-term payouts of small fi rms therefore constitute a smaller share of aggregate payouts relative to their longer-term payouts. With a similar logic, the payout shares of large firms have the opposite pattern. Consequently, small firms are more exposed to aggregate long-run risks than large firms, which gives rise to a quantitatively signi ficant size premium.

The low-frequency fluctuations of the size premium in the model are driven by the persistent volatility process for idiosyncratic TFP shocks. When TFP dispersion is high, small fi rms are subjected to a larger history of negative idiosyncratic shocks that increases their exposure to longrun risks relative to periods with low TFP dispersion. As a result, the size premium is larger during periods of higher TFP dispersion. In the data, we find a very strong association between TFP dispersion and the size premium at low frequencies, consistent with the model predictions. Calibrating the idiosyncratic volatility process to our empirical measure, we show that our model can provide a quantitatively relevant account of the observed size premium waves.

equity premium

micro and macro uncertainity

The equity premium is strongly correlated with macroeconomic uncertainty, as measured by the realized volatility of consumption growth, output growth, and TFP, but negatively related to microeconomic uncertainty at low frequencies. The correlation between the equity premium and macroeconomic uncertainty is 0.76, while the correlation between the equity premium and microeconomic uncertainty is -0.64 (See Figures 3 & 4).

The model also generates signifi cant equity and value premia, inline with the observed magnitudes in the data. Persistent shocks to aggregate productivity growth are a source of long-run risk that help to generate a sizable equity premium when coupled with recursive preferences. Persistent second moment shocks to aggregate productivity growth generate a countercyclical equity premium.

equity premium

The size an value premia are strongly positively related at low frequencies (i.e., correlation of 0.66), but they are both negatively related with the equity premium at low frequencies (correlation between the size premium and the equity premium is -0.62 and the correlation between the value premium and the equity premium is -0.50). Figure 2 provides a visual depiction of these relations.

A value premium arises due to the combination of the asymmetric capital adjustment costs and operating costs, in a similar spirit as Zhang (2005). Firms with high book-to-market ratios have large stocks of capital, but have experienced a recent history of negative idiosyncratic shocks. Therefore, such firms have strong incentives to disinvest due to the low marginal product of capital and high operating costs, but the presence of capital adjustment costs prevents them from selling off their unproductive capital rapidly, which exposes high book-to-market (value) fi rms more to adverse aggregate shocks than low book-to-market (growth) firms. In particular, discouraging aggressive disinvestment policies prevents fi rms with large capital stocks from increasing payouts financed through capital sales in response to negative idiosyncratic shocks. The operating costs that are proportional to the capital stock of the firm reduce the funds available for payouts, especially for large fi rms. Therefore, these investment frictions imply that high book-to-market fi rms have low payout shares today, but higher payout shares at longer horizons due to mean reversion. Therefore, value firms are more exposed to long-run risks than growth firms, thereby generating a sizable value premium. The low-frequency fluctuations of the value premium are driven by the persistent idiosyncratic volatility process."


Are you looking for more strategies to read about? Check http://quantpedia.com/Screener

Do you want to see performance of trading systems we described? Check http://quantpedia.com/Chart/Performance

Do you want to know more about us? Check http://quantpedia.com/Home/About


Follow us on:

Facebook: https://www.facebook.com/quantpedia/

Twitter: https://twitter.com/quantpedia

Continue reading

SSRN Platform Upgrade

10.August 2018

We would like to share an announcement from SSRN (Social Science Research Network) as we link a lot from Quantpedia to a research papers hosted on www.ssrn.com.

"SSRN Platform Upgrade Server Outage this Weekend

We wanted to let you know about a planned outage to SSRN this weekend, which will mean you will not be able to access the site during this period.

The outage will take place from 9am EST Friday 10th August until 9am EST Monday 13th August. Please ensure you download any papers you need before this planned site maintenance.

This outage is to improve the robustness and performance of the platform going forward.

Thank you,
SSRN Team

"

Continue reading

A New Filter Fields in Quantpedia Screener

7.August 2018

As we mentioned several days ago, we have started a really fruitful cooperation with QuantConnect (see our blog post). With the company’s resources and extensive database of historical data, combined with a backtesting engine, QuantConnect was able to start systematically backtesting strategies from our database. So we can finally start showing you out-of-sample backtests for some of our strategies …

Now we are adding a new field into our Screener so that you are now able to filter strategies with QuantConnect code, charts and statistics:

Screener

There are two more fields we are also adding into our Screener subpage:

Free/Premium field allows you to screen and display only Free or Only Premium strategies out of our database …

And Papers field allows you to screen and display only strategies with/without any related research papers …

The QUANTPEDIA Team


Continue reading

An Extensive Test of Market Timing Strategies in the Gold Market

6.August 2018

Authors: Bartsch, Baur, Dichtl, Drobetz

Title: Investing in the Gold Market: Market Timing or Buy-and-Hold?

Link: https://papers.ssrn.com/sol3/papers.cfm?abstract_id=3202658

Abstract:

While the literature on gold is dominated by studies on its diversification, hedging, and safe haven properties, the question “When to invest in gold?” is generally not analyzed in much detail. We test more than 4,000 seasonal, technical, and fundamental timing strategies for gold. While we find large gains in economic terms relative to the buy-and-hold benchmark for several strategies, the results are robust to data-snooping biases only for selected technical trading strategies. These superior technical trading strategies outperform the buy-and-hold benchmark because they shift out of the gold market following a prolonged trend of negative gold market returns. We verify that the outperformance is not driven by a systematic reaction to the broader market environment and conclude that our results point to the presence of behavioral biases inducing gold market trends.

Notable quotations from the academic research paper:

"The question when to invest in gold has received remarkably little attention, while most research focuses on the diversification, hedging, and safe haven properties of gold. This study aims to close this gap by analyzing if an active investor can beat a passive buy-and-hold strategy by timing the gold market. For our evaluation period from January 1990 to December 2015, our back-test results for more than 4,000 different seasonal, technical, and fundamental trading strategies reveal that significant excess returns were possible.

To construct a comprehensive collection of market timing strategies, we build either on the economic properties of gold or incorporate the findings regarding previously surveyed anomalies in gold prices. In this section, we describe the strategies, rules, and variables used to predict gold returns.

Seasonal trading strategies:

Baur (2013) provides evidence for monthly seasonality in the gold market, with positive and statistically significant gold returns limited to the months September and November. Similar results are shown by Qi and Wang (2013) for the Chinese gold market and Naylor, Wongchoti, and Ith (2015) for U.S. gold ETF returns. To exploit this monthly anomaly, an investor could follow a simple strategy that invests in gold in September and November and reverts to holding cash in the remaining months. Although this strategy is supported by economic intuition, e.g., by the increased wedding season gold jewelry demand in India, the strategy itself is merely mechanic. Therefore, to address the concern that this strategy has simply been ‘mined’ from the data, we follow Dichtl and Drobetz (2014) and implement a more comprehensive approach: Each month, an investor can either be invested 100% in the gold market, or 100% in cash. In this vein, we obtain 212 = 4,096 different monthly seasonal allocation strategies, labeled from SEA0 to SEA4095, where SEA stands for seasonal.

Technical trading strategies:

Moskowitz, Ooi, and Pedersen (2012) find time series momentum in monthly returns of several liquid instruments, including gold futures. Therefore, we include monthly technical trading strategies based on moving average and momentum indicators in our empirical analyses. We invest in the gold market if the short moving average is above the long moving average and revert to holding cash otherwise. The short index for the moving average is set to = 1, 2, 3 and the long index to = 9, 12, which results in six moving average strategies. We also set = 1 and = 10, 24, 36, 48 to cover some other parameterizations that are popular in the literature and among investors. Overall, we employ ten different moving average strategies. We invest in gold if the gold market exhibits positive time series momentum. Otherwise, an allocation is taken in the cash market. Following Moskowitz, Ooi, and Pedersen (2012), we set = 1, 3, 6, 9, 12, 24, 36, 48 months.

Fundamental trading strategies:

Building on the economic properties of gold, a lot of researchers identify several fundamental factors that serve as predictors of future gold returns by affecting either the demand and supply of gold or market participants’ expectations thereof. To construct tradeable strategies based on these fundamental factors, we first estimate a simple linear regression model for each predictor variable (11 predictors in total) for forecasts of the spot price of gold. We also exploit the simple mean of all individual forecasts ( ) as another potential market timing strategy. We also consider a “kitchen sink” forecast ( ), which incorporates all available predictor variables simultaneously in a multivariate regression model.

performance of strategies

We measure the performance of our market timing strategies in terms of mean absolute returns and mean risk-adjusted excess returns, or Sharpe ratios (Sharpe, 1994), over the evaluation period. Table 3 lists the five best market timing strategies for each of the three strategy groups, i.e., seasonal trading strategies, technical trading strategies, and fundamental trading strategies.

Overall, while the results in Table 3 already provide a first indication which strategies perform well compared to the buy-and-hold strategy, these analyses neither test for statistical significance nor account for the data-snooping problem.

However, because all timing strategies are tested on the same data set, the observed outperformance may simply result from chance and not due to any robust relationship. To account for this data snooping bias, we apply a multiple testing framework and find that only a limited number of technical trading strategies show a statistically significant outperformance relative to the buy-and-hold strategy.

To assess the statistical significance of performance relative to buy-and-hold, while controlling for data snooping, we use Hansen’s (2005) SPA-test to all three types of strategies. In each test, the strategies are compared with the performance of the buy-and-hold benchmark. Accordingly, the first test considers all 4,095 different monthly seasonal trading strategies,12 the second test all 18 technical trading strategies, and the third test all 15 fundamental trading strategies. The SPA-test results are presented in Table 4.

test SPA

To further examine the characteristics of these superior technical trading strategies, we verify their long-term market timing ability using a conditional market model and preclude that their excess returns are compensation for crash risk, i.e. periods of persistent negative returns. Moreover, we find that the outperformance of these strategies is not driven by different economic and financial regimes. We thus conclude that the superiority of those timing strategies comes from the presence of behavioral biases in the gold market. As pointed out by Hurst, Ooi, and Pedersen (2013), trends emerge if market participants initially underreact to new information, possibly due to anchoring or conservatism. Trend-following strategies, such as time series momentum or moving-average rules, capitalize on the subsequent price changes, since the market price only gradually incorporates the full effect of the news. Once a trend has started, a delayed over-reaction may even exacerbate the trend, e.g., due to herding behavior, feedback trading, or biased self-attribution."


Are you looking for more strategies to read about? Check http://quantpedia.com/Screener

Do you want to see performance of trading systems we described? Check http://quantpedia.com/Chart/Performance

Do you want to know more about us? Check http://quantpedia.com/Home/About


Follow us on:

Facebook: https://www.facebook.com/quantpedia/

Twitter: https://twitter.com/quantpedia

Continue reading

Subscribe for Newsletter

Be first to know, when we publish new content


    logo
    The Encyclopedia of Quantitative Trading Strategies

    Log in

    MORE INFO
    We boasts a total prize pool of $15,000
    Gain a Share of a Total Prize Pool of $15.000
    MORE INFO
    $15.000
    Gain a Share of a Total Prize Pool