VVIX Index Predicts Value/Growth Return Spread
A new financial research paper has been published and is related value/growth style returns:
#26 – Value (Book-to-Market) Anomaly
Author: Krause
Title: Risk and Uncertainty in Style Rotation
Link: https://papers.ssrn.com/sol3/papers.cfm?abstract_id=3209491
Abstract:
The effectiveness of the VIX index as a leading indicator of style returns has been examined in the finance literature, finding that increases in this “fear index” lead to outperformance of “value” vs “growth” stocks, although the effect has attenuated over time. This study introduces the concept of “uncertainty” as an additional indicator of returns to value, as measured by the CBOE® VVIX (“volatility of volatility”), that that may be considered as a proxy for “uncertainty” in the Knightian sense. Increases in uncertainty (the VVIX index) lead to negative short-term returns to value. Additional macroeconomic variables provide additional incremental information regarding these phenomena.
Notable quotations from the academic research paper:
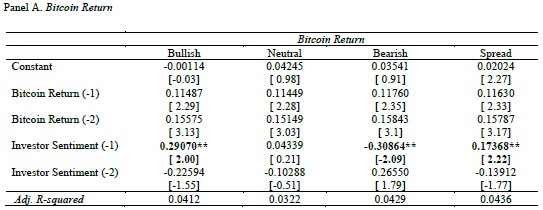
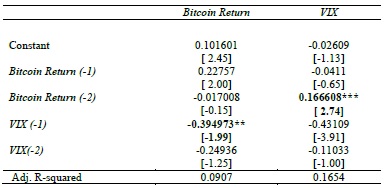
"this study examines the effectiveness of the two CBOE® volatility indices as leading indicators of style returns (value vs. growth), and the results of the analysis indicate that the CBOE® VVIX index provides significant incremental information regarding the interaction of returns, volatility, and uncertainty on a lead-lag basis. The initial analysis of the VIX index relative to style returns is consistent with Boscaljon et al. (2011) since it finds largely insignificant short-term effects of the VIX index on returns to value.
However, innovations in the VVIX index indicate significant negative returns to value. The inclusion of several macroeconomic variables provides additional explanatory information since the VIX index indicates positive returns to value under certain conditions. The main contribution to the literature of this paper is the introduction of the additional concept of “uncertainty” into the returns to value analysis using highly liquid ETFs. The availability of these products, and their recent exponential growth, provides an opportunity to examine the relation of expected volatility and uncertainty to growth and value using similar, easily tradable and low-cost instruments.
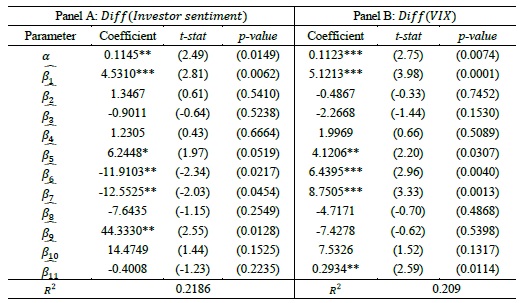
In order to further explore the returns to value from uncertainty as proxied by the VVIX index, in Table 5, changes in the VVIX index are included in the estimations of Equation 2 as a potentially further explanatory, independent variable. In this estimation, there is one indication of the potential returns to value from volatility in conjunction with uncertainty. In Panel A, for the large-cap ETFs, the results for five-day returns to value are significantly positive for changes in the VIX index (volatility) at the five percent level, although some other coefficients (10- and 20- day) are significant at the ten percent level. Additionally, the coefficients are significant and negative for changes in the VVIX index (uncertainty) over five- to thirty-day time periods (the 20-day coefficient is marginally significant) at the five percent level.

"
Are you looking for more strategies to read about? Check http://quantpedia.com/Screener
Do you want to see performance of trading systems we described? Check http://quantpedia.com/Chart/Performance
Do you want to know more about us? Check http://quantpedia.com/Home/About
Follow us on:
Facebook: https://www.facebook.com/quantpedia/
Twitter: https://twitter.com/quantpedia

