Can Google Trends Sentiment Be Useful as a Predictor for Cryptocurrency Returns?
Introduction
In the fast-paced world of cryptocurrencies, understanding market sentiment can provide a crucial edge. As investors and traders seek to anticipate the volatile movements of Bitcoin, innovative approaches are continuously explored. One such method involves leveraging Google Trends data to gauge public interest and sentiment towards Bitcoin. This approach assumes that search volume on Google not only reflects current interest but can also serve as a predictive tool for future price movements. This blog post delves into the intricacies of using Google Trends as a sentiment predictor, exploring its potential to forecast Bitcoin prices and discussing the broader implications of sentiment analysis in the financial market.
Related Literature
We especially liked older paper by Wang, (2018), where he used media news as a proxy for attention from the information supply side and Google search as a proxy for attention from the information demand side.
- They showed that attention significantly impacts financial markets when the supply and demand side of attention moves in the same direction.
- A portfolio of buying stocks with both attention up and short-selling stocks with both down generates 17% annual abnormal returns.
- This finding indicates that the media is only essential to the financial market when investors are willing to be affected.
- Furthermore, the attention measure is less subject to the estimation bias.
Cryptocurrency anomalies can be explained by behavioral theories emphasizing noise trader risks rather than fundamental ones. (Yang, 2019) in his Behavioral Anomalies in Cryptocurrency Markets, they examined and observed that if behavioral biases explain asset pricing anomalies, they are to also materialize in cryptocurrency markets within testing over 20 stock return anomalies based on daily cryptocurrency data and document strong evidence of price momentum, which is statistically significant.
In our own house research, we also found some evidence for trend-following and mean-reversion effects.
Of course, the strong influence of sentiment and news got its way into crypto markets and, to some extent, is driven and even exacerbated by retail investors. Here, we will present two articles from our blog that summarize the importance of the sentiment and news on the cryptocurrency’s market price action:
Main Part of Research
Source of Data
The selected measure of sentiment is Google Trends because it is free and respected as an objective source of data and information about the popularity of any topic. It is often used (for example, in social science studies), easy to analyze and readily available, more accessible than any other news-based sentiment measures (which are often also paid).
Methodology
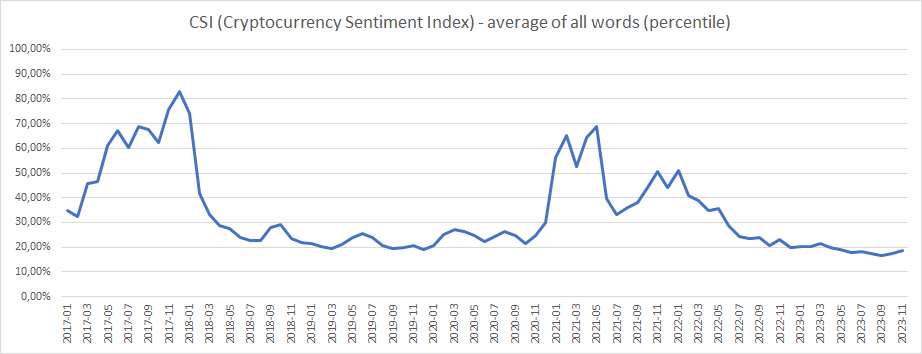
Inspired by the above-mentioned research, we created the Crypto Sentiment Index (CSI), built as the equally weighted average of the normalized search interest over time for a list of keywords related to the cryptocurrency market. Our sentiment index is constructed using the following keywords (separated by a comma):
blockchain, nft (or non fungible token), bitcoin, ethereum, crypto, cryptocurrency, hodl, altcoin, defi (decentralized finance), fomo, initial coin offering, stablecoin, mining pool, pump and dump, satoshi nakamoto, bitcoin mining, shitcoin
We started collecting data in January 2004, and our sample ends in October 2023. However, for each keyword, we need to recalculate Google Trends’ “relative measure of interest at the end of the sample (October 2023)” to the “relative measure of interest in each month.” Why do we need to do that?
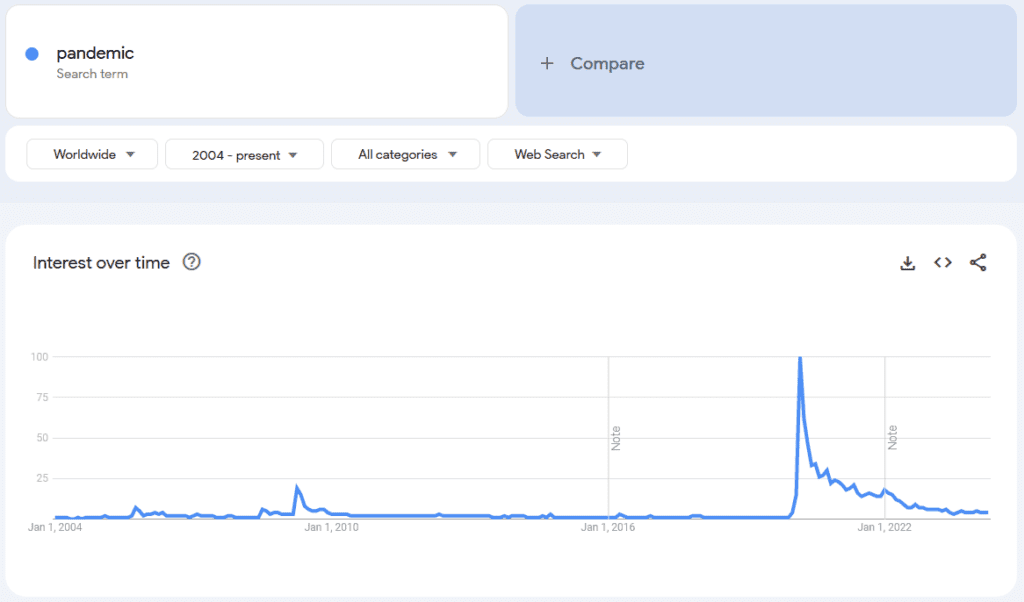
Google Trends returns data in the form of % as the relative interest in the topic over time. Imagine that you want to gauge the relative interest of the people using Google Search for the word “pandemic” in October 2023. When you download the data from Google Trends, there is a notable peak for the word in the year 2020, which is understandable (COVID-19 pandemic). Google Trends shows that the interest in the word “pandemic” in October 2023 was 4% of the peak (March 2020, when it hit 100%). The 4% in October 2023 is the correct measure of interest (sentiment) compared to the highest peak that was experienced.
But what about the interest (sentiment) of 3% that was experienced in April 2016? It is the correct measure of the interest in the word “pandemic” after the March 2020 COVID-19 peak. However, in April 2016, COVID-19 didn’t exist. The 3% interest/sentiment number in April 2016 can’t be compared to the peak of March 2020. We must rescale/recalculate this interest (sentiment) to the highest experienced peak in data up to that date. The highest peak in interest in the word “pandemic” before April 2016 was experienced in April 2009 (16% of the COVID-19 peak from March 2020). Therefore, the correct measure of interest (sentiment) for April 2016 isn’t 3%, but rather 3% * 100/16 = 18.75%.
In April 2016, Google Trends showed that interest in the word “pandemic” was ~19%, and the highest peak in data in April 2009 showed 100% interest. In October 2023, Google Trend showed that interest in the word “pandemic” was ~3%, the highest peak in data in March 2020 showed 100% interest and April 2016 peak was just 16%.
We hope you now understand the necessity to pre-process the Google Trends data for each selected cryptocurrency keyword for each month before averaging the interest/sentiment measures into one equally-weighted measure.
So, how did we do it? For each keyword, we used the initial period of January 2004 to January 2017 as the “measuring period”, found the maximum number in the data, and recalculated what’s the January 2017 interest/sentiment number to the peak up to that date. Then, we iteratively increased the “measuring period” month by month and recalculated/normalized each month’s interest/sentiment to the measuring window’s peak. This way, we created a “relative measure of interest in each month“, and we then equally weighted numbers for each keyword to produce the final Crypto Sentiment Index (CSI). And this is how the resultant index look like:
Trading Model
Our research idea is to investigate the influence of sentiment change on Bitcoin price. Since earlier studies have shown that sentiment measure is not the only factor that influences Bitcoin prices, we tried to find a relationship with a combination of sentiment and trend.
This is our benchmark performance: pure plain performance of Bitcoin (BTC) during the considered period:
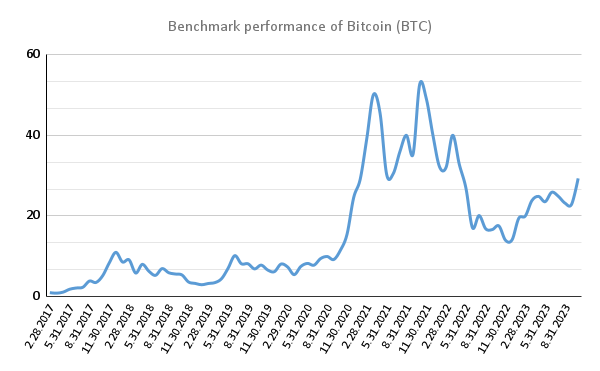
(On the y-axis, you can find its price in thousands of USD [$].)
We test trading strategy on a monthly data and the trading decision is always made at the end of the month. Now, we have four scenarios we considered, and we will briefly introduce and explain their meaning:
- Rule A – If the monthly sentiment change is positive AND BTC’s monthly price change also has a positive value, then we buy one unit of BTC and hold it for one month. Otherwise, we do not have any position.
- Rule B – It is the same as A, but the sentiment should NOT be positive, then we are investing in BTC.
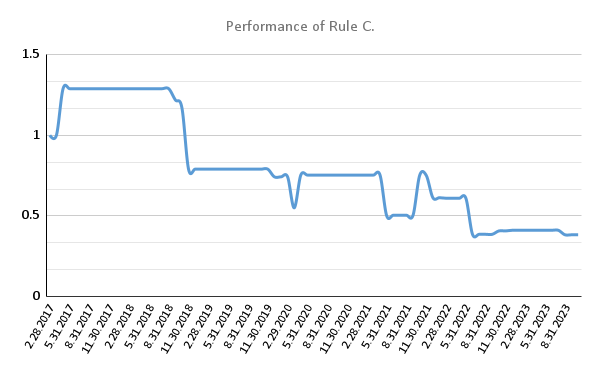
- Rule C – It is the same as A, but the price now should NOT be positive, then we are investing in BTC.
- Rule D – It is completely negative of A. If both sentiment change AND price change are negative, invest in BTC for the next month. If one of them is positive or both are positive, then do not hold any position.
So, how did each of those rules perform? Let’s just go straight into the evaluation! The Y-axis now shows an appreciation of $1 invested into each strategy variant based on the rules described earlier.
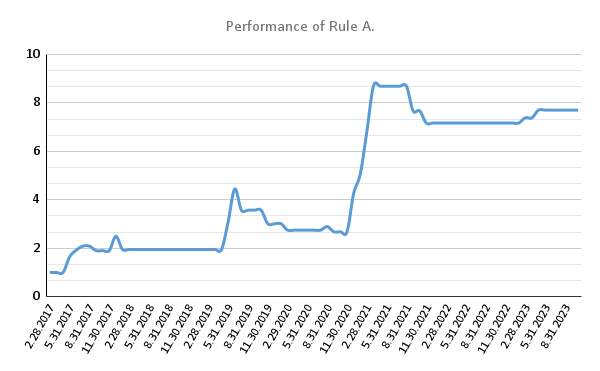
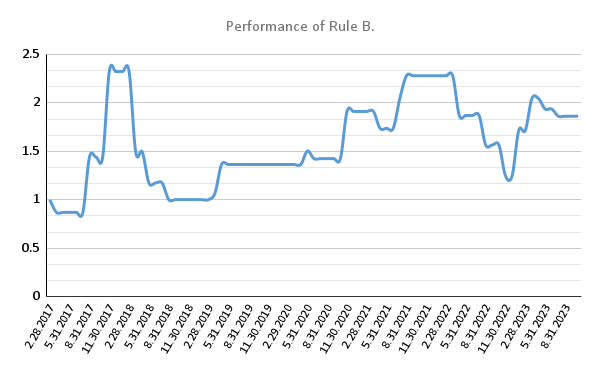
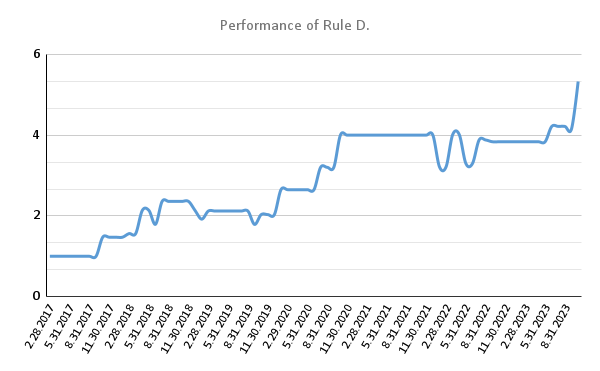
It is not hard to see that the best combination is when past sentiment and past price trend are both positive. Alternatively, we can try to extract performance from short-term reversal factors – sentiment and past performance are simultaneously negative. Therefore, as a final strategy, we chose the combination of A + D.
Now, we can compare the final strategy with the Buy & Hold (HODL) approach of Bitcoin.
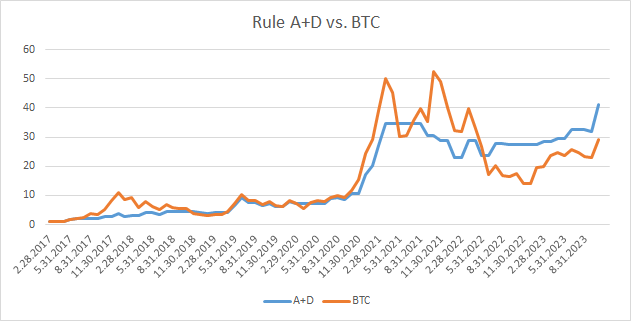
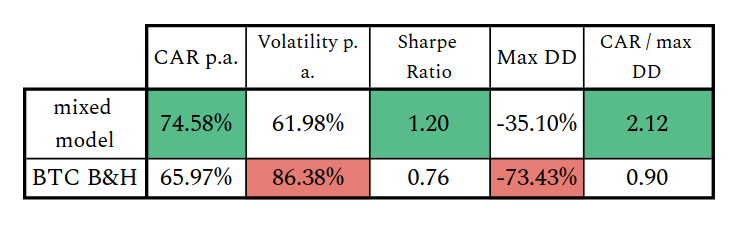
The mixed A+D model is the winner, with better performance and risk metrics. The resultant strategy achieves nice participation in the BTC price runups when the sentiment and price trends point in the same direction. Additionally, it quickly invests in the mean reversion scenarios when the price and sentiment are both negative, which helps it retain a significant part of the BTC performance (even outperforming). Tactical switch out of the BTC market when the sentiment and trend signals do not agree helps to decrease the risk (volatility and drawdowns). Overall, it seems that sentiment measures can be an interesting predictor in the mostly retail-driven crypto markets. Adding the sentiment signal to the pure price signal may help improve models based on past performances.
Author:
Lukáš Zelieska, Quant Analyst, Quantpedia.com
Cyril Dujava, Quant Analyst, Quantpedia.com
Are you looking for more strategies to read about? Sign up for our newsletter or visit our Blog or Screener.
Do you want to learn more about Quantpedia Premium service? Check how Quantpedia works, our mission and Premium pricing offer.
Do you want to learn more about Quantpedia Pro service? Check its description, watch videos, review reporting capabilities and visit our pricing offer.
Do you want algorithmic access to the full Quantpedia database via the API? Subscribe to Quantpedia Pro, ask for an API key, and explore the in/out-of-sample statistics, source academic papers, and code snippets — ideal for quantitative research, systematic trading workflows, and AI model training.
Are you looking for historical data or backtesting platforms? Check our list of Algo Trading Discounts.
Or follow us on:
Facebook Group, Facebook Page, Telegram, Twitter, Linkedin, Medium or Youtube
Share onLinkedInTwitterFacebookRefer to a friend


