Factor Performance in Bull and Bear Markets
Do common equity factors suffer during bear markets? Undoubtedly, the market factor is a rather unpleasant investment during bear markets, but what about the long-short factors? Are they able to deliver performance? The research paper by Geertsema and Lu (2021) provides several answers and interesting insights.
Returns of value, profitability, investment, and momentum are highly positive and statistically significant during bear markets. Apart from the market factor, the only factor that suffers is size. Furthermore, the performance of factors is lower during “good” times. We have already empirically identified these phenomena in the paper The Active vs Passive: Smart Factors, Market Portfolio or Both?, where the strategy shifts from market to factors during market factor drawdowns and helps to protect the portfolio and gains greater exposure to the market in the “good” times. In a nutshell, the key takeaway is that factors outperform during crises and underperform during bull markets. The paper dives deeper and identifies the reasons for these observations.
The main reason is connected with duration. The increase in risk premia during bear markets reduces the value of long-duration stocks more than the short duration stocks. The authors hypothesize that duration risk explains the counter-cyclical risk premia of factors and prove it by constructing a duration factor that can explain the factor profits during a bear market. The research also examines the role of financial constraints but compared to the duration, their ability to explain the outperformance is weak. Constraints can only explain the bear market returns of the profitability factor. Last but not least, apart from the main results, the authors also provide results for other recognized factors such as I2A, ROE, EG, Long-term reversal, HLM, or BAB, which are also more profitable during bear markets.
Authors: Paul Geertsema and Helen Lu
Title: Where is the risk in risk factors?
Link: https://papers.ssrn.com/sol3/papers.cfm?abstract_id=3966127
Abstract:
The value, profitability, investment and momentum factors are all more profitable in bear markets than in bull markets. This contradicts the predictions of consumption based models of risk. We hypothesise that this pattern can be explained by state-dependent exposure to duration and financial constraint risks in bear markets. We find that equity cash flow duration subsumes bear market premia of the value, profitability, investment and (to a lesser extent) momentum factors. Moreover, duration factors are not subsumed by other factors. In contrast, financial constraint factors only explain the profitability factor in bear markets.
As always we present several interesting figures:
Notable quotations from the academic research paper:
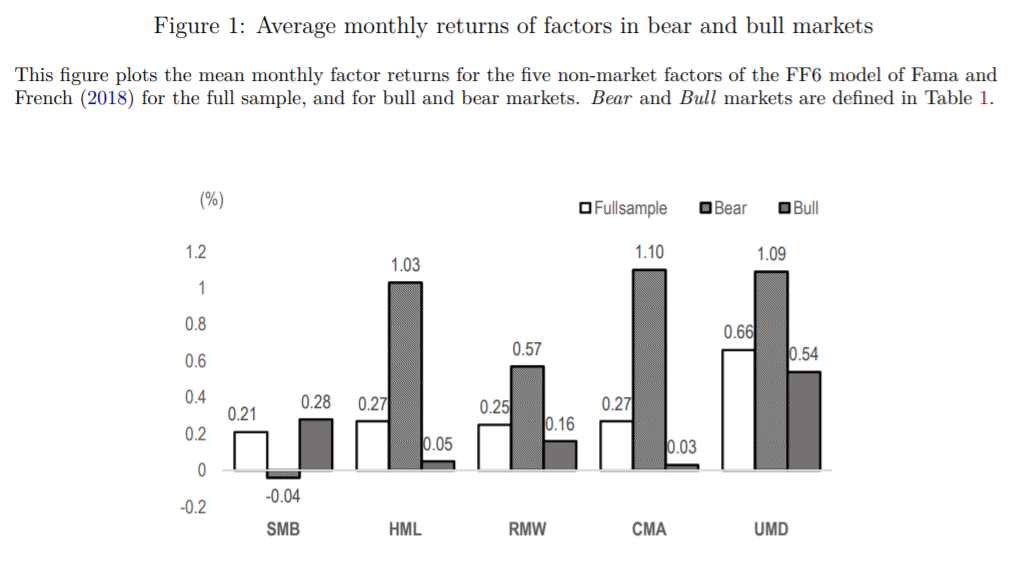
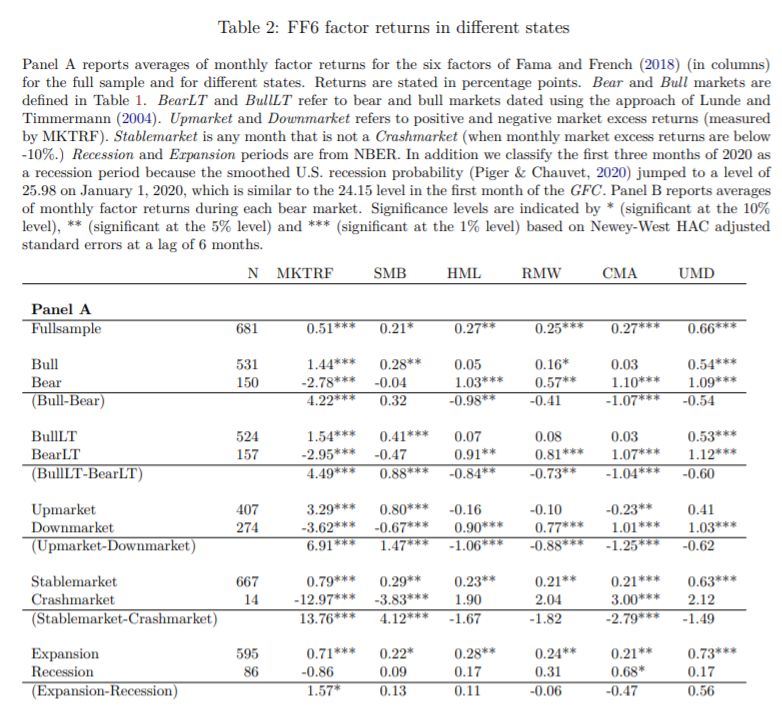
We investigate whether duration risk and financial constraint risk can explain the state-dependent performance of risk factors. We proxy for bad states with the bear market phases of stock markets (hereafter bear markets, based on Nyberg, 2013). Surprisingly, four of the five non-market factors from the Fama and French (2018) six-factor model (FF6) make more money in bear markets than in bull markets. The SMB size factor is the only exception. Returns from investing in the value, profitability, investment and momentum factors (HML, RMW, CMA and UMD) are highly positive and significant in bad states. By contrast, their average returns in good states are either close to zero (for HML and CMA) or less than one-third to one-half of their average returns in bad states (for RMW and UMD). The size factor (SMB) is the only non-market factor that loses money in bear markets
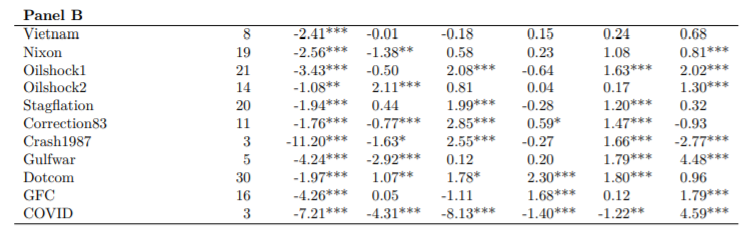
The expected market risk premium (ERP) tends to increase dramatically in bear markets (see Table 1). The ERP increased in all of the 11 bear markets, with increases ranging from 0.62 and 3.88 percentage points per annum. By contrast, the ERP often stays at lower levels in bull markets than in bear markets. The persistent increases in risk premia in bear markets reduce the value of long-duration stocks more than short-duration stocks, because long-duration stocks are more sensitive to changes in discount rates. We posit that duration risk explains the counter-cyclical risk premia of the value, profitability, investment and momentum factors. We find that the duration of stocks on the long side of SMB, HML and CMA are significantly shorter than those on the short side. This difference is consistent with a duration-based explanation of the bear market profits earned by these factors. To test whether duration does indeed explain the bear market premia earned by these factors, we construct a duration based factor following the same approach used to construct the Fama-French CMA factor in Fama and French (2018) (refer to Section 5 for the detail of portfolio construction). DURG and DUR refer to the duration factors based on duration measures from Gonçalves (2021) and Dechow et al. (2004), respectively. Similar to HML, RMW, CMA and UMD, the DURG and DUR factors also almost all of their profits in bear markets. Monthly returns from DURG and DUR average 1.77% and 1.06% each in bear market. However, their profits in bull markets average around zero. We find that the DURG factor subsumes the bear-market profits of the value (HML), profitability (RMW), investment (CMA) and momentum (UMD) factors. The DUR factor also renders almost all factors insignificant and explains a substantial portion of the bear-market profits from CMA and UMD factors. Importantly, the factors themselves do not subsume DURG in bear markets. The bear-market profit from the DUR factor is only subsumed by the CMA factor.
Widening credit spreads might force financially constrained firms to scale back their operations more aggressively. For example, financially constrained firms that face tightening external financing conditions may have to delay expansion plans or curtail sales to limit working capital demands. We find limited evidence for the mechanism described above. We construct two financial constraint indices, namely, the WW Index based on Whited and Wu (2006) and the HP Index based on Hadlock and Pierce (2010). We refer to the financial constraint factors based Whited and Wu (2006) and Hadlock and Pierce (2010) as FCWW and FCHP, respectively. Consistent with FarreMensa and Ljungqvist (2016), we show that firms in the small, value, weak (less-profitable) and aggressive (high-investment) portfolios are more financially constrained on average than firms in the large, growth, strong and conservative portfolios. Financial constraint factors (which buy financially constrained stocks and sell unconstrained stocks) are profitable in bull markets but loss-making in bear markets; this stands in contrast to the duration factors because duration factors make all their profits in bear markets. Financial constraint factors (FCWW and FCHP) only subsume the RMW factor in bear markets and leave the other factors intact. Moreover, the financial constraint factors are themselves subsumed by the HML factor and the CMA factor, as well as by the duration factors. This suggests that financial constraints at most plays a minor role in explaining bear market factor profitability.
Are you looking for more strategies to read about? Sign up for our newsletter or visit our Blog or Screener.
Do you want to learn more about Quantpedia Premium service? Check how Quantpedia works, our mission and Premium pricing offer.
Do you want to learn more about Quantpedia Pro service? Check its description, watch videos, review reporting capabilities and visit our pricing offer.
Do you want algorithmic access to the full Quantpedia database via the API? Subscribe to Quantpedia Pro, ask for an API key, and explore the in/out-of-sample statistics, source academic papers, and code snippets — ideal for quantitative research, systematic trading workflows, and AI model training.
Are you looking for historical data or backtesting platforms? Check our list of Algo Trading Discounts.
Or follow us on:
Facebook Group, Facebook Page, Telegram, Twitter, Linkedin, Medium or Youtube
Share onLinkedInTwitterFacebookRefer to a friend


