How Does Weighting Scheme Impact Systematic Equity Portfolios?
How often do you think about the weights of the assets in your portfolio? Do you weigh your assets equally, or do you prefer value-weighting? The researchers behind a recent research paper analyzed various weighting schemes and examined their effect on factor strategy return. They studied five weighting schemes that ignore prices: equal weighting, rank weighting, z-score weighting, inverse volatility weighting, and fundamental weighting, and three price-based weighting schemes: Rank x mcap (rank-times-mcap), Z-score x mcap (z-score-times-mcap), and Integrated core.
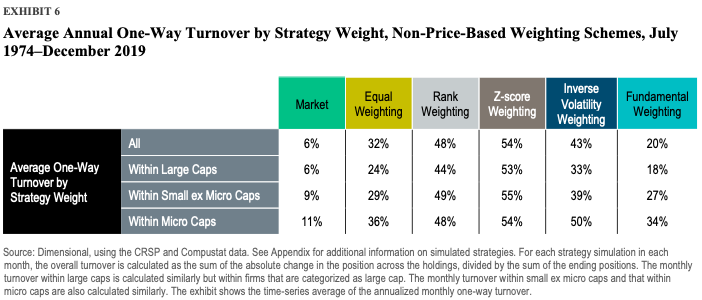
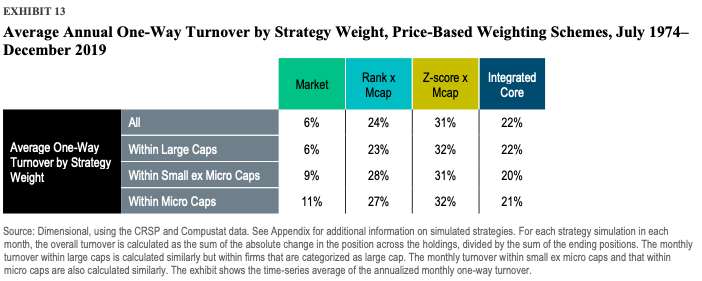
They found that schemes that are not based on price can inflate turnover and costs. However, the weighting schemes based on price are the most practical to target multiple premiums, provide robust risk control, and decrease turnover and expenses.
Overall, the paper confirms a strong tie between market prices and security weights. The authors conclude that the weighting schemes which ignore prices result in uncontrolled deviations relative to the market. On the other hand, even though the price-based weighting schemes require additional expertise, they are a “must-have,” according to the authors. Additionally, the weighting schemes based on price effectively integrate multiple premiums.
Authors: Wei Dai, Namiko Saito, Gigi Wang
Title: Weighting for the Right One: Weighting Scheme Design for Systematic Equity Portfolios
Link: https://papers.ssrn.com/sol3/papers.cfm?abstract_id=4016481
Abstract:
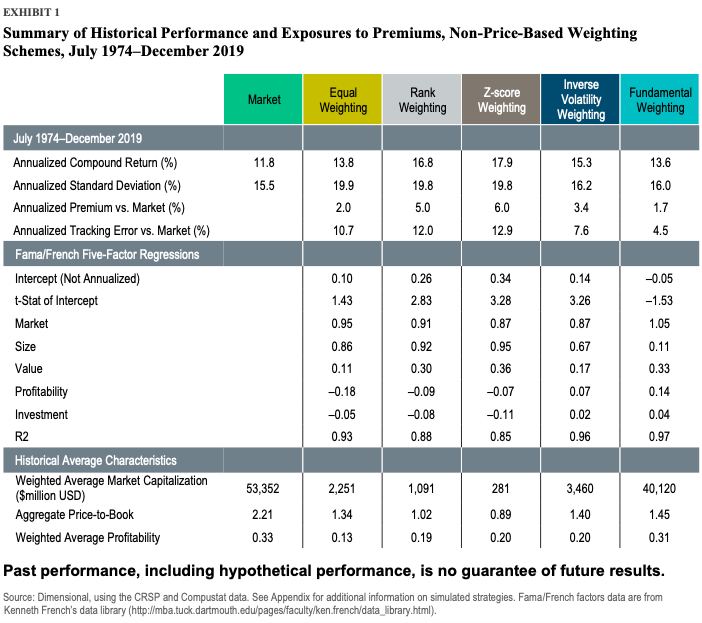
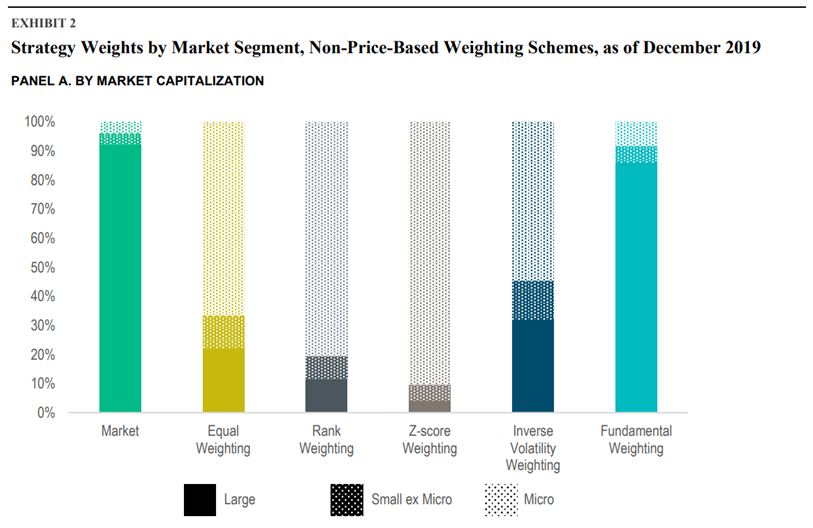
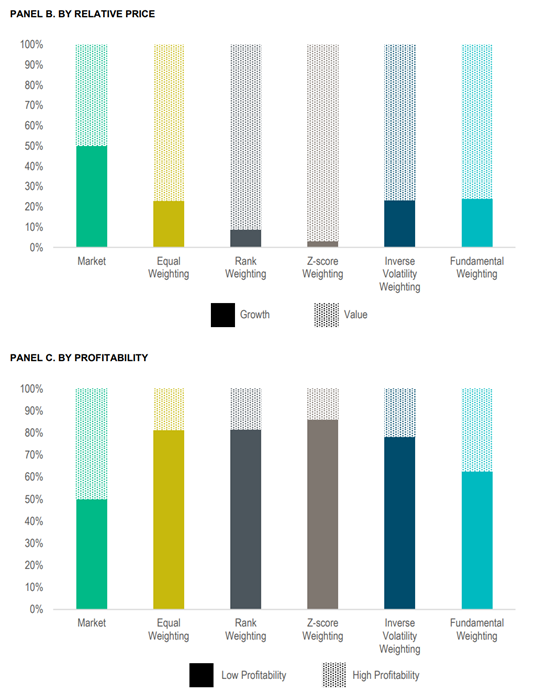
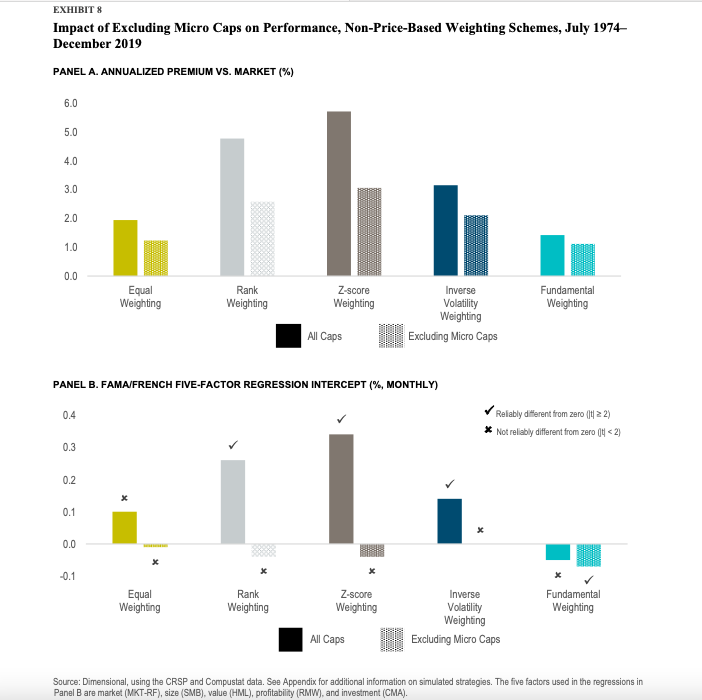
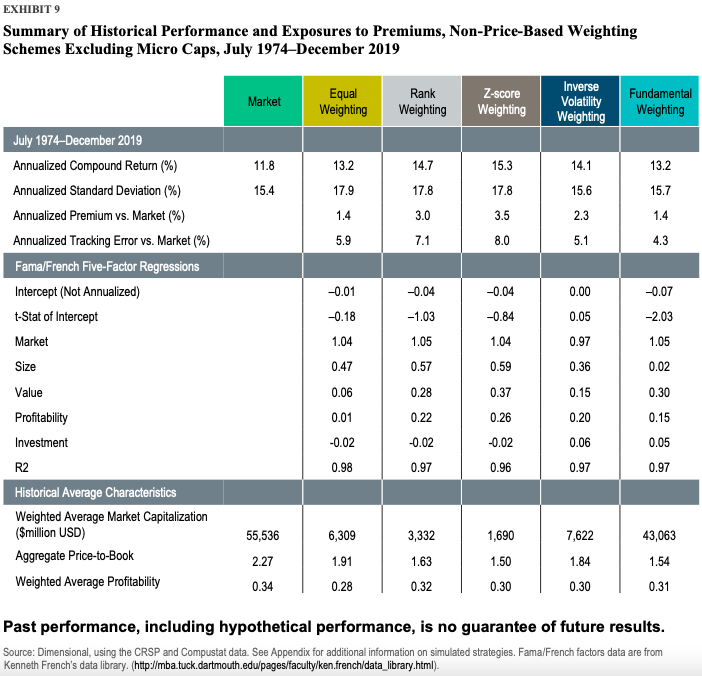
We examine eight weighting schemes frequently used in the construction of systematic equity strategies. Through the lens of both returns- and holdings-based analysis, we highlight the importance of having a close link between security weights and market prices. Ignoring prices, as in the cases of equal weighting, rank weighting, z-score weighting, inverse volatility weighting, and fundamental weighting, can result in extreme and uncontrolled deviations relative to the market, as well as excessive turnover and costs. Furthermore, our analysis of three price-based weighting schemes identifies the integrated core approach as the most effective at targeting multiple premiums, ensuring robust risk control, reducing turnover and costs, and accounting for different investor objectives and practical considerations.
As always, we present several interesting figures:

Notable quotations from the academic research paper:
“A key aspect of a well-designed weighting scheme is the link between security weights and market prices. Current market prices reflect the latest news and aggregate expectations of market participants, providing real-time information about expected return differences across securities. By closely tying weights to prices, investors can effectively consider up-to-date information and target higher expected returns. Such a weighting scheme also acts as a robust risk control, allowing investors to directly manage the over- and underweights relative to market cap weights. Without a close tie to market prices, continuous price movements can drive up turnover and the costs of maintaining desired security weights. Price-based weighting schemes help limit those costs by continuously and gradually adjusting security weights as prices change.
Weighting Schemes That Ignore Prices
- Equal weighting: All firms are held at the same weight.
- Rank weighting: Firms are ranked from 1 to N, with N being the total number of firms, based on independent univariate sorts on their market capitalization (from large to small caps), relative price (from growth to value), and profitability (from low to high profitability). That is, smaller, deeper value, or more profitable firms have higher ranks, while larger, growthier, or less profitable firms have lower ranks. We re-rank the firms according to their average ranks across those three independent sorts, which makes for gradual changes in the weights across firms and avoids abrupt changes.1 Firms are then weighted in proportion to their final ranks.
- Z-score weighting: We first calculate each firm’s market capitalization, relative price, and profitability z-scores, defined for each dimension as the corresponding characteristic’s raw value minus its cross-sectional average, divided by its cross-sectional standard deviation. The z-scores are then transformed into a value between 0 and 1 using the cumulative distribution function of the standard normal distribution.2 The transformed z-scores are bigger (closer to 1) for smaller, deeper value, or more profitable firms, and smaller (closer to 0) for larger, growthier, or less profitable firms. Finally, firms are weighted in proportion to the product of their transformed z-scores, which still ranges from 0 to 1.
- Inverse volatility weighting: Firms are weighted in proportion to the inverse of their return volatility, where volatility is calculated as the standard deviation of daily returns over the trailing 60 trading days (with a minimum of 20 trading days). That means firms with lower recent volatility are held at larger weights, while more volatile names are assigned smaller weights.
- Fundamental weighting: Firms are weighted in proportion to their “economic footprint,” measured as the sum of book equity, sales, and cash flow in the latest fiscal year.
Price-Based Weighting Schemes
- Rank x mcap (rank-times-mcap): Firms are weighted in proportion to their final ranks (defined the same as above for rank weighting) multiplied by their market capitalization.
- Z-score x mcap (z-score-times-mcap): Firms are weighted in proportion to the product of their transformed z-scores (defined the same as above for z-score weighting) multiplied by their market capitalization.
- Integrated core: Firms are independently sorted on their market capitalization, relative price, and profitability. The intersections of this three-way sort form groups of firms with similar characteristics. For example, mega cap firms with higher relative price and higher profitability form one group, while mega cap firms with higher relative price but lower profitability form another group. Within each group, firms are held in proportion to their market capitalizations. Each group is weighted in proportion to its total market capitalization times a multiplier, where the multiplier effectively controls the group’s over- or underweight relative to the market and gradually increases as we move from groups with lower expected returns to those with higher expected returns. The multipliers used in this study are designed to achieve a moderate and balanced emphasis on the size, value, and profitability premiums while accounting for the interactions among them. ”
Are you looking for more strategies to read about? Sign up for our newsletter or visit our Blog or Screener.
Do you want to learn more about Quantpedia Premium service? Check how Quantpedia works, our mission and Premium pricing offer.
Do you want to learn more about Quantpedia Pro service? Check its description, watch videos, review reporting capabilities and visit our pricing offer.
Do you want algorithmic access to the full Quantpedia database via the API? Subscribe to Quantpedia Pro, ask for an API key, and explore the in/out-of-sample statistics, source academic papers, and code snippets — ideal for quantitative research, systematic trading workflows, and AI model training.
Are you looking for historical data or backtesting platforms? Check our list of Algo Trading Discounts.
Or follow us on:
Facebook Group, Facebook Page, Telegram, Twitter, Linkedin, Medium or Youtube
Share onLinkedInTwitterFacebookRefer to a friend


