How to Combine Different Momentum Strategies
Today we will again talk more about the portfolio management theory, and we will focus on techniques for combining quantitative strategies into one multi-strategy portfolio. So, let’s imagine we already have a set of profitable investment strategies, and we need to combine them. The goal of such “strategy allocation” usually is to achieve the best risk-adjusted return possible. There is no single correct solution to this task, but there are a few methods that we can try.
The “appropriate combination” highly depends on the type of strategies we are about to combine. Are we combining equity and bond strategies together? Are we combining equity strategies, with each one having an entirely different logic? Or do we rather need to assign weights to strategies that are similar in nature yet still different? We will focus this article on the last option – combining similar yet different strategies.
Quantpedia Pro offers several easy-to-use tools to instantly analyze various popular strategy allocation methods, and it can save you some coding as numerous asset allocation methods are already pre-coded there for you to try. Different variants of Risk Parity, Volatility Targeting, CPPI, Markowitz Mean-Variance optimization, or Clustering are all part of the toolbox, so let’s now take a look at an example use case.
Equity Momentum Strategies
As we already mentioned above, we will focus today on equity momentum strategies. More specifically, we will be analyzing and combining 5 different US stock momentum strategies:
- Momentum Factor Effect in Stocks
- Residual Momentum Factor
- Trend-following Effect in Stocks
- Overlapping Momentum Portfolios
- Similar Stock Short-term Momentum
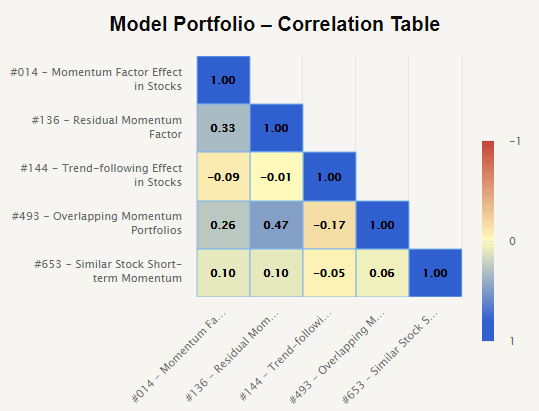
All of the above mentioned strategies utilize the idea of momentum and apply it to US single stock universe, however, each one in a different way. As it may be observed from the Quantpedia Pro’s correlation report below, some of the strategies are not even positively correlated, while some of them are slightly positively correlated.
| Algo Trading Data Discounts are available exclusively for Quantpedia’s readers. |
To briefly sum up the logic – the first strategy looks at the traditional long-short momentum, the second strategy uses regression residuals instead of classical price momentum, the third strategy is long-only and buys only stocks at their historical highs, the fourth strategy combines different momentum horizons into a more concentrated portfolio and the last strategy is based on the “peer momentum” of the most related stocks based on their fundamentals.
As we can see from the above – the strategies are somewhat similar, yet not entirely. How to combine such strategies? And how to benchmark them?
Equal Weight Strategy Allocation
One of the most straightforward benchmarks for strategy allocation is simply weighing the strategies equally. With 5 strategies this makes for an easy equal 20% allocation for each strategy. Our benchmark for further calculations will be an equal weighted strategy benchmark.

The figure above depicts the equity curve and basic risk and return statistics of our 5 strategies combined via equally weighted allocation.
Advanced Strategy Allocation Methods
We picked here five examples of strategy allocation methods and show here what results they produce when applied to five US stock momentum strategies. The methods are the following:
Simple Volatility Targeting. Quantpedia Pro toolbox provides several different volatility targeting methods. For the sake of brevity, we will be reporting here only the basic volatility targeting. The basic version is applied at the portfolio level to the entire – equally weighted – portfolio of our 5 strategies. For more details about the methodology, see Quantpedia’s Volatility Targeting Primer.
Equal Risk Contribution. Once again, Quantpedia Pro portfolio analysis offers various different risk parity methods, which are ready-to-be-applied to your data. The first risk parity method we picked as an illustration is the popular Equal Risk Contribution method. It’s applied regularly to the portfolio of strategies to equalize their risk contribution. For more details about the methodology, see Quantpedia’s Risk Parity Primer.
Maximum Diversification. Another popular risk parity method aims to maximize the so-called “diversification ratio”, or in other words the effective number of bets. Maximum Diversification is also part of Quantpedia’s Pro toolbox. For more details about the methodology, see Quantpedia’s Risk Parity Primer.
Markowitz’s mean-variance optimization. The most classical strategy allocation method cannot be missing in Quantpedia Pro’s toolbox. Different portfolio variants such as minimum variance, maximum return or tangency portfolio (maximum Sharpe) with different asset constraints and on different time periods are part of the toolbox. For more details about the methodology, see Quantpedia’s Markowitz Mean-Variance Primer.
Clustering and Cluster Risk Parity. A popular statistical data categorization technique – clustering – may be pretty helpful also in strategy allocation. Thanks to clustering, one is able to identify hidden similarities and dissimilarities among strategies and thus group the strategies into clusters. One may then apply risk parity to these clusters – to ensure the same amount of risk is allocated to each cluster, a.k.a. each strategy type. For more details about the methodology, see Quantpedia’s Clustering and Cluster Risk Parity Primer.
All of the allocation strategies above are designed to simulate real-life implementation – the data is “point in time”, i.e. without any look-ahead biases, they also use the 1-day implementation lag and several other features to model real investment applications.
Results
Without further ado, let’s now jump directly to the results of all strategy allocation methods described above applied to five US equity stock momentum strategies.
Simple Volatility Targeting

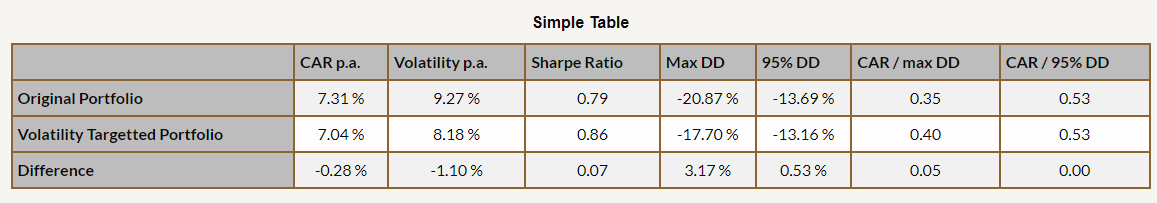
We may easily observe that volatility targeting achieved its goal pretty well here – it smoothed the equity curve and lowered the overall volatility with only a slightly lower return. On the whole, all three risk-return characteristics – Sharpe ratio, Calmar ratio and CAR/95DD either stayed the same or improved. Thus, it may be concluded that volatility targeting clearly improves the risk-return profile of the selected portfolio of US stock momentum strategies.
Equal Risk Contribution
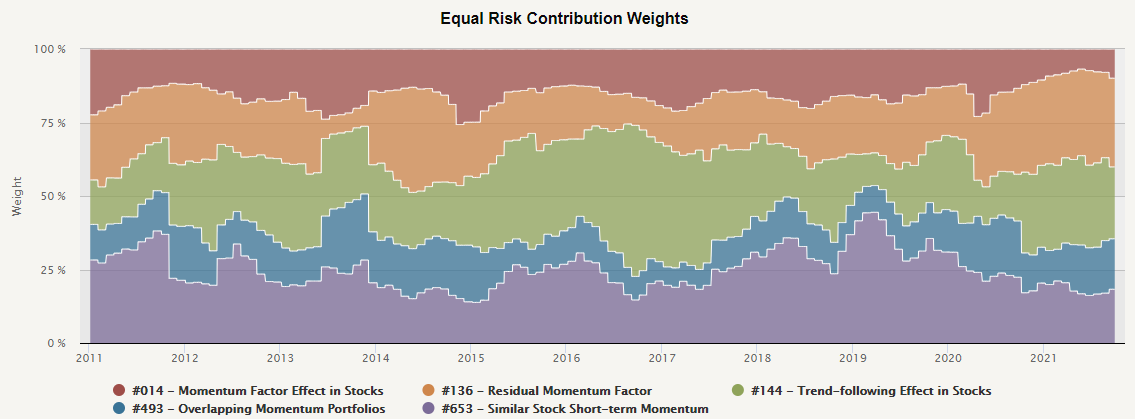
The first figure above shows how Equal Risk Contribution equalized the risk contribution of 5 momentum strategies by changing relative weights over time. The riskiest strategy seems to be the most concentrated strategy – “Overlapping momentum portfolios” (with lowest weights). On the other hand, allocation, among other strategies, varies in time.
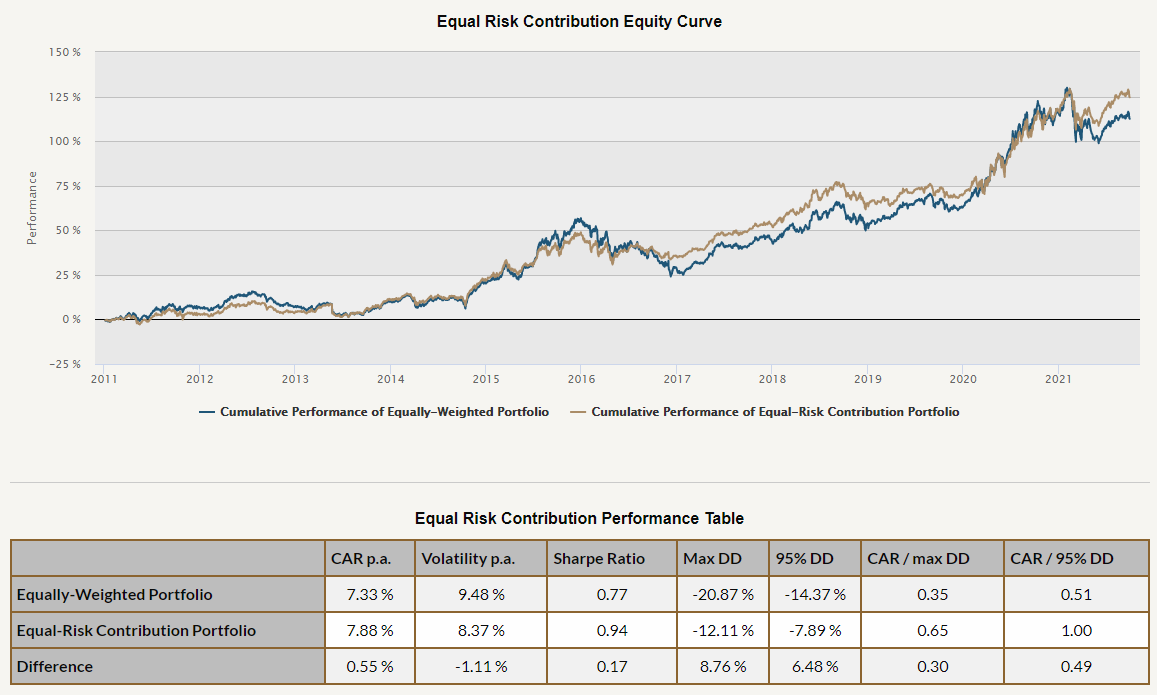
Secondly, we may observe in the figure and table above the risk-return characteristics of the equal risk contribution strategy allocation. ERC apparently smoothed the equity curve, lowered the drawdowns and even amplified the return of the strategies. We see that drawdown characteristics dropped significantly, while return increased by more than 0.5% p.a.. This substantially pushed the risk-return ratios of the momentum strategy combination higher.
Maximum Diversification
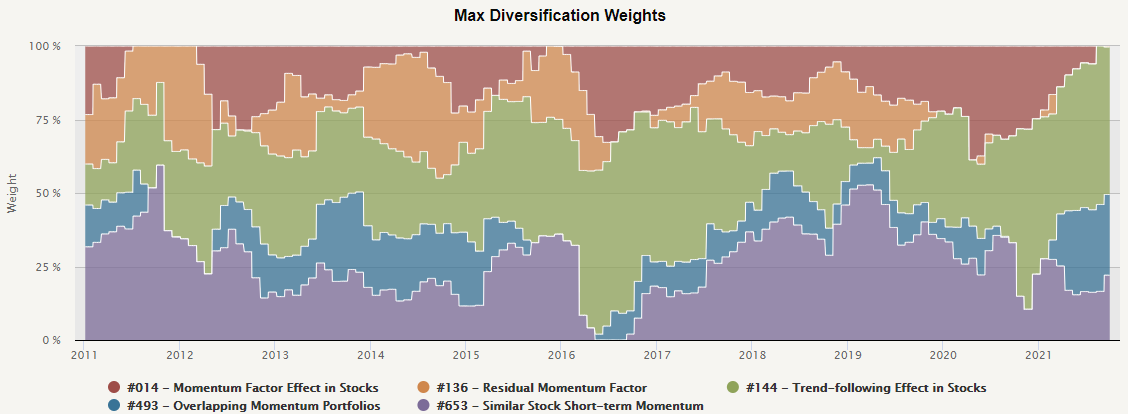
Maximum diversification aims at maximizing the diversification ratio as described here. As a consequence, it over-weights assets with better diversification properties and, vice versa, under-weights assets with worse diversification abilities.
In the figure above, we may observe the strategy allocation evolution in time when applied to our 5 momentum strategies. It seems that the long-only strategy “Trend-following effect in stocks” performed as the best diversifier most of the time, receiving the biggest allocation in most of the situations – though not in all of them.
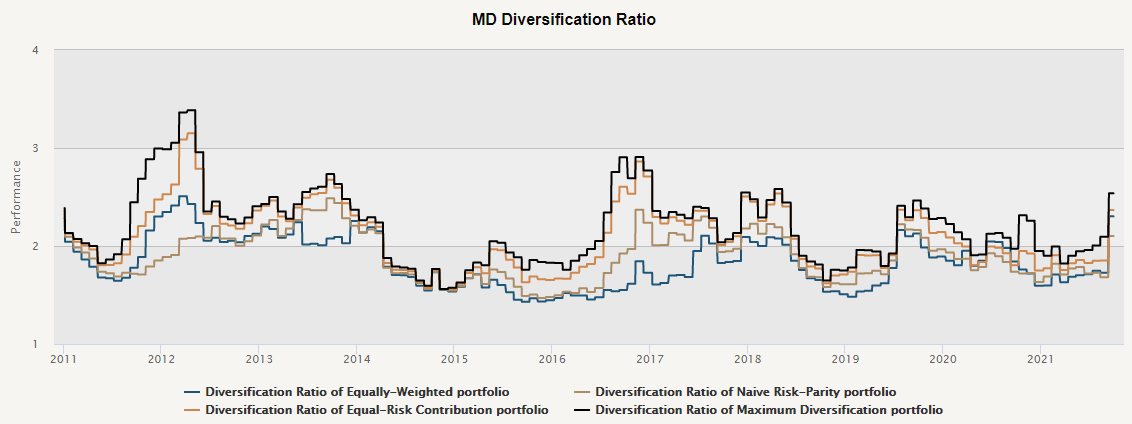
In the second figure above, a so-called Diversification Ratio is depicted for 3 different versions of risk parity + an equally weighted benchmark. We may observe that the diversification ratio truly was the highest throughout the entire period under scrutiny in the case of the Maximum Diversification strategy.
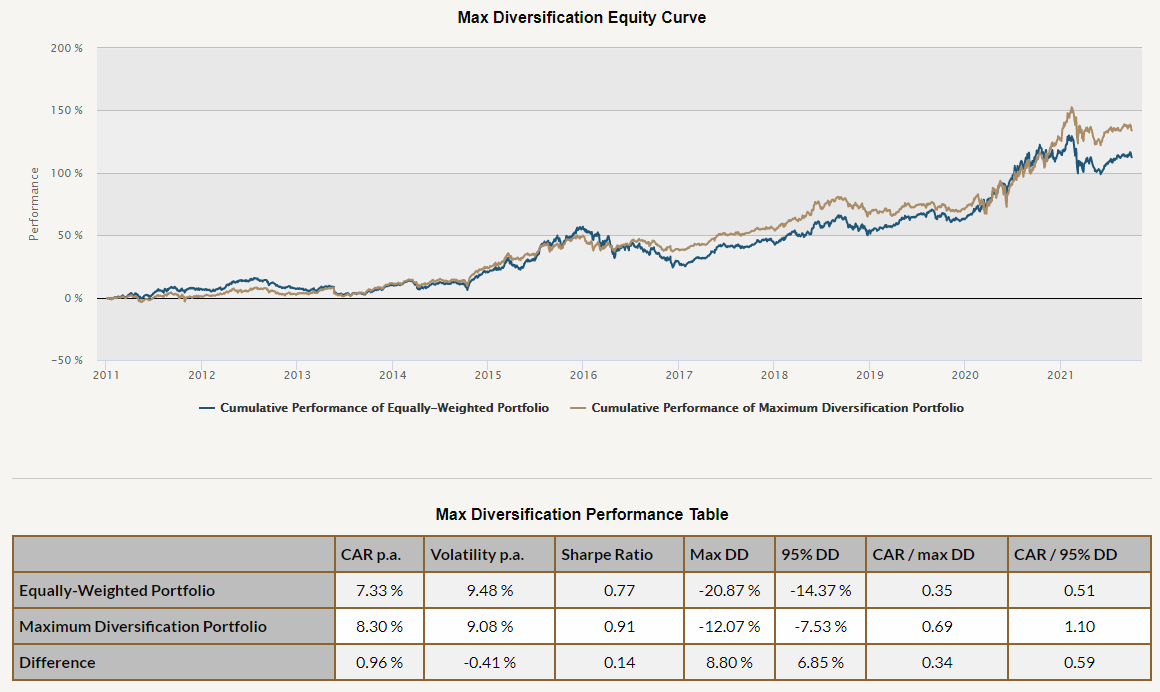
The Maximum Diversification strategy allocation increased the return by almost 1% p.a. compared to the equally weighted benchmark. Moreover, it also significantly reduced drawdowns and also volatility. The resulting equity curve is thus smoother, and return-to-drawdown ratios doubled.
Markowitz Mean-Variance Optimization

The first chart above depicts the famous efficient frontier from the portfolio theory of Harry Markowitz for the 5 US stock momentum strategies (for their entire history). The constraints of non-negative weights summing to 1 are included in the implementation.
Firstly, we may observe that the equal weight allocation (looking backward) was sub-optimal. It was possible to achieve more than 2.5% p.a. higher return just by reshuffling the strategy weights. Was it possible to achieve better risk-adjusted returns also in a forward-looking way? Continue reading below.
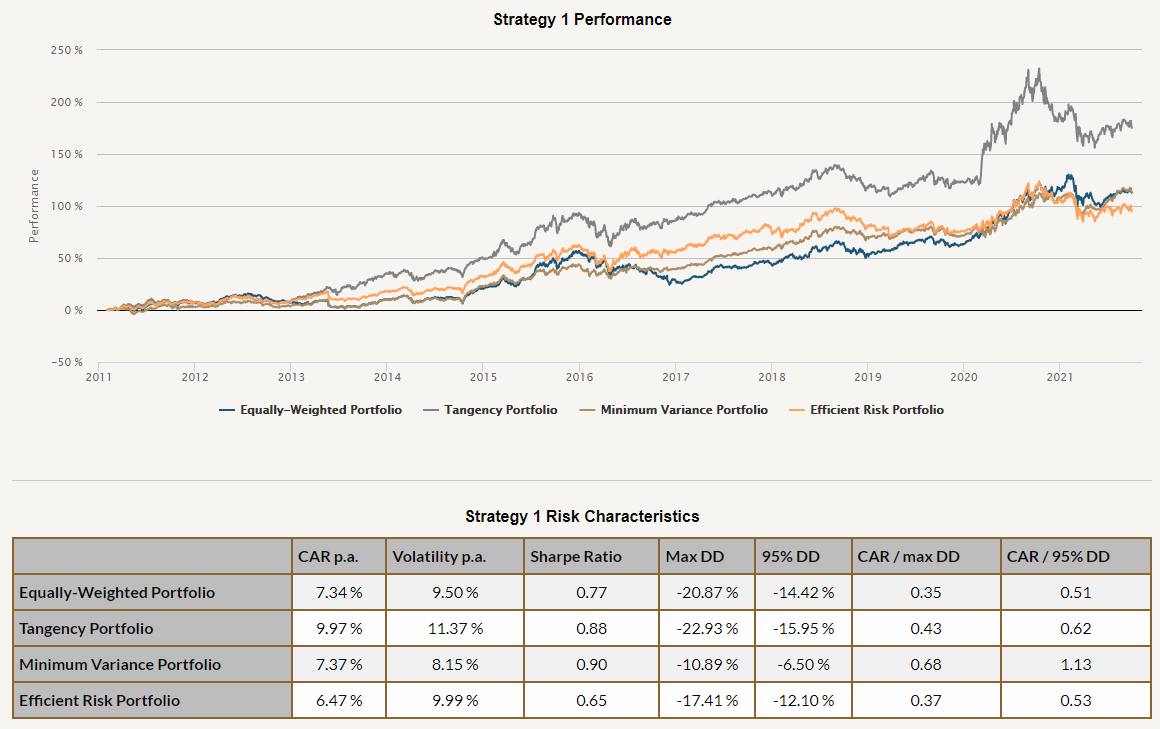
The picture above illustrates 3 different allocation strategies based on the mean-variance optimization and their development in time. These, and several more strategies, are also part of the Quantpedia Pro’s toolbox and may be applied to any strategies from Quantpedia’s strategy database, any ETFs or any data of your choice.
Strategies use only the data available at the particular point in time and optimize based on that to simulate a real-life implementation. We may observe, that all strategies have improved return-to-drawdown ratios compared to the equally weighted strategy benchmark. Sharpe ratio is higher for 2 out of 3 allocation strategies.
Clustering and Cluster Risk Parity
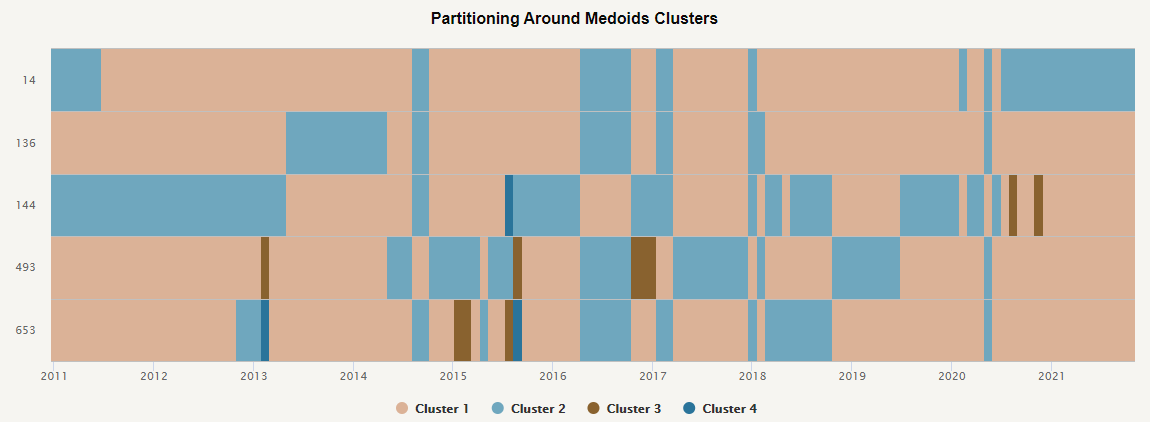
The first chart above depicts the clustering evolution in time for 5 US stock momentum strategies and one of the Quantpedia’s pre-coded clustering methods – Partitioning Around Medoids (PAM). We may observe that clusters varied a lot in time but usually remained stable for couple of months. We can also see that for the majority of time there were just 2 main clusters, however there were brief periods where there were 3 or even 4 clusters identified.
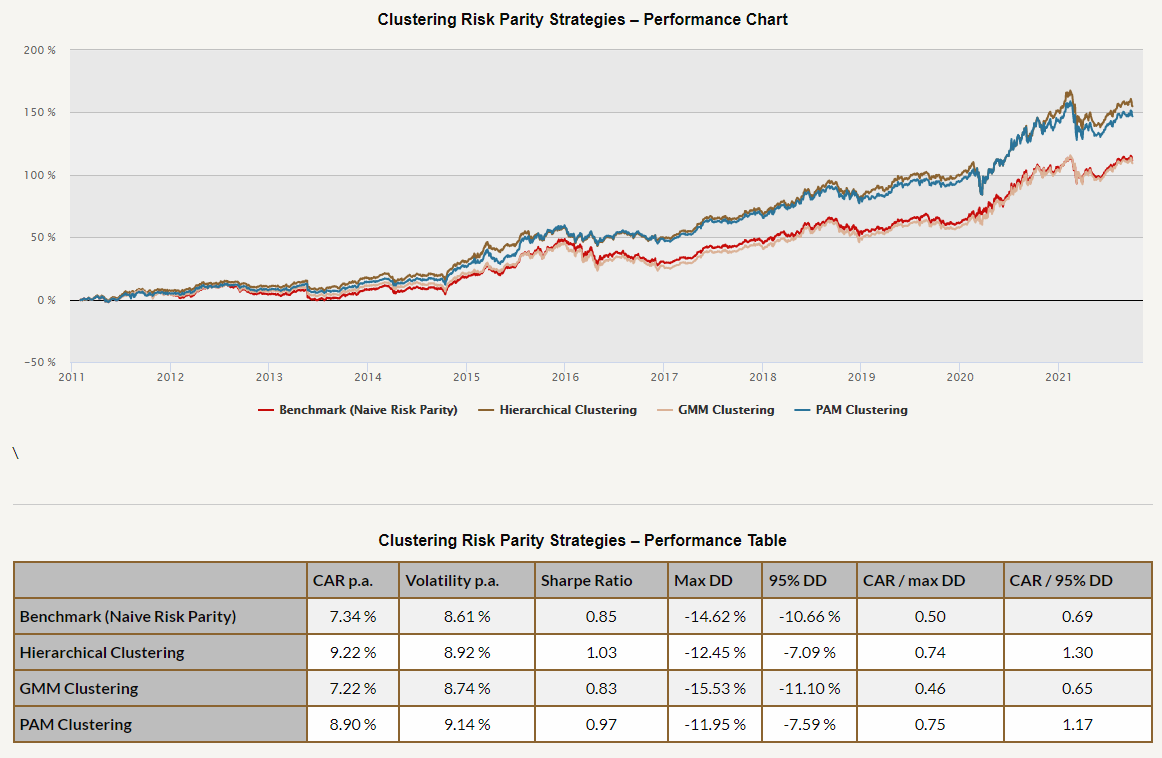
Quantpedia Pro’s Clustering report also analyzes several different allocation strategies based on various clustering methods. The benchmark in the table above and in the chart above is set as a Naive Risk Parity allocation.
We may observe that all Clustering allocation strategies achieved superior risk-return ratios compared to the equally weighted benchmark depicted above earlier; 2 out of 3 also beat naive risk parity allocation. Moreover, hierarchical clustering and PAM clustering more than doubled the return-to-drawdown ratios compared to the original equal-weight strategy allocation.
Last but not least, hierarchical clustering allocation seems to have achieved the best Sharpe ratio out of all allocation strategies analyzed in this article.
Conclusion
We picked 5 similar yet different strategies out of Quantpedia’s database of almost 700 quantitative investment strategies. All the strategies utilized some kind of momentum methodology applied to US stocks.
Secondly, we picked and described 5 of the pre-coded asset and strategy allocation methods from Quantpedia Pro’s toolbox. The methods were based on volatility targeting, risk parity, mean-variance optimization and clustering.
We showed that it’s possible to improve all – the return, the risk and return-to-risk ratios by combining strategies in a more sophisticated way than just using an equal weight allocation or naive risk parity allocation. When used properly and with caution, advanced allocation strategies may significantly improve risk-adjusted returns even in real-life implementations.
Are you looking for more strategies to read about? Sign up for our newsletter or visit our Blog or Screener.
Do you want to learn more about Quantpedia Premium service? Check how Quantpedia works, our mission and Premium pricing offer.
Do you want to learn more about Quantpedia Pro service? Check its description, watch videos, review reporting capabilities and visit our pricing offer.
Do you want algorithmic access to the full Quantpedia database via the API? Subscribe to Quantpedia Pro, ask for an API key, and explore the in/out-of-sample statistics, source academic papers, and code snippets — ideal for quantitative research, systematic trading workflows, and AI model training.
Are you looking for historical data or backtesting platforms? Check our list of Algo Trading Discounts.
Or follow us on:
Facebook Group, Facebook Page, Telegram, Twitter, Linkedin, Medium or Youtube
Share onLinkedInTwitterFacebookRefer to a friend


