Media Attention and the Low Volatility Effect
The low volatility factor is a well-known example of a stock trading strategy that contradicts the classical CAPM model. A lot of researchers are trying to come up with an explanation for driving forces behind the volatility effect. One such popular explanation is the ‘attention-grabbing’ hypothesis – which suggests that low-volatility stocks are ‘boring’ and therefore require a premium relative to ‘glittering’ stocks that receive a lot of investor attention. Research paper written by Blitz, Huisman, Swinkels and van Vliet tests this theory and concludes that ‘attention-grabbing’ hypothesis can’t be used to explain outperformance of low volatility stocks.
Related to: #7 – Low Volatility Factor Effect in Stocks
Authors: Blitz, Huisman, Swinkels, van Vliet
Title: Media Attention and the Volatility Effect
Link: https://papers.ssrn.com/sol3/papers.cfm?abstract_id=3403466
Abstract:
Stocks with low return volatility have high risk-adjusted returns, which might be driven by low media attention for such stocks. Using news coverage data we formally test whether the ‘attention-grabbing’ hypothesis can explain the volatility effect for a sample of international stocks over the period 2001 to 2018. Among stocks with a similar amount of media attention, a low-volatility effect is still present. Among stocks with similar volatility, the amount of media attention is not associated with significantly different risk-adjusted returns. Based on these findings, we reject the hypothesis that media attention is the driving force behind the volatility effect.
Notable quotations from the academic research paper:
“One of the assumptions behind the CAPM is that investors have complete information and that they rationally process this information. However, in reality investors only possess a limited amount of information. Instead of searching for all the information on every possible company, investors may only purchase the stocks of companies that are able to grab their attention. This investor behavior suggests that the prices of attention-grabbing stocks may be temporarily inflated, which subsequently leads to lower returns. Acadedmic research suggests that low-volatility stocks are ‘boring’ and therefore require a premium relative to ‘glittering’ stocks that receive a lot of investor attention.
Since data on aggregate media attention has recently become available, we are able to empirically examine its relation with volatility. In addition to indeed finding a positive association between a stock’s volatility and media attention, we empirically test whether the global low-risk anomaly can be explained by the attention-grabbing hypothesis. The two testable hypotheses are:
1. The low-volatility effect disappears for stocks with high media attention.
2. The low returns for high-volatility stocks are caused primarily by stocks of companies that appear most frequently in the news.
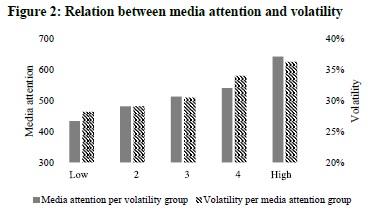
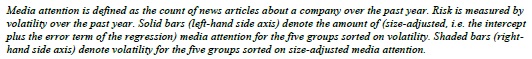
Figure 2 describes the relation between media attention and volatility. After dividing the stocks into five groups based on past volatility, we calculate the average size-adjusted media attention over time. It shows that there is an increasing pattern between volatility and media attention. Media attention increases for stocks in higher volatility groups, and volatility increases for stocks in higher media attention groups. This figure indicates that ‘glittery’ stocks tend to be the stocks with relatively high volatility, while the ‘boring’ stocks that the media does not write about tend to have relatively low volatility.
The positive correlation between media attention and volatility could imply that media attention explains the low-volatility effect, even when there is not a stand-alone media-attention effect. Our objective is to find the driving force behind the volatility effect, and we apply the commonly used double-sorting approach in order to disentangle the two effects. Each month, we independently sort stocks on both characteristics in five groups and then form 25 portfolios on each combination of media attention and volatility. We calculate next month’s return for each group, in which we equally weight each stock within the group.
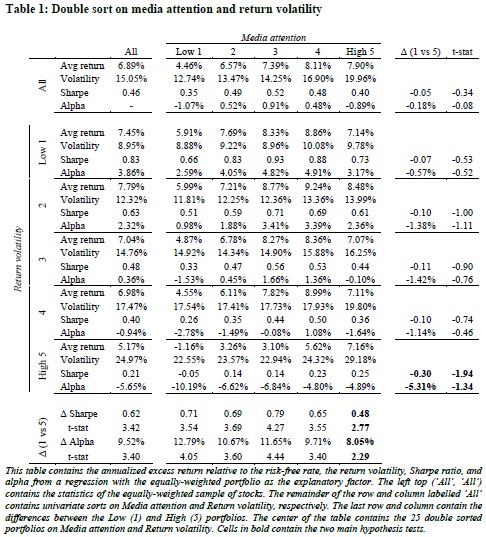
The average excess return of our sample of stocks is 6.89% per annum with a volatility of 15.05%, resulting in a Sharpe ratio of 0.46. The first column further shows that portfolios sorted on return volatility have a higher Sharpe ratio for the low-volatility portfolios and a lower Sharpe ratio for the high-volatility portfolio. The difference is statistically significant with a t-statistic of 3.42. The alpha of the low-volatility minus the high-volatility portfolio is 9.52% per annum and statistically significant with a t-statistic of 3.40.
For media attention to be able to explain the low-volatility effect, we should see that the low-volatility effect disappears for stocks with similar media attention. However, Table 1 shows that for each column with similar media attention, the Sharpe ratios are the highest for low-risk stocks and monotonously decline when volatility increases. The differences in Sharpe ratio are statistically significant, as are the alphas, which range from 12.79% for the low-attention group to 8.05% for the high-attention group.
For groups of similar volatility, the Sharpe ratios and alphas are statistically indistinguishable for stocks regardless of the amount of media attention. Based on these findings, we reject that the attention-grabbing hypothesis explains the volatility effect.
Are you looking for more strategies to read about? Sign up for our newsletter or visit our Blog or Screener.
Do you want to learn more about Quantpedia Premium service? Check how Quantpedia works, our mission and Premium pricing offer.
Do you want to learn more about Quantpedia Pro service? Check its description, watch videos, review reporting capabilities and visit our pricing offer.
Are you looking for historical data or backtesting platforms? Check our list of Algo Trading Discounts.
Would you like free access to our services? Then, open an account with Lightspeed and enjoy one year of Quantpedia Premium at no cost.
Or follow us on:
Facebook Group, Facebook Page, Twitter, Linkedin, Medium or Youtube
Share onLinkedInTwitterFacebookRefer to a friend


