Military Expenditures and Performance of the Stock Markets
Introduction
“Si vis pacem, para bellum“, is an old Roman proverb translated to English as “If you want peace, prepare for war”, and it is the main idea behind the military policy of a lot of modern national states. In the current globally interconnected world, waging a real “hot war” has very often really negative trade and business repercussions (as the Russian Federation realized in 2022). Still, even though wars among developed nations are luckily not as popular as they used to be, modern states heavily invest in their own defense. Nobody wants to be caught military unprepared in case of a local or global geopolitical crisis. A strong military should bring a safe environment to do business, and trade should flourish uninterrupted. But are all those national military expenditures financially rewarded? Do stock markets of countries with a strong military outperform their peers? That’s the question we have decided to answer in the following analysis.
Previous Articles
The current article is not the first to analyze geopolitics’ impact on the financial markets. If this topic is of interest to you, we also recommend two of our previous articles:
The second article is remade into the individual report for Quantpedia Prime/Premium/Pro clients and allows you to see the analysis of how your model portfolio would weather difficult geopolitical times such as the start of major wars, international crises, and deterioration of US presidents’ health.
Related Literature
We are, of course, not the first to ask how geopolitics affects markets.
Sakiru Adebola Solarin & Pritish Kumar Sahu (2015), in their “The effect of military expenditure on stock market development: panel evidence from system GMM estimates” examine the impact of military expenditure on stock market development in 36 countries from 1989 to 2010. The dynamic panel system (statistical method) GMM (generalized method of moments) estimates, are utilized within a panel framework to test the relationship with an array of control variables. They augment the traditional measure of military expenditure–military burden, with their newly constructed comprehensive index – the Global Militarisation Index. Overall, the results show that military spending negatively and significantly affects stock market performance in the selected 36 countries.
In contrast, almost entirely different conclusion comes from the paper of DiPietro, W.R., Anoruo, E. and Sawhney, B. (2008) named The Effect of the Size of the Military on Stock Market Performance in the United States and the UK of which uses regression analysis to investigate the relationship between military expenditure and stock market performance for the United States and the United Kingdom. Specifically, the study applies the Bierens-Guo unit root procedures to ascertain the time series properties of the variables in the study. The standard OLS technique is employed to determine the influence of military expenditure on stock markets from 1914 through 2001. The results from the OLS equations suggest that military expenditure significantly positively affects stock market performance for the United States and the United Kingdom. The implication of this finding is that the high-income class and people in power are less likely to oppose increases in military spending even though such expenditures are not in the best interest of society.
More generally, Rooney, Bryan, Grant Johnson, and Miranda Priebe ask How Does Defense Spending Affect Economic Growth? found that prioritizing defense spending over infrastructure investment, a long-standing domestic concern, might undermine economic growth and, therefore, resources available for defense in the long run. Economists generally believe that the rising U.S. public debt will eventually undermine growth, but there is disagreement as to exactly when or how. The economic literature is inconclusive on how increasing taxes to maintain or increase defense spending would affect economic growth.
An interesting note on market volatility during times of war comes from NBER’s article Why Stock Markets Are Less Volatile When the US Is at War: Rising defense spending lowers aggregate stock volatility and narrows the range of analysts’ forecasts of profits for defense-related firms, particularly those doing R&D and testing.
Data, Methodology & Approach
Our dataset for returns of stock markets in countries is the same as one used in our previous analysis of countries’ ETFs. The military expenditure data are published on a yearly basis. Therefore, we re-map monthly data (from the previous article) to EOY (end-of-year). Our previous article selectively omitted the US market, but we can’t do that when we want to analyze military expenditures, as the United States is the country with the highest military spending and strongest army in the world. Therefore, we added the representative of the broad U. S. market, SPY ETF, to the final list of countries and their ETFs:
| ticker | full name |
| SPY | SPDR S&P 500 ETF Trust |
| EWU | iShares MSCI United Kingdom ETF |
| EWG | iShares MSCI Germany ETF |
| EWQ | iShares MSCI France ETF |
| EWI | iShares MSCI Italy ETF |
| EWD | iShares MSCI Sweden ETF |
| EWN | iShares MSCI Netherlands ETF |
| EWP | iShares MSCI Spain ETF |
| EWK | iShares MSCI Belgium ETF |
| EWL | iShares MSCI Switzerland ETF |
| EWC | iShares MSCI Canada ETF |
| EWJ | iShares MSCI Japan ETF |
| EWW | iShares MSCI Mexico ETF |
| EWM | iShares MSCI Malaysia ETF |
| EWA | iShares MSCI-Australia ETF |
| EWS | iShares MSCI Singapore ETF |
| EWY | iShares MSCI South Korea ETF |
| EWT | iShares MSCI Taiwan ETF |
| EWZ | iShares MSCI Brazil ETF |
| EZA | iShares MSCI South Africa ETF |
| FXI | iShares China Large-Cap ETF |
| INDY | iShares India 50 ETF |
As a source of military expenditures/spending, we found a free alternative dataset (based on open sources only) provided by STOCKHOLM INTERNATIONAL PEACE RESEARCH INSTITUTE, found in its database named SIPRI Military Expenditure Database, which contains consistent time series on the military spending of 173 countries for the period 1949–2022. (In case you are interested, information on the sources and methods for SIPRI data, including methods for calculating calendar year data from financial year data, for calculating constant price US$ figures, and for estimating missing data for countries as part of the world and regional totals, see https://www.sipri.org/databases/milex/sources-and-methods.). From the available and actual Excel file, we have done pre-processing and filtering of relevant data from two corresponding sheets of interest:
1) Data for military expenditure by country in current US$ (millions), presented according to calendar year.
2) Data for military expenditure by country as a share of the GDP (gross domestic product), presented according to calendar year.
As mentioned above, we will focus on those two variables from the dataset to determine if they impact the overall performance of stock markets all around the world.
Final dataset construction
Yahoo Finance was chosen to collect data about ETFs from their inception. Then, we used the MSCI website to download missing country indices to enlarge the dataset to the maximum possible length. Our price dataset started on December 31, 1992. The military expenditure database is updated annually, and there is approximately a year-long lag between the publication of military spending. When getting all the data from the SIPRI dataset, we need to incorporate this reporting lag into the methodology. Therefore, as an example, we allocate/rebalance the portfolio at the end of December of 1992 for the year 1993 based on the 1991 military expenditure data of each country. And we continue like that year after year.
Recently, Yahoo Finance discontinued free end-of-day data downloads. As a result, we recommend sourcing data from our preferred provider, EODHD.com – the sponsor of our blog. EODHD offers seamless access to +30 years of historical prices and fundamental data for stocks, ETFs, forex, and cryptocurrencies across 60+ exchanges, available via API or no-code add-ons for Excel and Google Sheets. As a special offer, our blog readers can enjoy an exclusive 30% discount on premium EODHD plans.
Strategy
To study the impact of military expenditures, we tested simple long-short yearly rebalanced trading/investing strategies based on the investment universe mentioned before (consisting of 22 country ETFs). At the end of each year T, we invested long in X countries with the highest military expenditures, and at the same time, we shorted X countries with the lowest military expenditures as reported for year T-1.
We were undergoing a battery of tests changing X as:
- 1v1, 2v2, 3v3, 5v5, 7v7, 10v10 pairs;
- and we tested strategies with and without a U.S. ETF (SPY) representative. The United States is the biggest spender on the military in the world (in $ amounts, and most of the time also in the % of GDP amounts). Therefore, the SPY ETF is always picked in the long leg of our portfolio. We wanted to test the impact of military spending on the stock market performance when we removed the stock market of the country with the strongest army.
We tested 2 predictors – the total $ spending and % of GDP spending. All positions are equally weighted and rebalanced at the end of the year.
Results
Firstly, we analyzed total $ (USD) spending data. Of course, we found out that the U.S. always comes first; hence, we are always long SPY (plus other rich countries) against the one or more poor countries that spend the least in total $ on the military. The emerging market countries and small countries are usually those that spend the least, so this metric is more like going long USA + big countries against the “poor” emerging countries and small countries.
So, here we have results that are including the United States:
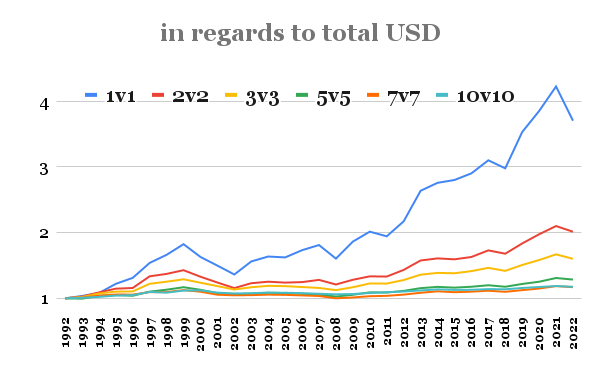
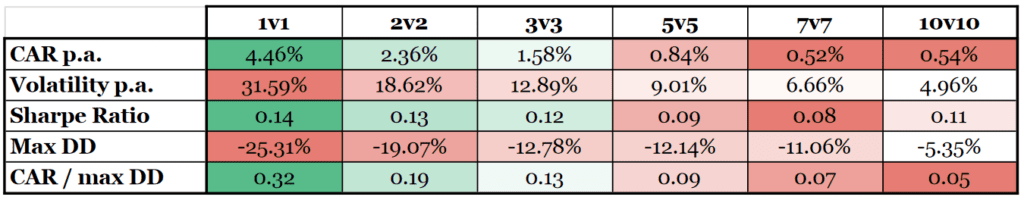
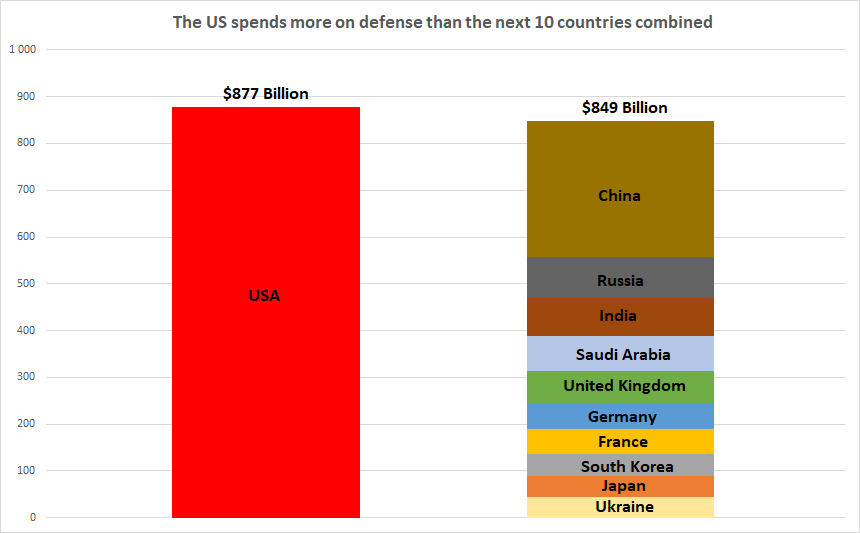
The US spends more on the military than the next ten countries in the ranking together. The US stock market outperformed the rest of the world over the last generation (roughly 30 years). It may be a coincidence, it may be not.
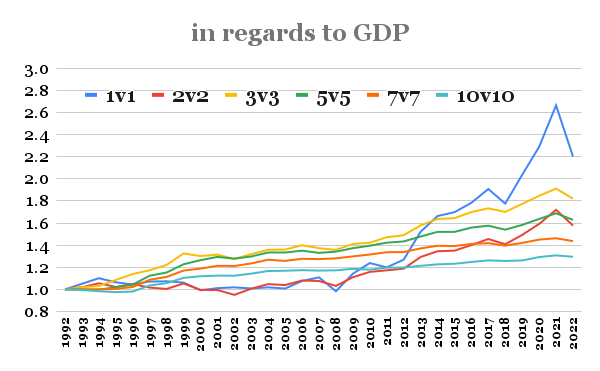
Therefore, we asked an interesting question: What is the impact if we try the same metric (total $ spending on military), but without the US?
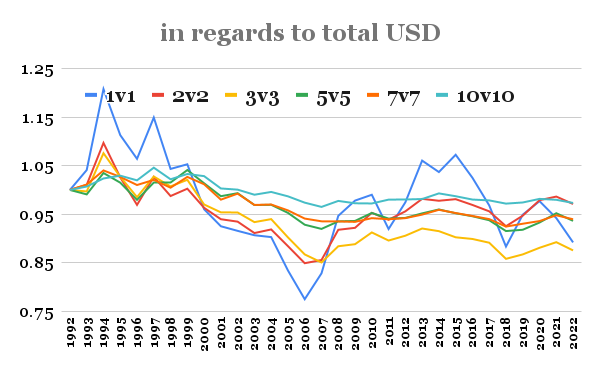
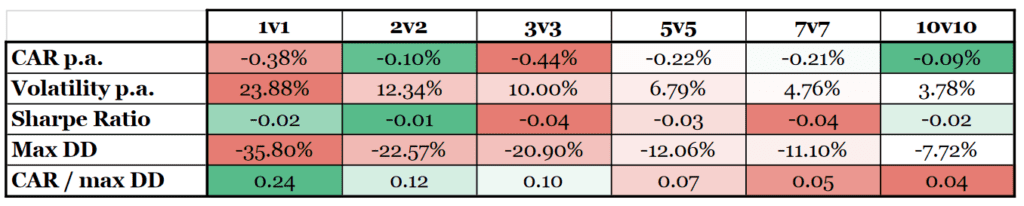
What the first chart and table of our analysis suggest is that if we go long big $ spenders and short the small $ spenders, our spread portfolio outperforms, but it is solely because of the US market outperforming and the US also having high military spending. But if we remove the US from the equation, then the military spending in total $ stops being a predictor at all.
Is the US case somehow special? It’s hard to say from the data we have. Military spending has no predictive ability for the rest of the world. But it may be possible that the high US military spending imposes some kind of “Pax Americana” that translates into favorable business opportunities only for the US companies. Our quick analysis hints there is some truth in the DiPietro, W.R., Anoruo, E. and Sawhney, B. (2008) paper. But we would probably need to run a longer test to draw stronger conclusions on the special case of the US.
Our next analysis was targeted to military spending as % of GDP.
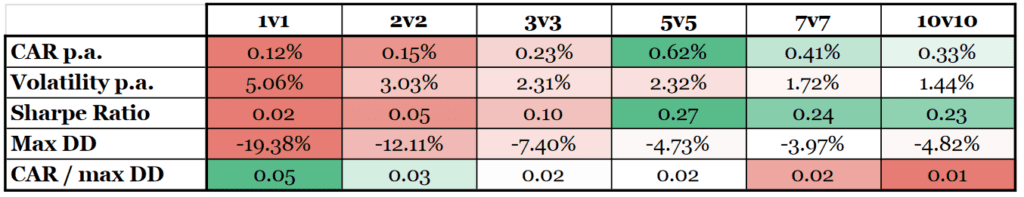
When we analyze military spending as % of GDP, then the US domination is not absolute. The US was replaced in first place by Taiwan (for 2 years) and Singapore (for 10 years) from 1993 to 2005. So how do the long-short strategies based on military spending as % of GDP (the US included) perform?
The results are almost the same as in the case of total $ spent (just a little worse). The military spending as % of GDP should level the field as now it is not so important how big the country is, just how much it spends on the military relative to its size. What we see from the chart and table is that countries that spend more on military usually outperform those that spend less. But the US is still included.
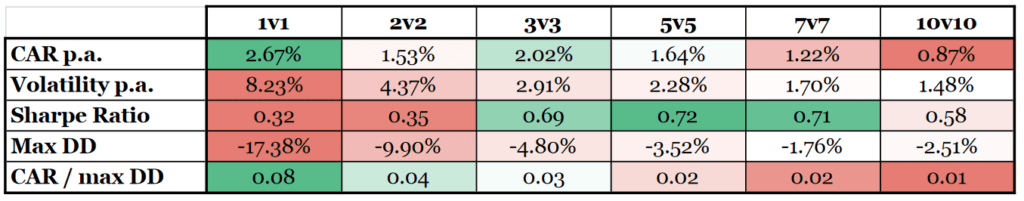
What if we remove the US from the investment universe? How do the strategies behave?
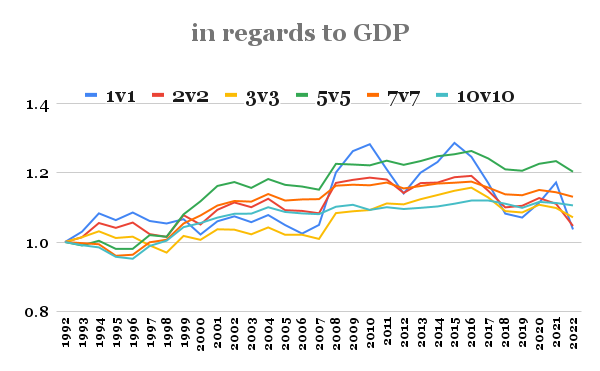
We can see that long-short strategies (without the US) based on military spending as % of GDP are faring slightly better than those based on total $ spending, as all performances are positive. However, the economic and statistical spread is close to insignificant.
Conclusion, Final Thoughts
So, what’s our conclusion? Our analysis hints that the US is really a special case among the countries. It has a strong economy, which allows it to invest a lot into the military, which helps to maintain a strong economy, which helps to invest a lot into the military sector, and so on and so on. For the US, the military expenditures paid well. But it’s not the case for other countries, where we were not able to find a significant relationship between military expenditures (in total $ terms or in % of GDP) and stock market performance.
However, one underlying factor can significantly impact the performance of the US stock market vs. the rest of the world. That factor is the strength/weakness of the US dollar. We have already analyzed how is the performance of stocks, commodities, and bonds influenced by the strength of the US dollar. We can suspect that the US dollar factor also impacts the performance of emerging and developed stock markets. It is our suspicion, but it is well-funded, as an article exploring this topic is already on the shelf, just not published :). We are just asking for some patience; we will soon present you with data ;).
International markets in our analysis are proxied by ETFs that are priced in US dollars and not in their respective local currencies. So, the analysis of the impact of military expenditures can potentially look differently if we analyze LCY returns of international stock markets, not their USD return.
But for the USD investor, our analysis holds. Theodore Roosevelt is known for the saying, “Speak softly and carry a big stick; you will go far“. It seems that this saying has some merit in it…
Are you looking for more strategies to read about? Sign up for our newsletter or visit our Blog or Screener.
Do you want to learn more about Quantpedia Premium service? Check how Quantpedia works, our mission and Premium pricing offer.
Do you want to learn more about Quantpedia Pro service? Check its description, watch videos, review reporting capabilities and visit our pricing offer.
Do you want algorithmic access to the full Quantpedia database via the API? Subscribe to Quantpedia Pro, ask for an API key, and explore the in/out-of-sample statistics, source academic papers, and code snippets — ideal for quantitative research, systematic trading workflows, and AI model training.
Are you looking for historical data or backtesting platforms? Check our list of Algo Trading Discounts.
Or follow us on:
Facebook Group, Facebook Page, Telegram, Twitter, Linkedin, Medium or Youtube
Share onLinkedInTwitterFacebookRefer to a friend


