Should We Rebalance Index Changes Immediately?
Passive index funds are believed to offer low fees, nearly limitless liquidity, very low trading costs and (most of the time) they beat most active managers. Although not all of the above are accurate, there are still many arguments in favour of passive indexing. However, what is often left forgotten are avoidable travails linked to index funds. Attempts to regain avoidable costs lead to differences in performance of the fund and the performance of the published index, to so-called tracking error. It is tracking error that fund managers seek to minimize, falsely believing that near-zero tracking error means near-zero trading costs.
In general, after an index rebalances, traditional cap-weighted index funds buy high and sell low. Their tendency to add recent highfliers and drop unloved value stocks is what causes investors to lose. Arnott et al. (2022) target the stock selection problem around index rebalancing and propose several ideas on how to adjust index strategies in order to earn above-market returns. Authors focus on S&P 500 as the most widely followed equity index and begin their analysis in October 1989, when S&P began preannouncing changes in the composition of the index together with the “effective date” for when those changes go into effect. They present simple ways to construct an index, thanks to which it is possible to reduce both negative effects of buy-high/sell-low dynamic and the turnover costs of cap-weighted indices.
One simple tactic is to trade at the announcement date (i.e. immediately after an index change is announced). Another way to improve performance is lazy trading, meaning delaying rebalancing by a year. Finally, investors are encouraged to create alternative 500-stock universes. To decide which stocks to add to an index and which to delete they would use long-run averages or fundamental size of a business, and then cap-weight the resulting list. To further reduce turnover and its costs, banding and seasoning seem to work, as they leave out companies that come the list and then quickly fall off the list. All of these strategies positively affect portfolio returns and prove that focusing on zero tracking error does not always have to be the best choice.
Authors: Rob Arnott, Chris Brightman, Vitali Kalesnik and Lillian Wu
Title: The Avoidable Costs of Index Rebalancing
Link: https://papers.ssrn.com/sol3/papers.cfm?abstract_id=4099610
Abstract:
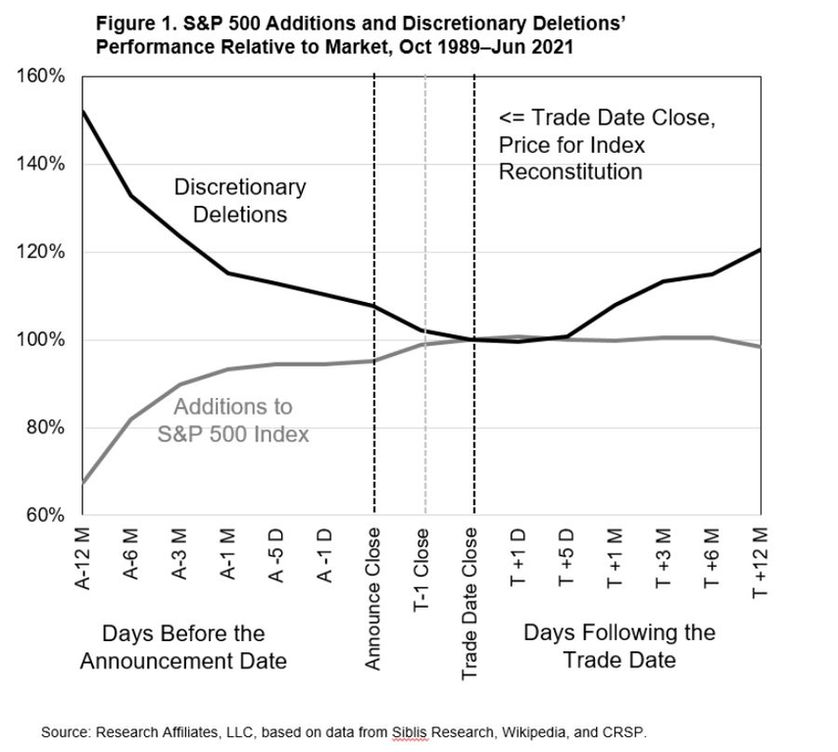
Traditional capitalization-weighted indices generally add stocks with high valuation multiples after persistent outperformance and sell stocks at low valuation multiples after persistent underperformance. For the S&P 500 Index, in the year after a change in the index, additions lose relative to discretionary deletions by about 22%. Simple rules, such as trading ahead of index funds or delaying reconstitution trades by 3 to 12 months, can add up to 23 basis points (bps). This benefit doubles when we cap-weight a portfolio not selected on market value, but based on the fundamental size of a business or its multi-year average market cap.
Notable quotations from the academic research paper:
“The most important Achilles’ heel for index funds is the very avoidable buy-high/sell-low dynamic of adding recent highfliers and dropping deeply out-of-favor stocks, sometimes near a nadir in price. This momentum-chasing selection bias causes investors to lose, on average, tens of basis points of performance annually.
Using the S&P 500, we have shown that the buy-high/sell-low dynamic of traditional large-cap indices hurts investors two ways: the price impact of billions of dollars in stocks being traded on index trade dates as well as a subsequent pattern of mean reversion in the affected companies’ relative performance.
The stocks added to the index outperform the market, on average, by 46.5% in the period covering 12 months before the announcement until the index adds these names, whereas the stocks sold by the index lag the market by 36.3% over the same period. In the year after the trade date, the situation reverses and the deletions outperform the additions by over 22%, with the lion’s share of the difference coming from the deletions.
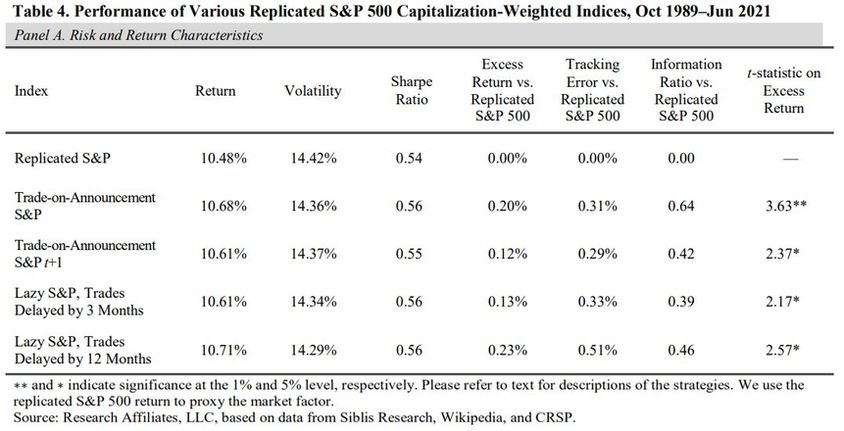
…we simulated four indices based on the S&P 500 and progressively introduced changes to each of the simulated indices to gauge the effect of each change. The four simulated indices are 1) a replication of the S&P 500; 2) a replication that makes the index changes on the announcement date, as was the case for the S&P 500 prior to October 1989; 3) another replication that makes the index changes on the day after the announcement; and 4) a replication that delays trades by a 3- or a 12-month lag—which we call “lazy rebalancing”—after a large portion of the mean reversion in price has taken place.
The lazy-replicated S&P 500, delayed by 3 months and 12 months, outperforms the replicated S&P 500 by 13 bps and 23 bps, respectively. The difference in the returns reflects part of the return drag experienced by S&P 500 investors due to the buy-high/sell-low dynamic.
Instead of buying stocks that have recently soared in price and selling those that have recently plunged, an investor can choose to cap-weight a different portfolio of 500 stocks, chosen based on measures of company size that are less sensitive to recent price movements. For example, not unlike the strategies explored by Arnott, Beck, and Kalesnik (2015), an investor can use a multi-year average of market capitalization as a relevant measure of company size. An added benefit of using the average of multi-year market capitalization is lower turnover. Better still, if we select the 500 stocks based on the fundamental size of a business—using its footprint in the macroeconomy rather than its market value—and then cap-weight the list, results are even more powerful. Other techniques, such as banding and seasoning, which we will discuss later, can further limit turnover.
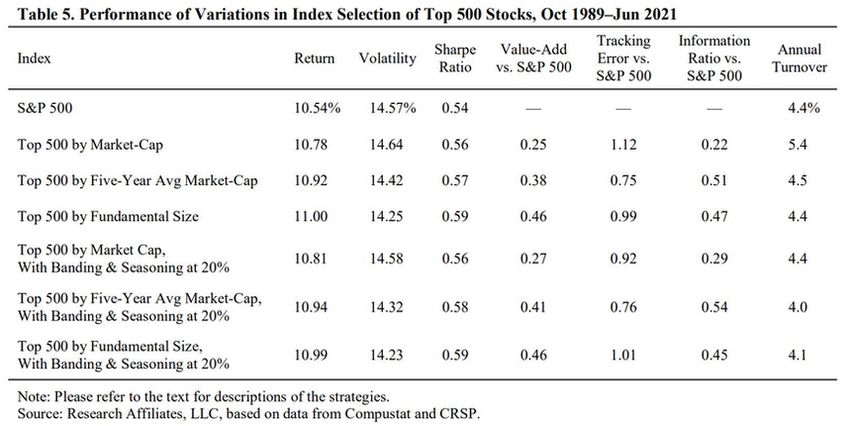
Banding is a technique that lessens the sensitivity of turnover to small changes in a company’s rankings around the target boundary. For example, banding at 20% means that a stock held in the portfolio would need to drop in size to a rank of 600 or higher to be excluded from the portfolio and would need to increase in size to a rank of 400 or lower to guarantee its inclusion in the portfolio. Seasoning means that a stock needs to rank at 400 or lower for two consecutive years in order to be added to the index or to rank at 600 or higher for two consecutive years in order to be dropped. These stipulations largely eliminate the propensity to buy the latest highflier just before it tanks or to sell an unloved stock in free-fall just before it rebounds. They also lower turnover by reducing the risk of reversing the trade a year or two later. The index is rebalanced annually and its constituents are weighted based on market capitalization.
The top 500 by fundamental size strategy outperforms the S&P 500 by 46 bps, the highest magnitude of outperformance among the variants we tested. This evidence validates the idea that using a company’s fundamental size to decide an index’s composition is a powerful remedy for the buy-high/sell-low drawback of a traditional cap-weighted index, which selects stocks based on market capitalization.
We find that with each additional step of 1) averaging historical market-cap to select stocks, 2) banding and seasoning to inhibit pointless trades, and 3) applying both approaches in one strategy, investors can add value while reducing risk. Selecting index constituents by fundamental company size, with the application of banding and seasoning, is even more powerful, with the highest value-add and one of the lowest levels of turnover of any of the strategies we tested.”
Are you looking for more strategies to read about? Sign up for our newsletter or visit our Blog or Screener.
Do you want to learn more about Quantpedia Premium service? Check how Quantpedia works, our mission and Premium pricing offer.
Do you want to learn more about Quantpedia Pro service? Check its description, watch videos, review reporting capabilities and visit our pricing offer.
Are you looking for historical data or backtesting platforms? Check our list of Algo Trading Discounts.
Would you like free access to our services? Then, open an account with Lightspeed and enjoy one year of Quantpedia Premium at no cost.
Or follow us on:
Facebook Group, Facebook Page, Twitter, Linkedin, Medium or Youtube
Share onLinkedInTwitterFacebookRefer to a friend


