Stocks Not For the Long Run?
There are very few observations of the attributes of financial markets that are considered by most of the investors as nearly permanent facts. One of the most often cited examples is that over the long interval stocks outperform bonds. But is it really such truth? Over how long interval? 10 years, 20 years, 30 years? As the new and better historical data are becoming available for analysis, they show interesting findings. Let’s show one example. There exist one very long interval during which the return of stocks was nearly equal to bonds. What do you think is the length of such an interval in the case of the US? It’s 150 years! Yes, that’s correct, there was a one-and-half-century long period in the history of the United States when the performance of stocks and bonds was nearly identical. We do not imply that it will be the case in the 21st century. But an important research paper written by Edward McQuarrie shows that investors must prepare for even the most unexpected possibilities when they are making their asset allocation decisions.
Author: McQuarrie
Title: The US Bond Market before 1926: Investor Total Return from 1793, Comparing Federal, Municipal and Corporate Bonds Part II: 1857 to 1926
Link: https://papers.ssrn.com/sol3/papers.cfm?abstract_id=3269683
Abstract:
From 1857 scholars have relied on Macaulay (1938) to track changes in interest rates during the period before the Ibbotson data begin. Holding period returns, where of interest (e.g., Siegel 1992a, 1992b), have been calculated from summary yield inputs such as those tabulated by Homer (1963), rather than observed prices of individual bonds. Here in Part II of the paper I explain how Homer got Macaulay wrong, misleading downstream compilers such as Siegel, and causing him to under-estimate 19th century bond returns. Values in Homer taken from Macaulay are not yields, but mathematical constructions erected on a (distant) foundation of observations. I correct Siegel’s under-estimate by retrieving bond prices from Macaulay’s sources and calculating holding period returns directly. I also correct a more general failure to treat Federal bonds properly during the greenback era. In the aggregate I find real bond returns in the second half of the 19th century to be about 150 basis points higher than Siegel. With this correction, in conjunction with corrected stock returns before 1871, I find that bond returns matched stock returns over the entire 19th century. The “stocks for the long run” thesis now appears to be a mistaken extrapolation from a few decades in the middle of the 20th century. No support for it can be found in the 19th century.
Notable quotations from the academic research paper:
“Today’s investors believe themselves to possess a 200-year history of bond market returns, courtesy of Siegel (1992a – The Equity Premium: Stock and Bond Returns Since 1802). That history purports to show bond returns over the long-term to be decisively inferior to those provided by stocks. The empirically demonstrated inferiority of bonds jibes with standard finance theory that investment returns should line up with market risk assumed. Under this theory, bonds, the risk-less asset, cannot out-perform stocks, a risk asset, over long intervals.
However, few investors have probed deeply into Siegel’s sources, especially those pertaining to the distant past. I found important mistakes in Homer (1963), a crucial data source for Siegel. I will also highlight the limitations of the bond data available to Siegel and other prior compilers, while introducing new bond price data not heretofore available. Net of the new and corrected data, 19th century bond returns appear to be much stronger than Siegel in his famous book “Stocks for the Long Run” understood.
The goal of the paper is to capture the returns that an investor would have earned by owning an index fund tracking long-term, investment-grade bonds, had such a thing existed in the 19th century US. This investor does not seek to own the single best or most secure bond, but to maximize risk-adjusted returns by holding a portfolio of investment-grade bonds, whose yields vary but all of which promise at least good security. The new data indicate that in fact, long bonds in the United States did out-perform stocks over several multi-decade periods following 1793.
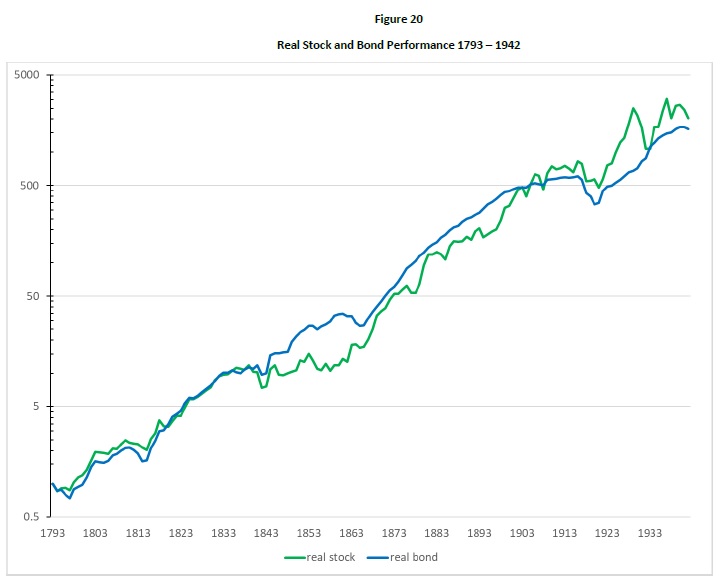
Figure 20 compares the new stock index to the new bond index through January 1942; the reasons for this initial choice of stopping point will shortly emerge. It is apparent at a glance that over the first 107 years of the US markets, up to about 1900, stocks and bonds returned nearly the same amount, a little under 6% real in each case. That level of return is much higher than the 3.6% attributed to bonds by Siegel, but somewhat lower than the 6.6% return expected of stocks. Put another way, bonds did much better during the 19th century than most investors realize, while stocks did somewhat worse than many investors might expect.
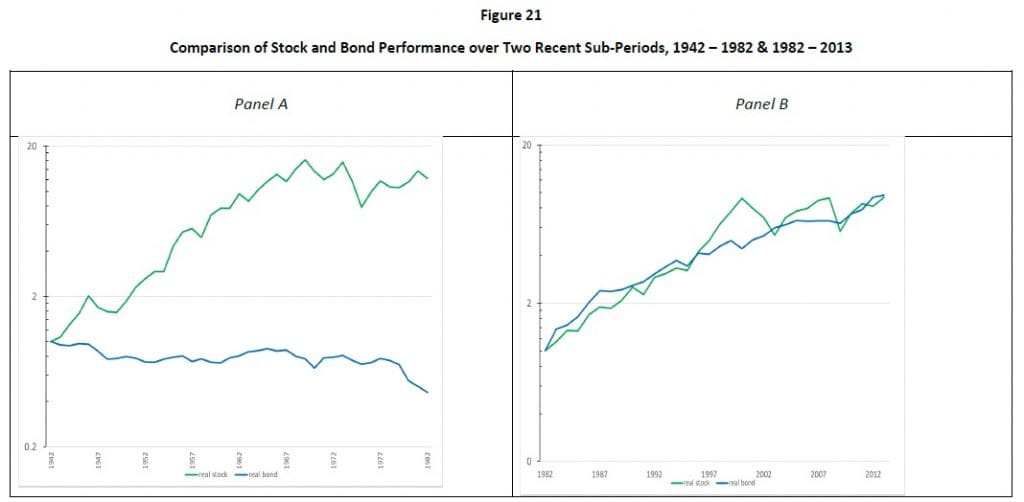
Next, Figure 21 takes the stocks and bond series down to January 2013. It is split into two panels, each of which spans several decades. Examining Panel B of Figure 21 first, this very recent thirty-one-year period gives the same impression as Figure 20: the past few decades have once again seen a horse race between stocks and bonds. Through the mid-1990s stocks and bonds are neck and neck, with bonds enjoying a slight lead which peaks after the Crash of 1987 (barely visible on an annual scale when only January 1987 and January 1988 values are plotted). After the mid-1990s the dot.com boom emerges, producing the distinct triangular shape seen earlier in the 1920s (cf. Shiller 2015), in which stocks soar far above bonds for a few years, before crashing back down. Next, the housing boom which ended in the Great Recession of 2008-2009 is visible as another triangle. By January 2013 stocks and bonds are once again at parity, just as they had been in 1900 and as of January 1942: over the thirty-one years charted in panel B, these two assets returned about the same.
Turning now to Panel A of Figure 21, these forty years look completely different from anything seen in the preceding 149 years charted in Figure 20. We see not a sharp triangle but an ever-widening fan. Over these decades an investment of one dollar in stocks returned a real $12.19 while an investment in bonds lost over 50%, turning one dollar into a real $0.46. Abysmal!
Nothing like this multi-decade losing stretch for bonds had ever occurred before. Although there had been past instances of poor multi-decade returns (e.g., the decades ending in 1920, or the periods ending in 1866 or 1815, see Figure 20), those bond slumps had all been constituted by sharp drops associated with war or its aftermath. Never before had bonds gone down and down, year after year, and decade after decade. By contrast, the performance of stocks from 1942 to 1982 was more or less normal.
In lengthy historical data sets, if one century is mostly characterized by high and higher rates of inflation (i.e., the 20th), then we would expect bonds to do poorly in that period—as we know occurred. If another century was characterized by long periods of steady or declining prices (i.e., the 19th), then we would expect bonds to do very well over that century, as new data have now revealed. To predict how bonds will do in the 21st and future centuries, we need merely to be confident about how inflation will play out in the future. If the 21st century is destined to be like the 20th century, then going forward bonds should again do poorly. If the 21st century turns out as the 19th century did, then bonds might again do quite well, over lengthy intervals. And, most important: if the 21st century follows some third pattern not yet seen, then we are left entirely uncertain how bonds will fare. Accordingly, we will then not be able to predict what the stock-bond relationship will be in the 21st century.”
Are you looking for strategies applicable in bear markets? Check Quantpedia’s Bear Market Strategies
Are you looking for more strategies to read about? Sign up for our newsletter or visit our Blog or Screener.
Do you want to learn more about Quantpedia Premium service? Check how Quantpedia works, our mission and Premium pricing offer.
Do you want to learn more about Quantpedia Pro service? Check its description, watch videos, review reporting capabilities and visit our pricing offer.
Do you want algorithmic access to the full Quantpedia database via the API? Subscribe to Quantpedia Pro, ask for an API key, and explore the in/out-of-sample statistics, source academic papers, and code snippets — ideal for quantitative research, systematic trading workflows, and AI model training.
Are you looking for historical data or backtesting platforms? Check our list of Algo Trading Discounts.
Or follow us on:
Facebook Group, Facebook Page, Twitter, Linkedin, Medium or Youtube
Share onLinkedInTwitterFacebookRefer to a friend


